ISSN 0439-755X
CN 11-1911/B
主办:中国心理学会
中国科学院心理研究所
出版:科学出版社
CN 11-1911/B
主办:中国心理学会
中国科学院心理研究所
出版:科学出版社
心理学报 ›› 2026, Vol. 58 ›› Issue (3): 558-568.doi: 10.3724/SP.J.1041.2026.0558 cstr: 32110.14.2026.0558
郭磊1,2( ), 秦海江1
收稿日期:2025-04-02
发布日期:2025-12-26
出版日期:2026-03-25
通讯作者:
郭磊, E-mail: happygl1229@swu.edu.cn基金资助:
GUO Lei1,2(), QIN Haijiang1
Received:2025-04-02
Online:2025-12-26
Published:2026-03-25
摘要:
心理学研究中, 确定心理特质的维度及其特征极为重要。探索性因子分析(EFA)是识别潜在维度的一种重要统计方法。准确识别因子数量是EFA的关键技术之一, 低估或者高估因子数量都会带来不良后果。为准确识别因子数量, 本研究将特征根视作序列数据, 采用长短期记忆(LSTM)网络构建的深度神经网络的各项评估指标(准确率、精确率、召回率、F1、Kappa)均在83%以上。通过大规模的模拟实验及实证研究, 验证了LSTM在不同数据条件中的性能。结果表明: LSTM比CDF、EKC和PA方法具有更高的准确率, 平均提升率为48.50%, 最大提升率高达171.09%。而且, LSTM比CDF、EKC和PA方法具有更小偏差, 表现出更好稳健性。研究者可使用R包LSTMfactors调用本研究所训练的LSTM分析实证数据。
中图分类号:
郭磊, 秦海江. (2026). 基于长短期记忆网络的探索性因子分析因子保留方法. 心理学报, 58(3), 558-568.
GUO Lei, QIN Haijiang. (2026). Factor retention in exploratory factor analysis based on LSTM. Acta Psychologica Sinica, 58(3), 558-568.
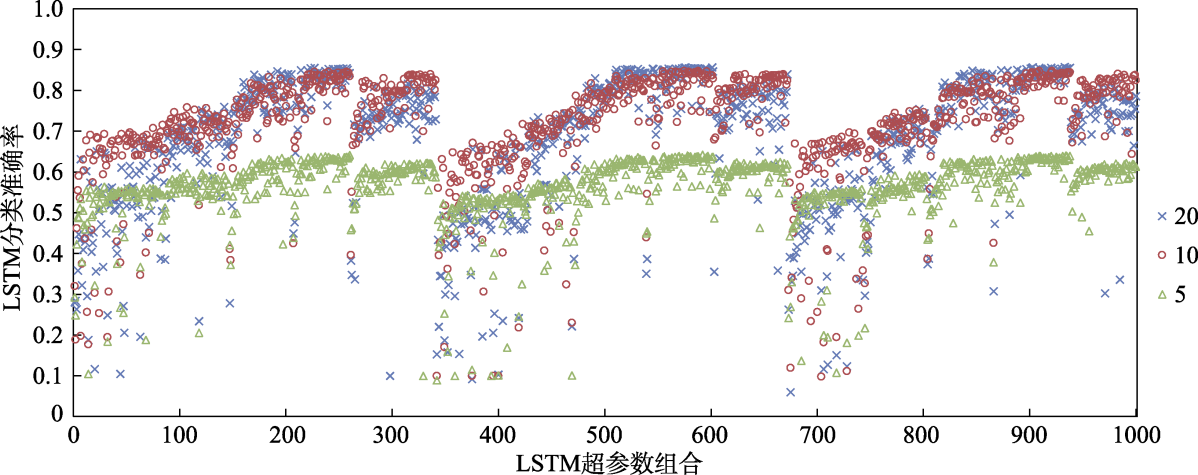
图1 不同序列长度的LSTM超参数随机搜索结果。相同横坐标表示超参数组合相同
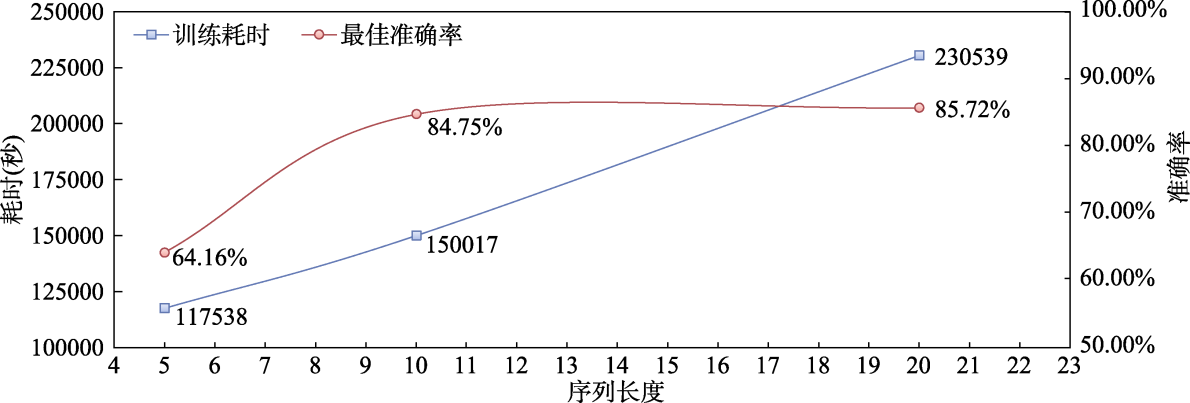
图2 不同序列长度LSTM的训练耗时及最佳准确率
| 最优的超参数组合 | 最优模型评价指标 | ||
|---|---|---|---|
| 超参数 | 值 | 指标 | 值 |
| 学习率 | 0.01 | Accuracy | 0.847 |
| LSTM层数 | 2 | Precision | 0.847 |
| LSTM每层节点数 | 32, 38 | Recall | 0.847 |
| 全连接网络层数 | 5 | F1-Score | 0.847 |
| 全连接层每层节点数 | 38, 39, 34, 31, 27 | Kappa | 0.831 |
| 激活函数 | Tanh | ||
表1 超参数调优结果
| 最优的超参数组合 | 最优模型评价指标 | ||
|---|---|---|---|
| 超参数 | 值 | 指标 | 值 |
| 学习率 | 0.01 | Accuracy | 0.847 |
| LSTM层数 | 2 | Precision | 0.847 |
| LSTM每层节点数 | 32, 38 | Recall | 0.847 |
| 全连接网络层数 | 5 | F1-Score | 0.847 |
| 全连接层每层节点数 | 38, 39, 34, 31, 27 | Kappa | 0.831 |
| 激活函数 | Tanh | ||
| 数据条件 | 水平 | 准确率acc | ||||
|---|---|---|---|---|---|---|
| CDF | EKC | PA | LSTM | 提升率 | ||
| 因子数量 | 1 | 0.677 | 0.922 | 0.944 | 0.969 | 2.58% |
| 2 | 0.722 | 0.715 | 0.677 | 0.879 | 21.69% | |
| 4 | 0.558 | 0.516 | 0.493 | 0.732 | 31.08% | |
| 6 | 0.450 | 0.419 | 0.394 | 0.523 | 16.17% | |
| 8 | 0.373 | 0.358 | 0.330 | 0.636 | 70.62% | |
| 10 | 0.313 | 0.319 | 0.280 | 0.865 | 171.09% | |
| 因子间 相关 | 0.00 | 0.686 | 0.724 | 0.761 | 0.901 | 18.29% |
| 0.25 | 0.619 | 0.650 | 0.662 | 0.867 | 31.00% | |
| 0.50 | 0.485 | 0.495 | 0.450 | 0.775 | 56.44% | |
| 0.75 | 0.273 | 0.298 | 0.206 | 0.527 | 76.96% | |
| 每因子 题目数量 | 4 | 0.370 | 0.416 | 0.381 | 0.772 | 85.47% |
| 7 | 0.547 | 0.568 | 0.547 | 0.765 | 34.51% | |
| 10 | 0.630 | 0.640 | 0.631 | 0.765 | 19.54% | |
| 主要载荷 | L | 0.332 | 0.347 | 0.376 | 0.687 | 82.60% |
| M | 0.525 | 0.564 | 0.540 | 0.784 | 39.14% | |
| H | 0.690 | 0.714 | 0.643 | 0.831 | 16.25% | |
| 交叉载荷 | L | 0.486 | 0.519 | 0.508 | 0.750 | 44.59% |
| H | 0.545 | 0.565 | 0.532 | 0.785 | 38.99% | |
| 样本量 | 100 | 0.286 | 0.299 | 0.309 | 0.637 | 106.58% |
| 200 | 0.429 | 0.461 | 0.454 | 0.755 | 63.70% | |
| 500 | 0.617 | 0.657 | 0.614 | 0.823 | 25.26% | |
| 1000 | 0.731 | 0.750 | 0.703 | 0.854 | 13.94% | |
表2 各数据条件下不同方法的因子数量保留准确率
| 数据条件 | 水平 | 准确率acc | ||||
|---|---|---|---|---|---|---|
| CDF | EKC | PA | LSTM | 提升率 | ||
| 因子数量 | 1 | 0.677 | 0.922 | 0.944 | 0.969 | 2.58% |
| 2 | 0.722 | 0.715 | 0.677 | 0.879 | 21.69% | |
| 4 | 0.558 | 0.516 | 0.493 | 0.732 | 31.08% | |
| 6 | 0.450 | 0.419 | 0.394 | 0.523 | 16.17% | |
| 8 | 0.373 | 0.358 | 0.330 | 0.636 | 70.62% | |
| 10 | 0.313 | 0.319 | 0.280 | 0.865 | 171.09% | |
| 因子间 相关 | 0.00 | 0.686 | 0.724 | 0.761 | 0.901 | 18.29% |
| 0.25 | 0.619 | 0.650 | 0.662 | 0.867 | 31.00% | |
| 0.50 | 0.485 | 0.495 | 0.450 | 0.775 | 56.44% | |
| 0.75 | 0.273 | 0.298 | 0.206 | 0.527 | 76.96% | |
| 每因子 题目数量 | 4 | 0.370 | 0.416 | 0.381 | 0.772 | 85.47% |
| 7 | 0.547 | 0.568 | 0.547 | 0.765 | 34.51% | |
| 10 | 0.630 | 0.640 | 0.631 | 0.765 | 19.54% | |
| 主要载荷 | L | 0.332 | 0.347 | 0.376 | 0.687 | 82.60% |
| M | 0.525 | 0.564 | 0.540 | 0.784 | 39.14% | |
| H | 0.690 | 0.714 | 0.643 | 0.831 | 16.25% | |
| 交叉载荷 | L | 0.486 | 0.519 | 0.508 | 0.750 | 44.59% |
| H | 0.545 | 0.565 | 0.532 | 0.785 | 38.99% | |
| 样本量 | 100 | 0.286 | 0.299 | 0.309 | 0.637 | 106.58% |
| 200 | 0.429 | 0.461 | 0.454 | 0.755 | 63.70% | |
| 500 | 0.617 | 0.657 | 0.614 | 0.823 | 25.26% | |
| 1000 | 0.731 | 0.750 | 0.703 | 0.854 | 13.94% | |
| 数据条件 | 水平 | 偏差bias | |||
|---|---|---|---|---|---|
| CDF | EKC | PA | LSTM | ||
| 因子数量 | 1 | 0.363 | −0.063 | −0.038 | 0.031 |
| 2 | −0.053 | −0.290 | −0.326 | 0.010 | |
| 4 | −0.892 | −0.936 | −1.131 | 0.524 | |
| 6 | −1.826 | −1.689 | −2.061 | 0.669 | |
| 8 | −2.851 | −2.489 | −3.055 | 0.164 | |
| 10 | −3.919 | −3.309 | −4.095 | −0.406 | |
| 因子间相关 | 0.00 | −0.616 | −0.824 | −0.476 | 0.088 |
| 0.25 | −0.893 | −1.049 | −0.858 | 0.117 | |
| 0.50 | −1.596 | −1.555 | −2.005 | 0.242 | |
| 0.75 | −3.014 | −2.422 | −3.798 | 0.215 | |
| 每因子题目数量 | 4 | −1.853 | −2.133 | −2.371 | −0.269 |
| 7 | −1.476 | −1.334 | −1.671 | 0.208 | |
| 10 | −1.261 | −0.921 | −1.311 | 0.558 | |
| 主要载荷 | L | −2.466 | −2.462 | −2.279 | 0.464 |
| M | −1.447 | −1.365 | −1.727 | 0.151 | |
| H | −0.676 | −0.561 | −1.347 | −0.118 | |
| 交叉载荷 | L | −1.838 | −1.889 | −1.963 | 0.176 |
| H | −1.222 | −1.037 | −1.605 | 0.155 | |
| 样本量 | 100 | −2.609 | −2.722 | −2.695 | 0.270 |
| 200 | −1.856 | −1.899 | −2.022 | 0.129 | |
| 500 | −1.036 | −0.908 | −1.383 | 0.150 | |
| 1000 | −0.618 | −0.321 | −1.037 | 0.113 | |
表3 各数据条件下不同方法的因子数量保留偏差均值
| 数据条件 | 水平 | 偏差bias | |||
|---|---|---|---|---|---|
| CDF | EKC | PA | LSTM | ||
| 因子数量 | 1 | 0.363 | −0.063 | −0.038 | 0.031 |
| 2 | −0.053 | −0.290 | −0.326 | 0.010 | |
| 4 | −0.892 | −0.936 | −1.131 | 0.524 | |
| 6 | −1.826 | −1.689 | −2.061 | 0.669 | |
| 8 | −2.851 | −2.489 | −3.055 | 0.164 | |
| 10 | −3.919 | −3.309 | −4.095 | −0.406 | |
| 因子间相关 | 0.00 | −0.616 | −0.824 | −0.476 | 0.088 |
| 0.25 | −0.893 | −1.049 | −0.858 | 0.117 | |
| 0.50 | −1.596 | −1.555 | −2.005 | 0.242 | |
| 0.75 | −3.014 | −2.422 | −3.798 | 0.215 | |
| 每因子题目数量 | 4 | −1.853 | −2.133 | −2.371 | −0.269 |
| 7 | −1.476 | −1.334 | −1.671 | 0.208 | |
| 10 | −1.261 | −0.921 | −1.311 | 0.558 | |
| 主要载荷 | L | −2.466 | −2.462 | −2.279 | 0.464 |
| M | −1.447 | −1.365 | −1.727 | 0.151 | |
| H | −0.676 | −0.561 | −1.347 | −0.118 | |
| 交叉载荷 | L | −1.838 | −1.889 | −1.963 | 0.176 |
| H | −1.222 | −1.037 | −1.605 | 0.155 | |
| 样本量 | 100 | −2.609 | −2.722 | −2.695 | 0.270 |
| 200 | −1.856 | −1.899 | −2.022 | 0.129 | |
| 500 | −1.036 | −0.908 | −1.383 | 0.150 | |
| 1000 | −0.618 | −0.321 | −1.037 | 0.113 | |
| 样本量 | 年龄 | 独立−消极F1 | 依赖−积极F2 | 低成就−消极F3 | 高成就−积极F4 | 总量表 | |
|---|---|---|---|---|---|---|---|
| 男生 | 406 | 15.823±0.736 | 11.421±4.450 | 14.244±4.557 | 10.739±4.550 | 15.778±5.299 | 52.182±15.043 |
| 女生 | 581 | 15.823±0.831 | 10.859±4.206 | 13.274±4.473 | 9.644±4.338 | 15.279±5.552 | 49.055±14.764 |
| 总体 | 987 | 15.823±0.793 | 11.090±4.315 | 13.673±4.530 | 10.094±4.457 | 15.484±5.452 | 50.341±14.951 |
| α系数 | 0.857 | 0.817 | 0.885 | 0.889 | 0.923 | ||
表4 父母心理控制量表的描述性统计结果(M±SD)与α系数
| 样本量 | 年龄 | 独立−消极F1 | 依赖−积极F2 | 低成就−消极F3 | 高成就−积极F4 | 总量表 | |
|---|---|---|---|---|---|---|---|
| 男生 | 406 | 15.823±0.736 | 11.421±4.450 | 14.244±4.557 | 10.739±4.550 | 15.778±5.299 | 52.182±15.043 |
| 女生 | 581 | 15.823±0.831 | 10.859±4.206 | 13.274±4.473 | 9.644±4.338 | 15.279±5.552 | 49.055±14.764 |
| 总体 | 987 | 15.823±0.793 | 11.090±4.315 | 13.673±4.530 | 10.094±4.457 | 15.484±5.452 | 50.341±14.951 |
| α系数 | 0.857 | 0.817 | 0.885 | 0.889 | 0.923 | ||
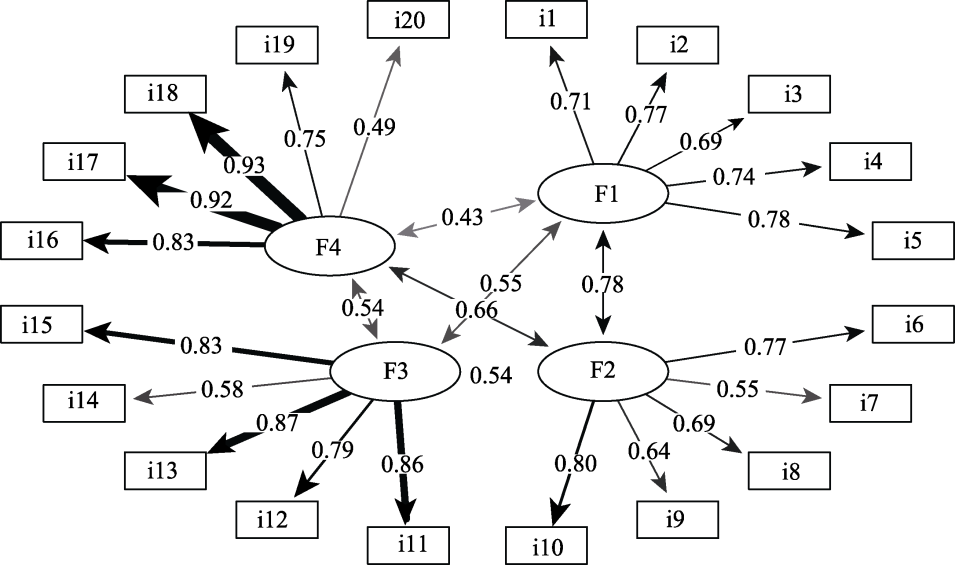
图3 父母心理控制量表的CFA结构
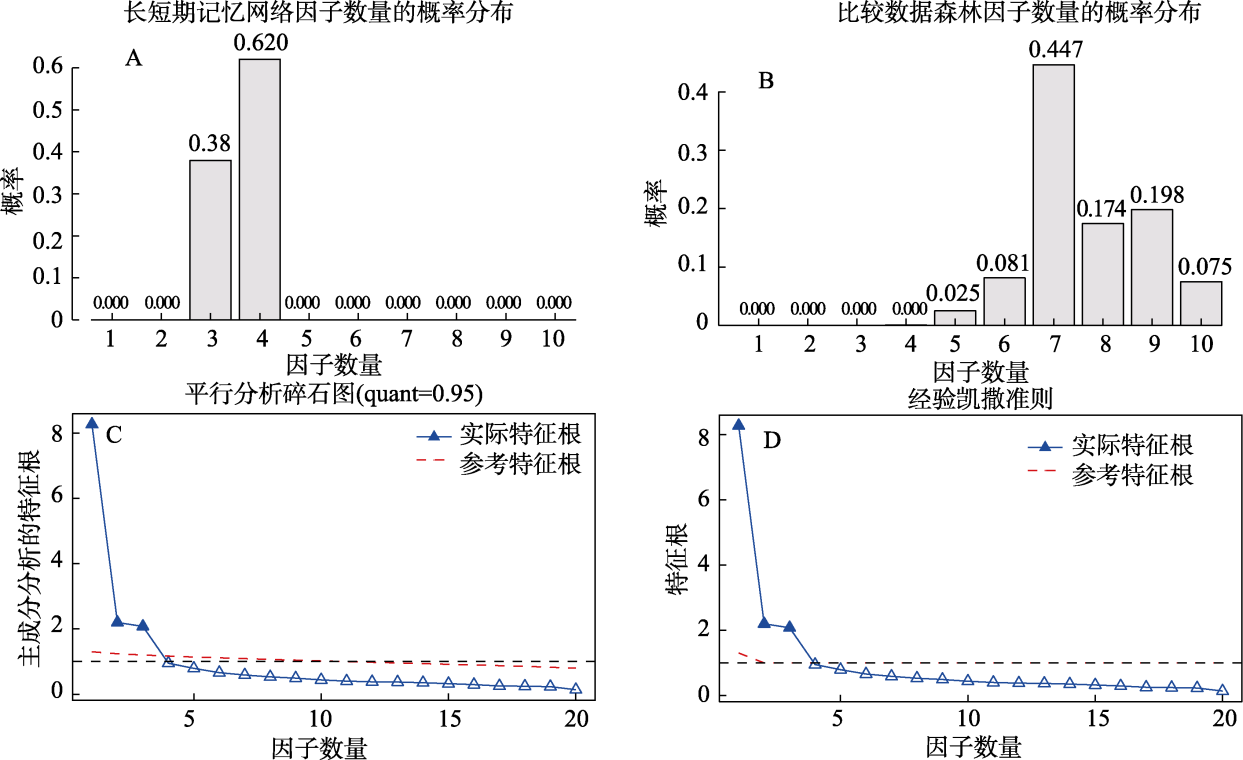
图4 LSTM、CDF、PA和EKC四种因子保留方法的可视化结果
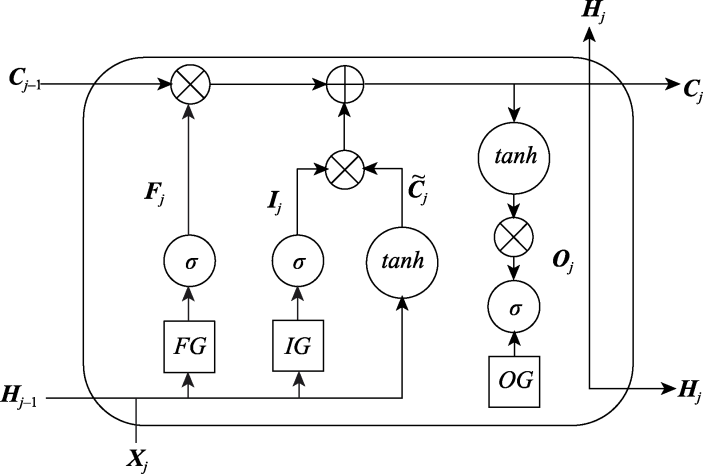
图A1 LSTM记忆元示意图
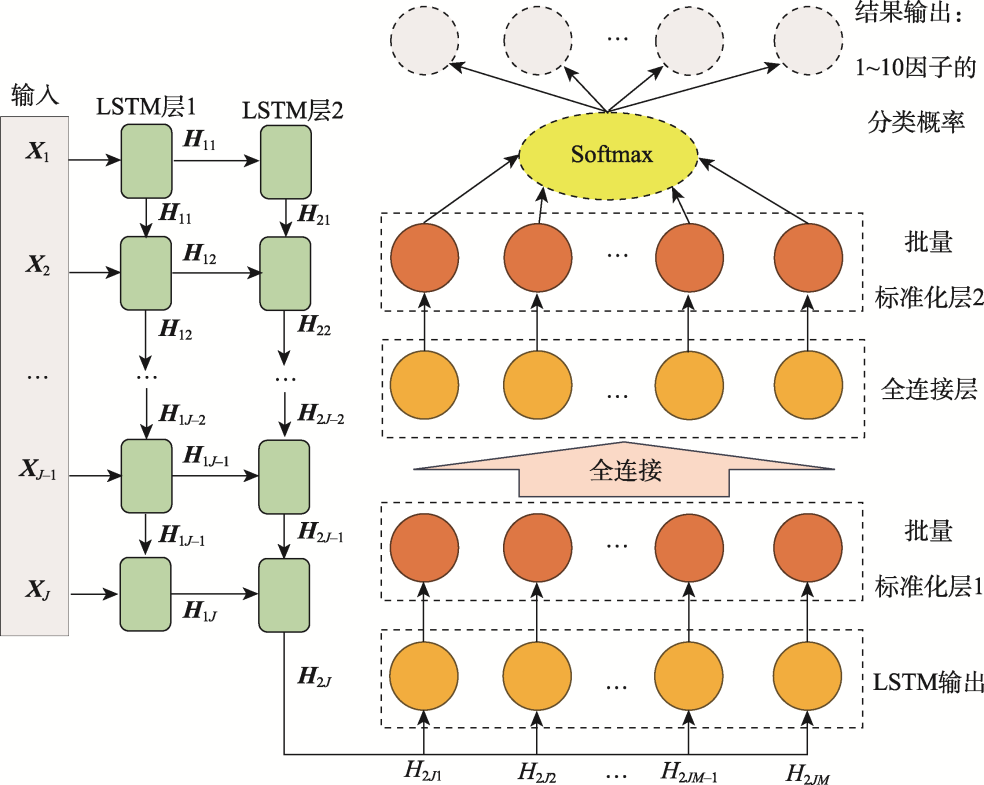
图A2 LSTM+全连接层+批量标准化层的神经网络基本结构示例
| 预测类别 | 总计 | ||||
|---|---|---|---|---|---|
| 类别 | C1 | C2 | C3 | ||
| 真实 类别 | C1 | a | g | h | j |
| C2 | d | b | i | k | |
| C3 | e | f | c | l | |
| 总计 | m | n | o | p | |
表A1 三分类任务的混淆矩阵示例
| 预测类别 | 总计 | ||||
|---|---|---|---|---|---|
| 类别 | C1 | C2 | C3 | ||
| 真实 类别 | C1 | a | g | h | j |
| C2 | d | b | i | k | |
| C3 | e | f | c | l | |
| 总计 | m | n | o | p | |
| [1] |
Auerswald M., & Moshagen M. (2019). How to determine the number of factors to retain in exploratory factor analysis: A comparison of extraction methods under realistic conditions. Psychological Methods, 24(4), 468-491.
doi: 10.1037/met0000200 pmid: 30667242 |
| [2] | Bergstra J., & Bengio Y. (2012). Random search for hyper- arameter optimization. Journal of Machine Learning Research, 13, 281-305. |
| [3] |
Braeken J., & van Assen M. A. (2017). An empirical Kaiser criterion. Psychological Methods, 22(3), 450-466.
doi: 10.1037/met0000074 pmid: 27031883 |
| [4] | Brownlee J. (2018). Deep Learning for Time Series Forecasting: Predict the Future with MLPs, CNNs and LSTMs in Python. Machine Learning Mastery. |
| [5] | Chen S., Abhinav S., Saurabh S., & Abhinav G. (2017). Revisiting unreasonable effectiveness of data in deep learning era. arXiv preprint:1707.02968. |
| [6] | DeepSeek-AI , Liu A., Feng B., Xue B., Wang B., Wu B.,... Pan Z.,(2024). DeepSeek-V3 technical report. arXiv preprint: 2412.19437. |
| [7] | Deng Y., Gao X., Xu C., Sun Z., Yue Y., & Liu X. (2019). Reliability and validity test of Dependency-Oriented and Achievement-Oriented Psychological Control Scale in Chinese adolescents. Chinese Journal of Clinical Psychology, 27(2), 253-257. |
| [邓衍鹤, 高芯芸, 徐陈晰, 孙治英, 岳艳春, 刘翔平. (2019). 依赖导向与成就导向心理控制量表修订版在我国青少年中的信效度检验. 中国临床心理学杂志, 27(2), 253-257.] | |
| [8] | de Winter J. C., & Dodou D. (2012). Factor recovery by principal axis factoring and maximum likelihood factor analysis as a function of factor pattern and sample size. Journal of Applied Statistics, 39(4), 695-710. |
| [9] |
Dinno A. (2009). Exploring the sensitivity of Horn’s parallel analysis to the distributional form of random data. Multivariate Behavioral Research, 44(3), 362-388.
doi: 10.1080/00273170902938969 URL |
| [10] |
Fava J. L., & Velicer W. F. (1996). The effects of underextraction in factor and component analyses. Educational and Psychological Measurement, 56(6), 907-929.
doi: 10.1177/0013164496056006001 URL |
| [11] | Goodfellow I., Bengio Y., & Courville A. (2016). Deep learning. MIT Press. |
| [12] | Goretzko D. (2025). How many factors to retain in exploratory factor analysis? A critical overview of factor retention methods. Psychological Methods, https://doi.org/0.1037/met0000733. |
| [13] |
Goretzko D., & Bühner M. (2020). One model to rule them all? Using machine learning algorithms to determine the number of factors in exploratory factor analysis. Psychological Methods, 25(6), 776-786.
doi: 10.1037/met0000262 URL |
| [14] |
Goretzko D., & Bühner M. (2022). Factor retention using machine learning with ordinal data. Applied Psychological Measurement, 46(5), 406-421.
doi: 10.1177/01466216221089345 pmid: 35812814 |
| [15] |
Goretzko D., & Ruscio J. (2024). The comparison data forest: A new comparison data approach to determine the number of factors in exploratory factor analysis. Behavior Research Methods, 56(3), 1838-1851.
doi: 10.3758/s13428-023-02122-4 |
| [16] | Heaton J. (2008). Introduction to neural networks with Java (2nd ed., pp. 143-172). Heaton Research, Inc. |
| [17] |
Hochreiter S., & Schmidhuber J. (1997). Long short-term memory. Neural Computation, 9(8), 1735-1780.
doi: 10.1162/neco.1997.9.8.1735 pmid: 9377276 |
| [18] |
Horn J. L. (1965). A rationale and test for the number of factors in factor analysis. Psychometrika, 30(2), 179-185.
doi: 10.1007/BF02289447 URL |
| [19] |
Humphreys L. G., & Montanelli R. G. (1975). An investigation of the parallel analysis criterion for determining the number of common factors. Multivariate Behavioral Research, 10(2), 193-205.
doi: 10.1207/s15327906mbr1002_5 URL |
| [20] | Ioffe S., & Szegedy C. (2015). Batch normalization: Accelerating deep network training by reducing internal covariate shift. arXiv preprint:1502.03167. |
| [21] |
Kaiser H. F. (1960). The application of electronic computers to factor analysis. Educational and Psychological Measurement, 20, 141-151.
doi: 10.1177/001316446002000116 URL |
| [22] | Kalinowski T., Ushey K., Allaire J. J., RStudio, Tang Y., Eddelbuettel D.,... Geelnard M. (2025). reticulate: Interface to Python. R package version 1. 42.0. https://ran.r-project.org/web/packages/reticulate/index.html |
| [23] | Kingma D. P., & Ba J. (2014). Adam: A method for stochastic optimization. arXiv preprint: 1412.6980. |
| [24] | Lange S., Helfrich K., & Ye Q. (2022). Batch normalization preconditioning for neural network training. Journal of Machine Learning Research, 23(1), 3118-3158. |
| [25] | LeCun Y., Bengio Y., & Hinton G. (2015). Deep learning. Nature, 521, 436-444. |
| [26] |
Li Y., Wen Z., Hau K.-T., Yuan K.-H., & Peng Y. (2020). Effects of cross-loadings on determining the number of factors to retain. Structural Equation Modeling: A Multidisciplinary Journal, 27(6), 841-863.
doi: 10.1080/10705511.2020.1745075 URL |
| [27] |
Lorenzo-Seva U., Timmerman M. E., & Kiers H. A. (2011). The Hull method for selecting the number of common factors. Multivariate Behavioral Research, 46(2), 340-364.
doi: 10.1080/00273171.2011.564527 pmid: 26741331 |
| [28] |
Marčenko V. A., & Pastur L. A. (1967). Distribution of eigenvalues for some sets of random matrices. Mathematics of the USSR-Sbornik, 1, 457-483.
doi: 10.1070/SM1967v001n04ABEH001994 URL |
| [29] | Nair V., & Hinton G. E. (2010). Rectified linear units improve restricted Boltzmann machines. In Proceedings of the 27th International Conference on Machine Learning (ICML-10) (pp. 807-814). Omnipress. |
| [30] | Peres-Neto P. R., Jackson D. A., & Somers K. M. (2005). How many principal components? Stopping rules for determining the number of non-trivial axes revisited. Computational Statistics & Data Analysis, 49(4), 974-997. |
| [31] |
Qin H., & Guo L. (2024). Using machine learning to improve Q-matrix validation. Behavior Research Methods, 56(3), 1916-1935.
doi: 10.3758/s13428-023-02126-0 |
| [32] | Qin H., & Guo L. (2025a). EFAfactors: Determining the number of factors in exploratory factor analysis. R package version 1.2.1. |
| [33] | Qin H., & Guo L. (2025b). LSTMfactors: Determining the number of factors in exploratory factor analysis by LSTM. R package version 1.0.0. |
| [34] | Paszke A., Gross S., Massa F., Lerer A., Bradbury J., Chanan G.,... Chintala S. (2019). PyTorch: An imperative style, high-performance deep learning library. In Proceedings of the 33rd International Conference on Neural Information Processing Systems (pp. Article 721). Curran Associates Inc. |
| [35] | Pedregosa F., Varoquaux G., Gramfort A., Michel V., Thirion B., Grisel O.,... Duchesnay É. (2011). Scikit-learn: Machine learning in Python. Journal of Machine Learning Research, 12, 2825-2830. |
| [36] | R Core Team. (2025). R: A language and environment for statistical computing. R Foun dation for Statistical Computing, Vienna, Austria. https://www.R-project.org |
| [37] |
Ruscio J., & Kaczetow W. (2008). Simulating multivariate nonnormal data using an iterative algorithm. Multivariate Behavioral Research, 43(3), 355-381.
doi: 10.1080/00273170802285693 pmid: 26741201 |
| [38] |
Ruscio J., & Roche B. (2012). Determining the number of factors to retain in an exploratory factor analysis using comparison data of known factorial structure. Psychological Assessment, 24(2), 282-292.
doi: 10.1037/a0025697 pmid: 21966933 |
| [39] |
Soenens B., & Vansteenkiste M. (2010). A theoretical upgrade of the concept of parental psychological control: Proposing new insights on the basis of self-determination theory. Developmental Review, 30(1), 74-99.
doi: 10.1016/j.dr.2009.11.001 URL |
| [40] |
Velicer W. F. (1976). Determining the number of components from the matrix of partial correlations. Psychometrika, 41(3), 321-327.
doi: 10.1007/BF02293557 URL |
| [41] |
Wood J. M., Tataryn D. J., & Gorsuch R. L. (1996). Effects of under- and overextraction on principal axis factor analysis with varimax rotation. Psychological Methods, 1(4), 354-365.
doi: 10.1037/1082-989X.1.4.354 URL |
| [42] |
Zwick W. R., & Velicer W. F. (1986). Comparison of five rules for determining the number of components to retain. Psychological Bulletin, 99(3), 432-442.
doi: 10.1037/0033-2909.99.3.432 URL |
| [1] | 詹沛达, 王志谋, 褚高红, 郝宁. 基于成员间高阶认知交互的团队认知诊断建模[J]. 心理学报, 2026, 58(1): 166-179. |
| [2] | 黄峰, 丁慧敏, 李思嘉, 韩诺, 狄雅政, 刘晓倩, 赵楠, 李林妍, 朱廷劭. 基于大语言模型的自助式AI心理咨询系统构建及其效果评估[J]. 心理学报, 2025, 57(11): 2022-2042. |
| [3] | 何翠婷, 彭思韦, 朱怡安, 汪大勋, 蔡艳, 涂冬波. 迫选测验中虚假作答行为建模及其在人格测评中的应用:基于RES理论框架[J]. 心理学报, 2025, 57(10): 1832-1848. |
| [4] | 唐小娟, 毛萌萌, 李瑜, 丁树良, 彭志霞. 认知诊断测验最简完备Q矩阵统一设计方法[J]. 心理学报, 2025, 57(10): 1849-1866. |
| [5] | 李毕琴, 张美霞, 杨少云, 黄鹏飞, 王爱君, 党君华. 秒内不同时距下自我加工优势效应[J]. 心理学报, 2025, 57(9): 1529-1539. |
| [6] | 陆翔宇, 陈平. 交互式问题解决测验中学习效应的分析:过程数据测量模型的拓展与应用[J]. 心理学报, 2025, 57(9): 1677-1688. |
| [7] | 汪玲玲, 孙小坚. 认知诊断模型属性层级关系和Q矩阵的联合验证方法:面向实践的视角[J]. 心理学报, 2025, 57(7): 1295-1308. |
| [8] | 章彦博, 黄峰, 莫柳铃, 刘晓倩, 朱廷劭. 基于大语言模型的自杀意念文本数据增强与识别技术[J]. 心理学报, 2025, 57(6): 987-1000. |
| [9] | 温忠麟, 马鹏, 孟进, 王一帆. 因果·影响·相关与预测辨析[J]. 心理学报, 2025, 57(6): 1108-1118. |
| [10] | 方杰, 温忠麟, 王惠惠, 顾红磊. 密集追踪数据的有调节的中介效应分析[J]. 心理学报, 2025, 57(5): 915-928. |
| [11] | 郭小军, 焦玉月, 柏小云, 罗照盛, 李弘. 心理实验数据的联合建模:反应与反应时的混合影响[J]. 心理学报, 2024, 56(11): 1619-1633. |
| [12] | 唐小娟, 彭志霞, 秦珊珊, 丁树良, 毛萌萌, 李瑜. 基于可达阵的多级评分最简完备Q矩阵设计[J]. 心理学报, 2024, 56(11): 1634-1650. |
| [13] | 温忠麟, 王一帆, 马鹏, 孟进. 变量之间的影响关系和多重影响因素的共同作用类型[J]. 心理学报, 2024, 56(10): 1462-1470. |
| [14] | 徐静, 骆方, 马彦珍, 胡路明, 田雪涛. 开放式情境判断测验的自动化评分[J]. 心理学报, 2024, 56(6): 831-844. |
| [15] | 谭青蓉, 蔡艳, 汪大勋, 罗芬, 涂冬波. CD-CAT中基于SCAD惩罚和EM视角的在线标定方法开发——G-DINA模型[J]. 心理学报, 2024, 56(5): 670-688. |
| 阅读次数 | ||||||
|
全文 |
|
|||||
|
摘要 |
|
|||||