ISSN 0439-755X
CN 11-1911/B
主办:中国心理学会
中国科学院心理研究所
出版:科学出版社
CN 11-1911/B
主办:中国心理学会
中国科学院心理研究所
出版:科学出版社
心理学报 ›› 2025, Vol. 57 ›› Issue (10): 1832-1848.doi: 10.3724/SP.J.1041.2025.1832 cstr: 32110.14.2025.1832
何翠婷1, 彭思韦2, 朱怡安1, 汪大勋1( ), 蔡艳1(), 涂冬波1()
收稿日期:2024-05-30
发布日期:2025-08-15
出版日期:2025-10-25
通讯作者:
汪大勋, wangda.xun@163.com;作者简介:第一联系人:彭思韦和朱怡安为文章共同第一作者
基金资助:
HE Cuiting1, PENG Siwei2, ZHU Yian1, WANG Daxun1(), CAI Yan1(), TU Dongbo1()
Received:2024-05-30
Online:2025-08-15
Published:2025-10-25
摘要:
与Likert自评量表相比, 虽然迫选测验因对项目进行社会称许性匹配而具一定的抗作假功效, 但大量研究表明项目的称许性会由于与不同的项目匹配成block发生改变, 并在不同的测评情境下也会发生改变, 因此迫选测验仍不可避免地存在虚假作答行为, 进而严重降低并危害测量结果的准确性与公平性。鉴于此, 本研究基于瑟斯顿IRT模型(TIRT)以及Böckenholt (2014)的RES作假理论模型, 针对迫选测验中虚假作答行为进行统计建模(简记为RES-TIRT), 以期解决上述问题。本文通过两项模拟研究探讨了新模型的性能并与传统的模型进行比较, 随后通过实证研究深入探讨了新模型在大五人格测评中的具体应用及其优势。模拟研究结果表明:(1)在不同模拟条件下RES-TIRT模型估计情况良好; (2)不论是项目参数还是被试参数, 新模型RES-TIRT的参数估计精度均明显优于传统的TIRT模型。实证研究将新模型应用于真实的大五人格测评, 通过对比分析诚实作答组和虚假作答组的结果, 结果表明:与传统的TIRT模型相比, 新模型RES-TIRT能有效地降低乃至消除虚假作答对测量结果的负面影响, 并进一步提升了迫选测验的抗作假功效, 有力地证明了RES-TIRT模型的优势及其应用前景。
中图分类号:
何翠婷, 彭思韦, 朱怡安, 汪大勋, 蔡艳, 涂冬波. (2025). 迫选测验中虚假作答行为建模及其在人格测评中的应用:基于RES理论框架. 心理学报, 57(10), 1832-1848.
HE Cuiting, PENG Siwei, ZHU Yian, WANG Daxun, CAI Yan, TU Dongbo. (2025). Faking modeling for forced choice measures in personality assessment based on RES theoretical framework. Acta Psychologica Sinica, 57(10), 1832-1848.
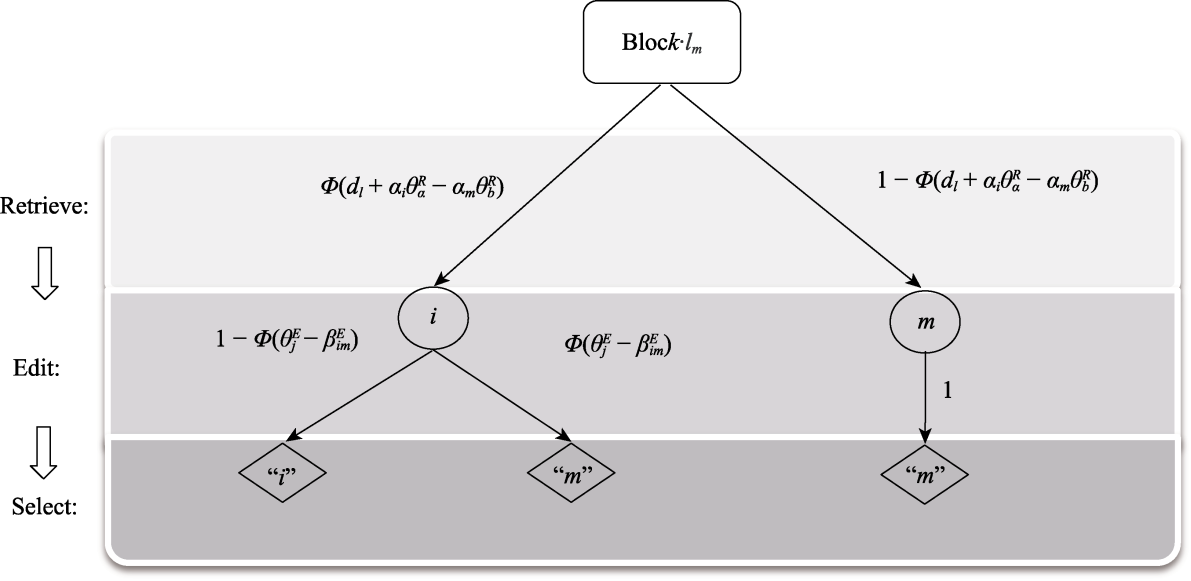
图1 新模型(RES-TIRT)建模框架 注:加粗的项目表示具有更高的称许性
| 实验因素 | 水平 |
|---|---|
| 样本容量(N) | 500, 1000 |
| 迫选测验的格式(BS) | 每个block包括2个项目, 3个项目 |
| 项目描述的正负性(Key) | 所有都为正向描述(+), 正向与负向描述混合(+/−) |
| 特质间相关性(COR) | 0, 0.5 |
| 维度数量(Dim) | 3, 5 |
表1 模拟研究1的实验设计
| 实验因素 | 水平 |
|---|---|
| 样本容量(N) | 500, 1000 |
| 迫选测验的格式(BS) | 每个block包括2个项目, 3个项目 |
| 项目描述的正负性(Key) | 所有都为正向描述(+), 正向与负向描述混合(+/−) |
| 特质间相关性(COR) | 0, 0.5 |
| 维度数量(Dim) | 3, 5 |
| BS | Dim | Key | COR | N = 500 | N = 1000 | ||
|---|---|---|---|---|---|---|---|
| 运算时间 (minute) | PSRF<1.1 (%) | 运算时间 (minute) | PSRF<1.1 (%) | ||||
| 2 | 3维 | + | 0 | 9.320 | 0.999 | 23.188 | 0.998 |
| 0.5 | 9.304 | 0.998 | 22.985 | 0.998 | |||
| +/− | 0 | 9.330 | 0.999 | 23.325 | 0.999 | ||
| 0.5 | 9.233 | 0.999 | 22.851 | 0.999 | |||
| 5维 | + | 0 | 9.294 | 0.998 | 23.385 | 0.999 | |
| 0.5 | 9.337 | 0.998 | 20.787 | 0.999 | |||
| +/− | 0 | 9.310 | 0.999 | 20.784 | 0.999 | ||
| 0.5 | 8.549 | 0.998 | 20.485 | 0.999 | |||
| 3 | 3维 | + | 0 | 17.684 | 0.998 | 48.273 | 0.999 |
| 0.5 | 17.808 | 0.997 | 48.027 | 0.998 | |||
| +/− | 0 | 17.714 | 0.999 | 51.149 | 1.000 | ||
| 0.5 | 17.846 | 0.999 | 47.736 | 0.998 | |||
| 5维 | + | 0 | 18.009 | 0.998 | 48.284 | 0.999 | |
| 0.5 | 17.741 | 0.998 | 48.663 | 0.999 | |||
| +/− | 0 | 19.280 | 0.998 | 49.208 | 1.000 | ||
| 0.5 | 22.088 | 0.998 | 48.614 | 0.999 | |||
表2 RES-TIRT模型的运算效率和收敛性
| BS | Dim | Key | COR | N = 500 | N = 1000 | ||
|---|---|---|---|---|---|---|---|
| 运算时间 (minute) | PSRF<1.1 (%) | 运算时间 (minute) | PSRF<1.1 (%) | ||||
| 2 | 3维 | + | 0 | 9.320 | 0.999 | 23.188 | 0.998 |
| 0.5 | 9.304 | 0.998 | 22.985 | 0.998 | |||
| +/− | 0 | 9.330 | 0.999 | 23.325 | 0.999 | ||
| 0.5 | 9.233 | 0.999 | 22.851 | 0.999 | |||
| 5维 | + | 0 | 9.294 | 0.998 | 23.385 | 0.999 | |
| 0.5 | 9.337 | 0.998 | 20.787 | 0.999 | |||
| +/− | 0 | 9.310 | 0.999 | 20.784 | 0.999 | ||
| 0.5 | 8.549 | 0.998 | 20.485 | 0.999 | |||
| 3 | 3维 | + | 0 | 17.684 | 0.998 | 48.273 | 0.999 |
| 0.5 | 17.808 | 0.997 | 48.027 | 0.998 | |||
| +/− | 0 | 17.714 | 0.999 | 51.149 | 1.000 | ||
| 0.5 | 17.846 | 0.999 | 47.736 | 0.998 | |||
| 5维 | + | 0 | 18.009 | 0.998 | 48.284 | 0.999 | |
| 0.5 | 17.741 | 0.998 | 48.663 | 0.999 | |||
| +/− | 0 | 19.280 | 0.998 | 49.208 | 1.000 | ||
| 0.5 | 22.088 | 0.998 | 48.614 | 0.999 | |||
| BS | Dim | Key | COR | θjRmean | d | a | θjE | βEim |
|---|---|---|---|---|---|---|---|---|
| 2 | 3维 | + | 0 | −0.003 | −0.005 | 0.009 | −0.002 | 0.000 |
| 0.5 | 0.001 | 0.106 | −0.164 | 0.003 | −0.153 | |||
| +/− | 0 | −0.008 | 0.001 | −0.011 | 0.004 | −0.001 | ||
| 0.5 | −0.001 | 0.023 | −0.039 | −0.001 | −0.044 | |||
| 5维 | + | 0 | 0.000 | −0.004 | 0.004 | 0.004 | 0.008 | |
| 0.5 | 0.005 | 0.116 | −0.214 | 0.011 | −0.173 | |||
| +/− | 0 | 0.000 | −0.007 | −0.009 | 0.001 | 0.011 | ||
| 0.5 | 0.003 | 0.021 | −0.038 | 0.006 | −0.036 | |||
| 3 | 3维 | + | 0 | −0.001 | 0.067 | 0.054 | 0.015 | −0.099 |
| 0.5 | 0.004 | 0.139 | −0.131 | 0.031 | −0.205 | |||
| +/− | 0 | 0.005 | 0.057 | 0.065 | 0.009 | −0.076 | ||
| 0.5 | 0.002 | 0.071 | 0.024 | 0.014 | −0.089 | |||
| 5维 | + | 0 | −0.002 | 0.028 | 0.053 | −0.009 | −0.028 | |
| 0.5 | 0.007 | 0.138 | −0.161 | 0.019 | −0.169 | |||
| +/− | 0 | −0.001 | 0.027 | 0.075 | 0.004 | −0.032 | ||
| 0.5 | 0.007 | 0.029 | 0.020 | 0.003 | −0.054 |
表3 RES-TIRT模型不同的模拟条件下参数的估计偏差(Bias)
| BS | Dim | Key | COR | θjRmean | d | a | θjE | βEim |
|---|---|---|---|---|---|---|---|---|
| 2 | 3维 | + | 0 | −0.003 | −0.005 | 0.009 | −0.002 | 0.000 |
| 0.5 | 0.001 | 0.106 | −0.164 | 0.003 | −0.153 | |||
| +/− | 0 | −0.008 | 0.001 | −0.011 | 0.004 | −0.001 | ||
| 0.5 | −0.001 | 0.023 | −0.039 | −0.001 | −0.044 | |||
| 5维 | + | 0 | 0.000 | −0.004 | 0.004 | 0.004 | 0.008 | |
| 0.5 | 0.005 | 0.116 | −0.214 | 0.011 | −0.173 | |||
| +/− | 0 | 0.000 | −0.007 | −0.009 | 0.001 | 0.011 | ||
| 0.5 | 0.003 | 0.021 | −0.038 | 0.006 | −0.036 | |||
| 3 | 3维 | + | 0 | −0.001 | 0.067 | 0.054 | 0.015 | −0.099 |
| 0.5 | 0.004 | 0.139 | −0.131 | 0.031 | −0.205 | |||
| +/− | 0 | 0.005 | 0.057 | 0.065 | 0.009 | −0.076 | ||
| 0.5 | 0.002 | 0.071 | 0.024 | 0.014 | −0.089 | |||
| 5维 | + | 0 | −0.002 | 0.028 | 0.053 | −0.009 | −0.028 | |
| 0.5 | 0.007 | 0.138 | −0.161 | 0.019 | −0.169 | |||
| +/− | 0 | −0.001 | 0.027 | 0.075 | 0.004 | −0.032 | ||
| 0.5 | 0.007 | 0.029 | 0.020 | 0.003 | −0.054 |
| BS | Dim | Key | COR | θjRmean | d | a | θjE | βEim |
|---|---|---|---|---|---|---|---|---|
| 2 | 3维 | + | 0 | 0.655 | 0.215 | 0.265 | 0.710 | 0.335 |
| 0.5 | 0.775 | 0.261 | 0.341 | 0.718 | 0.440 | |||
| +/− | 0 | 0.517 | 0.215 | 0.272 | 0.691 | 0.294 | ||
| 0.5 | 0.534 | 0.225 | 0.315 | 0.697 | 0.324 | |||
| 5维 | + | 0 | 0.665 | 0.210 | 0.253 | 0.694 | 0.309 | |
| 0.5 | 0.838 | 0.271 | 0.373 | 0.714 | 0.435 | |||
| +/− | 0 | 0.595 | 0.219 | 0.259 | 0.694 | 0.314 | ||
| 0.5 | 0.626 | 0.270 | 0.335 | 0.700 | 0.359 | |||
| 3 | 3维 | + | 0 | 0.640 | 0.265 | 0.306 | 0.725 | 0.435 |
| 0.5 | 0.745 | 0.295 | 0.352 | 0.733 | 0.504 | |||
| +/− | 0 | 0.430 | 0.242 | 0.275 | 0.704 | 0.368 | ||
| 0.5 | 0.459 | 0.267 | 0.293 | 0.702 | 0.395 | |||
| 5维 | + | 0 | 0.619 | 0.268 | 0.321 | 0.705 | 0.402 | |
| 0.5 | 0.807 | 0.348 | 0.415 | 0.740 | 0.538 | |||
| +/− | 0 | 0.515 | 0.285 | 0.311 | 0.699 | 0.383 | ||
| 0.5 | 0.541 | 0.301 | 0.340 | 0.704 | 0.425 |
表4 RES-TIRT模型不同实验条件下参数估计精度(RMSE)
| BS | Dim | Key | COR | θjRmean | d | a | θjE | βEim |
|---|---|---|---|---|---|---|---|---|
| 2 | 3维 | + | 0 | 0.655 | 0.215 | 0.265 | 0.710 | 0.335 |
| 0.5 | 0.775 | 0.261 | 0.341 | 0.718 | 0.440 | |||
| +/− | 0 | 0.517 | 0.215 | 0.272 | 0.691 | 0.294 | ||
| 0.5 | 0.534 | 0.225 | 0.315 | 0.697 | 0.324 | |||
| 5维 | + | 0 | 0.665 | 0.210 | 0.253 | 0.694 | 0.309 | |
| 0.5 | 0.838 | 0.271 | 0.373 | 0.714 | 0.435 | |||
| +/− | 0 | 0.595 | 0.219 | 0.259 | 0.694 | 0.314 | ||
| 0.5 | 0.626 | 0.270 | 0.335 | 0.700 | 0.359 | |||
| 3 | 3维 | + | 0 | 0.640 | 0.265 | 0.306 | 0.725 | 0.435 |
| 0.5 | 0.745 | 0.295 | 0.352 | 0.733 | 0.504 | |||
| +/− | 0 | 0.430 | 0.242 | 0.275 | 0.704 | 0.368 | ||
| 0.5 | 0.459 | 0.267 | 0.293 | 0.702 | 0.395 | |||
| 5维 | + | 0 | 0.619 | 0.268 | 0.321 | 0.705 | 0.402 | |
| 0.5 | 0.807 | 0.348 | 0.415 | 0.740 | 0.538 | |||
| +/− | 0 | 0.515 | 0.285 | 0.311 | 0.699 | 0.383 | ||
| 0.5 | 0.541 | 0.301 | 0.340 | 0.704 | 0.425 |
| 特质 | N | E | C | A |
|---|---|---|---|---|
| E | −0.21 | |||
| C | −0.53 | 0.27 | ||
| A | −0.25 | 0 | 0.24 | |
| O | 0 | 0.4 | 0 | 0 |
表5 大五人格维度间的真实相关矩阵
| 特质 | N | E | C | A |
|---|---|---|---|---|
| E | −0.21 | |||
| C | −0.53 | 0.27 | ||
| A | −0.25 | 0 | 0.24 | |
| O | 0 | 0.4 | 0 | 0 |
| βEim | 对应的虚假作答比例 |
|---|---|
| U(0, 2) | 30% |
| U(2, 3) | 10% |
| +∞ | 0% |
表6 虚假作答比例与触发编辑行为的程度βEim的关系
| βEim | 对应的虚假作答比例 |
|---|---|
| U(0, 2) | 30% |
| U(2, 3) | 10% |
| +∞ | 0% |
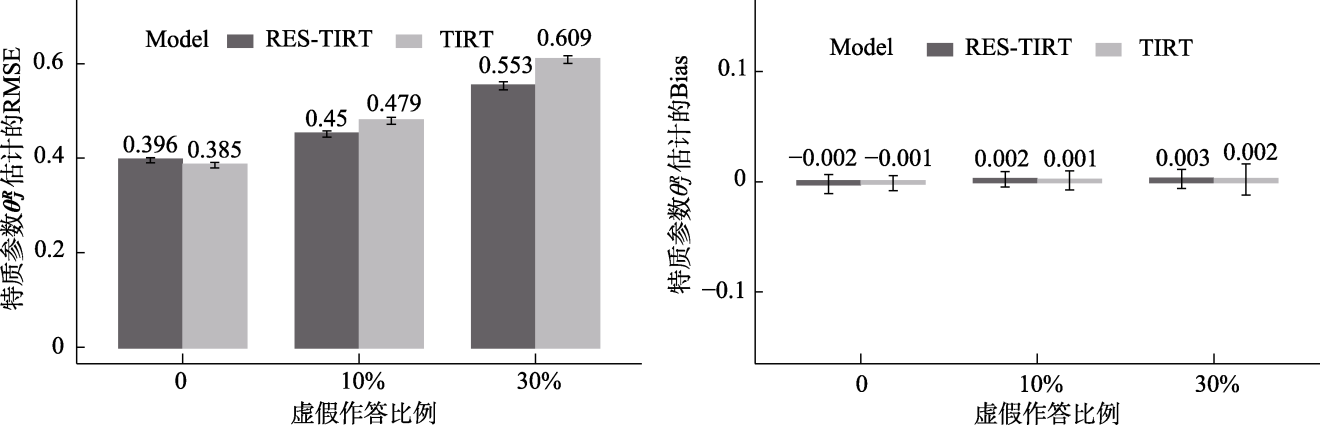
图2 不同虚假作答比例下两模型特质参数 θ j E估计精度比较
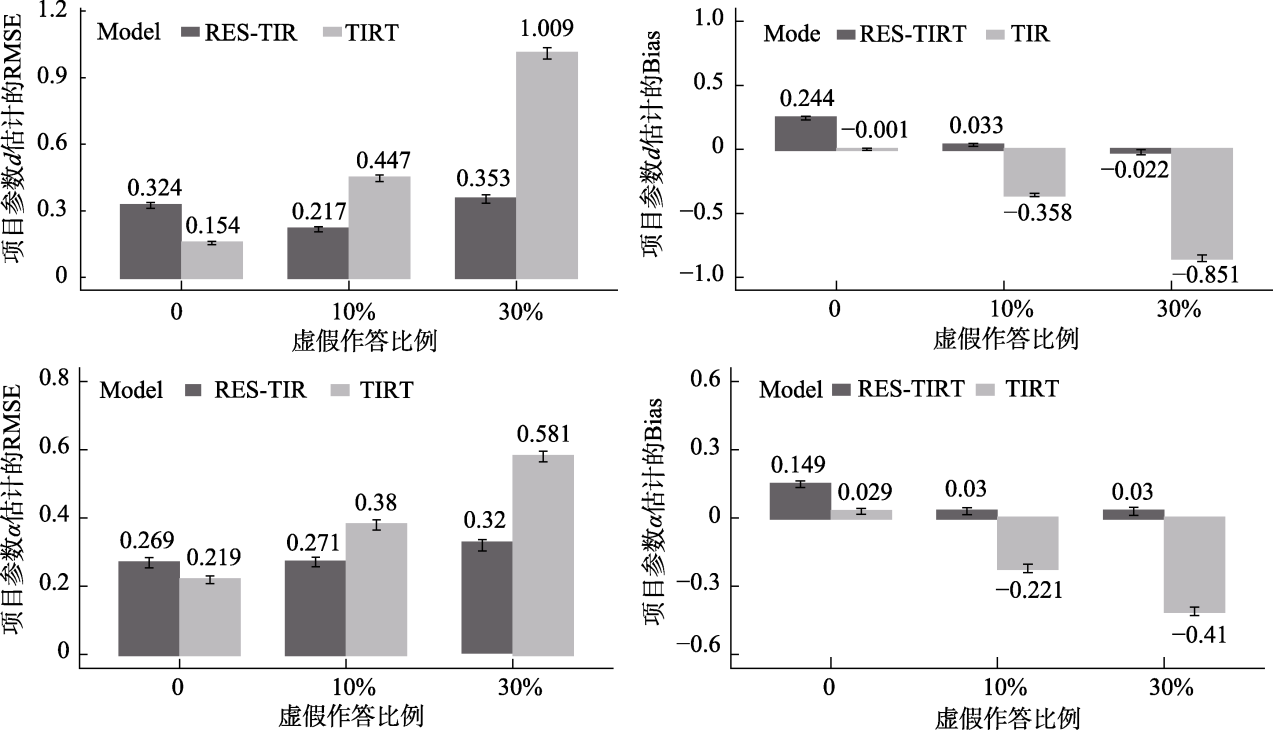
图3 不同虚假作答比例下两模型项目参数a和d估计精度比较
| Model | WAIC | PPP-TEST |
|---|---|---|
| RES-TIRT | 10900 | 0.539 |
| TIRT | 10981 | 0.292 |
表7 模型拟合情况
| Model | WAIC | PPP-TEST |
|---|---|---|
| RES-TIRT | 10900 | 0.539 |
| TIRT | 10981 | 0.292 |
| 模型 | O | E | A | C | N | |
|---|---|---|---|---|---|---|
| RES-TIRT | E | −0.25 | ||||
| A | 0.064 | −0.104 | ||||
| C | −0.15 | −0.145 | 0.066 | |||
| N | 0.193 | 0.122 | 0.262 | 0.01 | ||
| TIRT | E | −0.327 | ||||
| A | 0.326 | −0.153 | ||||
| C | −0.002 | −0.145 | 0.083 | |||
| N | 0.027 | 0.228 | 0.062 | −0.048 | ||
| Between | 0.868 | 0.96 | 0.968 | 0.982 | 0.935 |
表8 两模型特质内特质间估计结果的相关
| 模型 | O | E | A | C | N | |
|---|---|---|---|---|---|---|
| RES-TIRT | E | −0.25 | ||||
| A | 0.064 | −0.104 | ||||
| C | −0.15 | −0.145 | 0.066 | |||
| N | 0.193 | 0.122 | 0.262 | 0.01 | ||
| TIRT | E | −0.327 | ||||
| A | 0.326 | −0.153 | ||||
| C | −0.002 | −0.145 | 0.083 | |||
| N | 0.027 | 0.228 | 0.062 | −0.048 | ||
| Between | 0.868 | 0.96 | 0.968 | 0.982 | 0.935 |
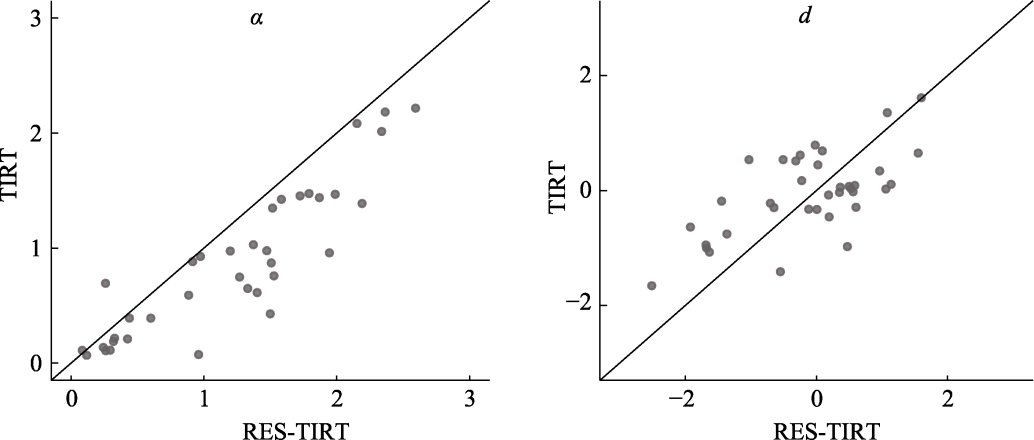
图4 两模型估计的项目参数a和d之间的相关性
| 模型 | O | E | A | C | N | |
|---|---|---|---|---|---|---|
| TIRT | t | −3.415*** | 8.904*** | −9.462*** | −0.034 | 0.574 |
| differences | −0.29 | 0.897 | −0.917 | −0.003 | 0.054 | |
| Cohen's d | 0.354 | 0.923 | 0.981 | 0.004 | 0.059 | |
| RES-TIRT | t | −1.029 | 3.080** | −3.887*** | −0.249 | −1.458 |
| differences | −0.08 | 0.317 | −0.38 | −0.02 | −0.136 | |
| Cohen's d | 0.107 | 0.319 | 0.403 | 0.026 | 0.151 |
表9 两模型各特质在诚实作答和虚假作答的特质差异情况
| 模型 | O | E | A | C | N | |
|---|---|---|---|---|---|---|
| TIRT | t | −3.415*** | 8.904*** | −9.462*** | −0.034 | 0.574 |
| differences | −0.29 | 0.897 | −0.917 | −0.003 | 0.054 | |
| Cohen's d | 0.354 | 0.923 | 0.981 | 0.004 | 0.059 | |
| RES-TIRT | t | −1.029 | 3.080** | −3.887*** | −0.249 | −1.458 |
| differences | −0.08 | 0.317 | −0.38 | −0.02 | −0.136 | |
| Cohen's d | 0.107 | 0.319 | 0.403 | 0.026 | 0.151 |
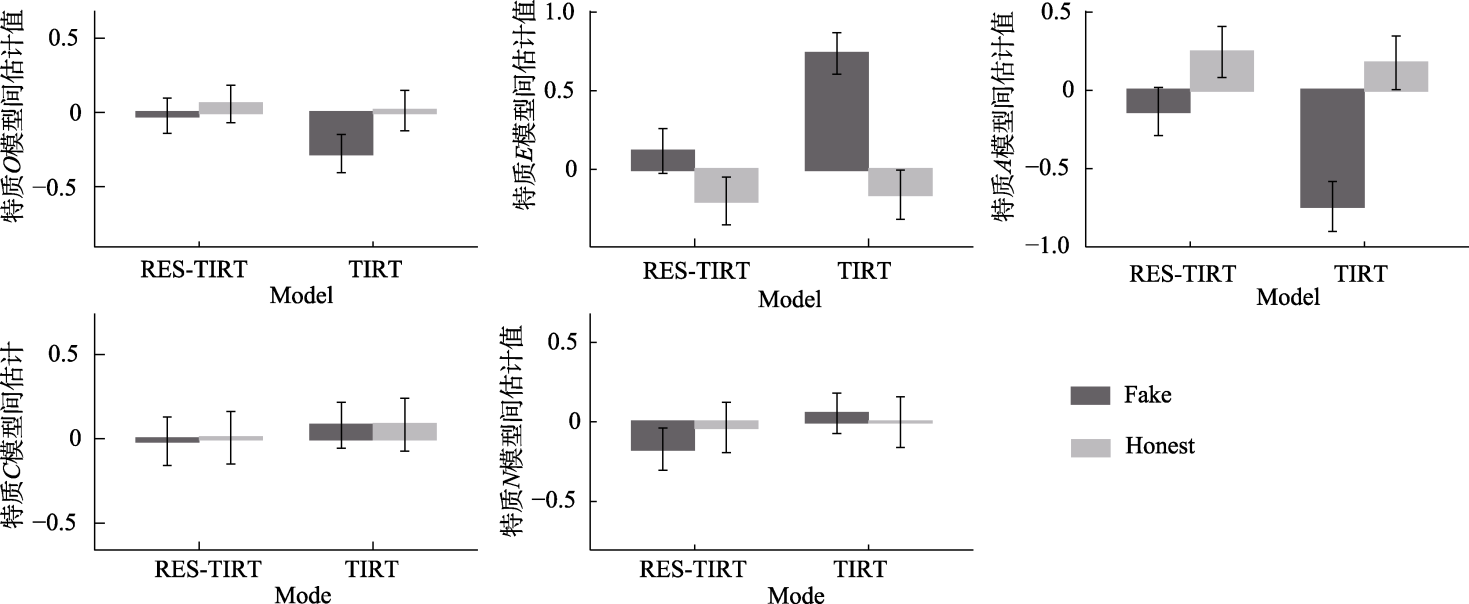
图5 两模型在诚实作答和虚假作答估计的特质差异情况 注: honest指前测的诚实作答, fake指后测的虚假作答。
| Item pair | Estimate | SE | Item pair | Estimate | SE |
|---|---|---|---|---|---|
| 1 | −1.268 | 0.436 | 19 | 0.054 | 0.573 |
| 2 | 0.264 | 0.574 | 20 | −0.281 | 0.534 |
| 3 | −0.102 | 0.512 | 21 | 0.473 | 0.548 |
| 4 | 0.261 | 0.511 | 22 | −0.143 | 0.516 |
| 5 | −0.035 | 0.477 | 23 | 2.109 | 0.777 |
| 6 | 1.119 | 0.774 | 24 | 0.143 | 0.567 |
| 7 | −1.781 | 0.54 | 25 | 2.237 | 0.709 |
| 8 | −0.105 | 0.622 | 26 | 0.675 | 0.665 |
| 9 | −0.042 | 0.576 | 27 | 1.655 | 0.656 |
| 10 | 0.449 | 0.564 | 28 | −0.896 | 0.479 |
| 11 | 0.286 | 0.562 | 29 | 0.06 | 0.602 |
| 12 | 1.987 | 0.634 | 30 | −0.174 | 0.565 |
| 13 | 0.877 | 0.642 | 31 | −0.39 | 0.552 |
| 14 | −0.044 | 0.62 | 32 | 0.496 | 0.678 |
| 15 | 0.834 | 0.586 | 33 | 1.198 | 0.56 |
| 16 | 0.666 | 0.591 | 34 | 1.777 | 0.58 |
| 17 | −0.413 | 0.552 | 35 | 0.14 | 0.727 |
| 18 | 1.42 | 0.598 | 36 | 0.165 | 0.784 |
附表1 在虚假作答时项目触发虚假作答行为的难度βEim值
| Item pair | Estimate | SE | Item pair | Estimate | SE |
|---|---|---|---|---|---|
| 1 | −1.268 | 0.436 | 19 | 0.054 | 0.573 |
| 2 | 0.264 | 0.574 | 20 | −0.281 | 0.534 |
| 3 | −0.102 | 0.512 | 21 | 0.473 | 0.548 |
| 4 | 0.261 | 0.511 | 22 | −0.143 | 0.516 |
| 5 | −0.035 | 0.477 | 23 | 2.109 | 0.777 |
| 6 | 1.119 | 0.774 | 24 | 0.143 | 0.567 |
| 7 | −1.781 | 0.54 | 25 | 2.237 | 0.709 |
| 8 | −0.105 | 0.622 | 26 | 0.675 | 0.665 |
| 9 | −0.042 | 0.576 | 27 | 1.655 | 0.656 |
| 10 | 0.449 | 0.564 | 28 | −0.896 | 0.479 |
| 11 | 0.286 | 0.562 | 29 | 0.06 | 0.602 |
| 12 | 1.987 | 0.634 | 30 | −0.174 | 0.565 |
| 13 | 0.877 | 0.642 | 31 | −0.39 | 0.552 |
| 14 | −0.044 | 0.62 | 32 | 0.496 | 0.678 |
| 15 | 0.834 | 0.586 | 33 | 1.198 | 0.56 |
| 16 | 0.666 | 0.591 | 34 | 1.777 | 0.58 |
| 17 | −0.413 | 0.552 | 35 | 0.14 | 0.727 |
| 18 | 1.42 | 0.598 | 36 | 0.165 | 0.784 |
| [1] | Bartram, D. (2007). Increasing validity with forced-choice criterion measurement formats. International Journal of Selection and Assessment, 15(3), 263-272. |
| [2] | Birkeland, S. A., Manson, T. M., Kisamore, J. L., Brannick, M. T., & Smith, M. A. (2006). A meta-analytic investigation of job applicant faking on personality measures. International Journal of Selection and Assessment, 14(4), 317-335. |
| [3] |
Böckenholt, U. (2014). Modeling motivated misreports to sensitive survey questions. Psychometrika, 79(3), 515-537.
doi: 10.1007/s11336-013-9390-9 pmid: 24297438 |
| [4] | Brooks, S. P., & Gelman, A. (1998). General methods for monitoring convergence of iterative simulations. Journal of Computational and Graphical Statistics, 7(4), 434-455. |
| [5] | Brown, A., & Maydeu-Olivares, A. (2011). Item response modeling of forced-choice questionnaires. Educational and Psychological Measurement, 71(3), 460-502. |
| [6] |
Bunji, K., & Okada, K. (2020). Joint modeling of the two-alternative multidimensional forced-choice personality measurement and its response time by a Thurstonian D-diffusion item response model. Behavior Research Methods, 52(3), 1091-1107.
doi: 10.3758/s13428-019-01302-5 pmid: 32394181 |
| [7] | Bürkner, P. C., Schulte, N., & Holling, H. (2019). On the statistical and practical limitations of Thurstonian IRT models. Educational and Psychological Measurement, 79(5), 827-854. |
| [8] | Cao, M., & Drasgow, F. (2019). Does forcing reduce faking? A meta-analytic review of forced-choice personality measures in high-stakes situations. The Journal of Applied Psychology, 104(11), 1347-1368. |
| [9] | Chen, C. -W., Wang, W. -C., Chiu, M. M., & Ro, S. (2020). Item selection and exposure control methods for computerized adaptive testing with multidimensional ranking items. Journal of Educational Measurement, 57(2), 343-369. |
| [10] | Cheung, M., & Chan, W. (2002). Reducing Uniform Response Bias with Ipsative Measurement in Multiple-Group Confirmatory Factor Analysis. Structural Equation Modeling, 9(1), 55-77. |
| [11] | de Valpine, P., Turek, D., Paciorek, C., Anderson-Bergman, C., Temple Lang, D., & Bodik, R. (2017). Programming with models: Writing statistical algorithms for general model structures with NIMBLE. Journal of Computational and Graphical Statistics, 26(2), 403-413. |
| [12] |
Faul, F., Erdfelder, E., Lang, A. -G., & Buchner, A. (2007). G*Power 3: A flexible statistical power analysis program for the social, behavioral, and biomedical sciences. Behavior Research Methods, 39(2), 175-191.
doi: 10.3758/bf03193146 pmid: 17695343 |
| [13] | Frick, S. (2022). Modeling faking in the multidimensional forced-choice format: The faking mixture model. Psychometrika, 87(2), 773-794. |
| [14] | Gelman, A., & Rubin, D. B. (1992). Inference from iterative simulation using multiple sequences. Statistical Science, 7(4), 457-472. |
| [15] |
Guenole, N., Brown, A. A., & Cooper, A. J. (2018). Forced- choice assessment of work-related maladaptive personality traits: Preliminary evidence from an application of Thurstonian item response modeling. Assessment, 25(4), 513-526.
doi: 10.1177/1073191116641181 pmid: 27056730 |
| [16] | Guo, Z., Wang, D., Cai, Y., & Tu, D. (2023). An Item Response Theory Model for Incorporating Response Times in Forced-Choice Measures. Educational and Psychological Measurement, 84(3), 450-480. |
| [17] |
Heggestad, E. D., Morrison, M., Reeve, C. L., & McCloy, R. A. (2006). Forced-choice assessments of personality for selection: Evaluating issues of normative assessment and faking resistance. Journal of Applied Psychology, 91(1), 9-24.
pmid: 16435935 |
| [18] | Holtgraves, T. (2004). Social desirability and self-reports: Testing models of socially desirable responding. Personality & Social Psychology Bulletin, 30(2), 161-172. |
| [19] | Huang, H. Y. (2023). Diagnostic Classification Model for Forced-Choice Items and Noncognitive Tests. Educational and Psychological Measurement, 83(1), 146-180. |
| [20] |
Hughes, A. W., Dunlop, P. D., Holtrop, D., & Wee, S. (2021). Spotting the “Ideal” personality response: Effects of item matching in forced choice measures for personnel selection. Journal of Personnel Psychology, 20(1), 17-26.
doi: 10.1027/1866-5888/a000267 |
| [21] | Jackson, D. N., Wroblewski, V. R., & Ashton, M. C. (2000). The impact of faking on employment tests: Does forced choice offer a solution? Human Performance, 13(4), 371-388. |
| [22] | Joo, S. -H., Lee, P., & Stark, S. (2020). Adaptive testing with the GGUM-RANK multidimensional forced choice model: Comparison of pair, triplet, and tetrad scoring. Behavior Research Methods, 52(2), 761-772 |
| [23] | König, C. J., Merz, A. S., & Trauffer, N. (2012). What is in applicants' minds when they fill out a personality test? Insights from a qualitative study. International Journal of Selection and Assessment, 20(4), 442-452. |
| [24] |
Kreitchmann, R. S., Sorrel, M. A., & Abad, F. J. (2023). On bank assembly and block selection in multidimensional forced-choice adaptive assessments. Educational and Psychological Measurement, 83(2), 294-321.
doi: 10.1177/00131644221087986 pmid: 36866066 |
| [25] |
Lin, Y., & Brown, A. (2017). Influence of context on item parameters in forced-choice personality assessments. Educational and Psychological Measurement, 77(3), 389-414.
doi: 10.1177/0013164416646162 pmid: 29795919 |
| [26] |
Liu, J., Zheng, C. J., Li, Y. C., & Lian, X. (2022). IRT-based scoring methods for multidimensional forced choice tests. Advances in Psychological Science, 30(6), 1410-1428.
doi: 10.3724/SP.J.1042.2022.01410 |
|
[刘娟, 郑蝉金, 李云川, 连旭. (2022). 适用于多维迫选测验的 IRT 计分模型. 心理科学进展, 30(6), 1410-1428.]
doi: 10.3724/SP.J.1042.2022.01410 |
|
| [27] | MacCann, C., Ziegler, M., & Roberts, R. D. (2011). Faking in personality assessment. In M. Ziegler, C. MacCann, & R. Roberts (Eds.), New perspectives on faking in personality assessment (pp. 309-329). Oxford University Press. |
| [28] | Morrison, E., & Bies, R. (1991). Impression management in the feedback-seeking process: A literature review and research agenda. Academy of Management Review, 16(3), 522-541. |
| [29] | Pauls, C. A., & Crost, N. W. (2005). Effects of different instructional sets on the construct validity of the NEO-PI-R. Personality and Individual Differences, 39(2), 297-308. |
| [30] | Peng, S., Man, K., Veldkamp, B. P., Cai, Y., & Tu, D. (2024). A mixture model for random responding behavior in forced-choice noncognitive assessment: Implication and application in organizational research. Organizational Research Methods, 27(3), 414-442. |
| [31] |
Sass, R., Frick, S., Reips, U. -D., & Wetzel, E. (2020). Taking the test taker's perspective: Response process and test motivation in multidimensional forced-choice versus rating scale instruments. Assessment, 27(3), 572-584.
doi: 10.1177/1073191118762049 pmid: 29560735 |
| [32] | Saville, P., & Willson, E. (1991). The reliability and validity of normative and ipsative approaches in the measurement of personality. Journal of Occupational Psychology, 64(3), 219-238. |
| [33] | Sinharay, S., Johnson, M. S., & Stern, H. S. (2006). Posterior predictive assessment of item response theory models. Applied Psychological Measurement, 30(4), 298-321. |
| [34] |
Smith, D. B., & Ellingson, J. E. (2002). Substance versus style: A new look at social desirability in motivating contexts. Journal of Applied Psychology, 87(2), 211-219.
pmid: 12002950 |
| [35] |
Speer, A. B., Wegmeyer, L. J., Tenbrink, A. P., Delacruz, A. Y., Christiansen, N. D., & Salim, R. M. (2023). Comparing forced-choice and single-stimulus personality scores on a level playing field: A meta-analysis of psychometric properties and susceptibility to faking. Journal of Applied Psychology, 108(11), 1812-1833.
doi: 10.1037/apl0001099 pmid: 37326537 |
| [36] | Tourangeau, R., & Rasinski, K. A. (1988). Cognitive-processes underlying context effects in attitude measurement. Psychological Bulletin, 103(3), 299-314. |
| [37] | Trent, J. D., Barron, L. G., Rose, M. R., & Carretta, T. R. (2020). Tailored adaptive personality assessment system (TAPAS) as an indicator for counterproductive work behavior: Comparing validity in applicant, honest, and directed faking conditions. Military Psychology, 32(1), 51-59. |
| [38] | van der Linden, D., te Nijenhuis, J., & Bakker, A. B. (2010). The general factor of personality: A meta-analysis of big five intercorrelations and a criterion-related validity study. Journal of Research in Personality, 44(3), 315-327. |
| [39] | Vehtari, A., Gelman, A., & Gabry, J. (2017). Practical Bayesian model evaluation using leave-one-out cross validation and WAIC. Statistics and Computing, 27(5), 1413-1432. |
| [40] | Viswesvaran, C., & Ones, D. S. (1999). Meta-analyses of fakability estimates: Implications for personality measurement. Educational and Psychological Measurement, 59(2), 197-210. |
| [41] | Walczyk, J. J., Schwartz, J. P., Clifton, R., Adams, B., Wei, M. I. N., & Zha, P. (2005). Lying person-to-person about life events: A cognitive framework for lie detection. Personnel Psychology, 58(1), 141-170. |
| [42] | Wang, Q., Zheng, Y., Liu, K., Cai, Y., Peng, S., & Tu, D. (2024). Item selection methods in multidimensional computerized adaptive testing for forced-choice items using Thurstonian IRT model. Behavior Research Methods, 56(2), 600-614. |
| [43] |
Wang, S., Lou, F., & Liu, H. Y. (2014). The conventional and the IRT-based scoring methods of forced-choice personality tests. Advances in Psychological Science, 22(3), 549-557.
doi: 10.3724/SP.J.1042.2014.00549 |
|
[王珊, 骆方, 刘红云. (2014). 迫选式人格测验的传统计分与IRT计分模型. 心理科学进展, 22(3), 549-557.]
doi: 10.3724/SP.J.1042.2014.00549 |
|
| [44] | Wen, H. B., & Wang, S. M. (2020). Influence of block context on accuracy of ability parameter estimated by unfolding model in forced-choice test. Journal of Psychological Science, 43(4), 990-996. |
| [温红博, 王帅鸣. (2020). 迫选测验中题组环境对展开模型能力估计精度的影响. 心理科学, 43(4), 990-996.] | |
| [45] |
Wetzel, E., & Frick, S. (2020). Comparing the validity of trait estimates from the multidimensional forced-choice format and the rating scale format. Psychological Assessment, 32(3), 239-253.
doi: 10.1037/pas0000781 pmid: 31738070 |
| [46] |
Wetzel, E., Frick, S., & Brown, A. (2021). Does multidimensional forced-choice prevent faking? Comparing the susceptibility of the multidimensional forced-choice format and the rating scale format to faking. Psychological Assessment, 33(2), 156-170.
doi: 10.1037/pas0000971 pmid: 33151727 |
| [47] | Zhang, B., Sun, T., Drasgow, F., Chernyshenko, O. S., Nye, C. D., Stark, S., & White, L. A. (2020). Though forced, still valid: Psychometric equivalence of forced-choice and single- statement measures. Organizational Research Methods, 23(3), 569-590. |
| [48] | Ziegler, M. (2011). Applicant faking: A look into the black box. The Industrial-Organizational Psychologist, 49(1), 29-36. |
| [1] | 黄峰, 丁慧敏, 李思嘉, 韩诺, 狄雅政, 刘晓倩, 赵楠, 李林妍, 朱廷劭. 基于大语言模型的自助式AI心理咨询系统构建及其效果评估[J]. 心理学报, 2025, 57(11): 2022-2042. |
| [2] | 唐小娟, 毛萌萌, 李瑜, 丁树良, 彭志霞. 认知诊断测验最简完备Q矩阵统一设计方法[J]. 心理学报, 2025, 57(10): 1849-1866. |
| [3] | 李毕琴, 张美霞, 杨少云, 黄鹏飞, 王爱君, 党君华. 秒内不同时距下自我加工优势效应[J]. 心理学报, 2025, 57(9): 1529-1539. |
| [4] | 陆翔宇, 陈平. 交互式问题解决测验中学习效应的分析:过程数据测量模型的拓展与应用[J]. 心理学报, 2025, 57(9): 1677-1688. |
| [5] | 汪玲玲, 孙小坚. 认知诊断模型属性层级关系和Q矩阵的联合验证方法:面向实践的视角[J]. 心理学报, 2025, 57(7): 1295-1308. |
| [6] | 章彦博, 黄峰, 莫柳铃, 刘晓倩, 朱廷劭. 基于大语言模型的自杀意念文本数据增强与识别技术[J]. 心理学报, 2025, 57(6): 987-1000. |
| [7] | 温忠麟, 马鹏, 孟进, 王一帆. 因果·影响·相关与预测辨析[J]. 心理学报, 2025, 57(6): 1108-1118. |
| [8] | 方杰, 温忠麟, 王惠惠, 顾红磊. 密集追踪数据的有调节的中介效应分析[J]. 心理学报, 2025, 57(5): 915-928. |
| [9] | 郭小军, 焦玉月, 柏小云, 罗照盛, 李弘. 心理实验数据的联合建模:反应与反应时的混合影响[J]. 心理学报, 2024, 56(11): 1619-1633. |
| [10] | 唐小娟, 彭志霞, 秦珊珊, 丁树良, 毛萌萌, 李瑜. 基于可达阵的多级评分最简完备Q矩阵设计[J]. 心理学报, 2024, 56(11): 1634-1650. |
| [11] | 温忠麟, 王一帆, 马鹏, 孟进. 变量之间的影响关系和多重影响因素的共同作用类型[J]. 心理学报, 2024, 56(10): 1462-1470. |
| [12] | 徐静, 骆方, 马彦珍, 胡路明, 田雪涛. 开放式情境判断测验的自动化评分[J]. 心理学报, 2024, 56(6): 831-844. |
| [13] | 谭青蓉, 蔡艳, 汪大勋, 罗芬, 涂冬波. CD-CAT中基于SCAD惩罚和EM视角的在线标定方法开发——G-DINA模型[J]. 心理学报, 2024, 56(5): 670-688. |
| [14] | 郭磊, 秦海江. 基于信号检测论的认知诊断评估:构建与应用[J]. 心理学报, 2024, 56(3): 339-351. |
| [15] | 郭小军, 柏小云, 罗照盛. 作答时间与反应依赖关系建模:基于双因子模型视角[J]. 心理学报, 2024, 56(3): 352-362. |
| 阅读次数 | ||||||
|
全文 |
|
|||||
|
摘要 |
|
|||||