ISSN 0439-755X
CN 11-1911/B
CN 11-1911/B
Acta Psychologica Sinica ›› 2026, Vol. 58 ›› Issue (7): 1297-1311.doi: 10.3724/SP.J.1041.2026.1297
• Reports of Empirical Studies • Previous Articles Next Articles
SUN Mengying, RAN Ping, SUN Qi( )
)
Published:2026-07-25
Online:2026-05-15
Contact:
SUN Qi
E-mail:lblpsy@snnu.edu.cn
SUN Mengying, RAN Ping, SUN Qi. (2026). Estimation of point-light walker direction can be an efficient-coding and Bayesian decoding process. Acta Psychologica Sinica, 58(7), 1297-1311.
Add to citation manager EndNote|Ris|BibTeX
URL: https://journal.psych.ac.cn/acps/EN/10.3724/SP.J.1041.2026.1297
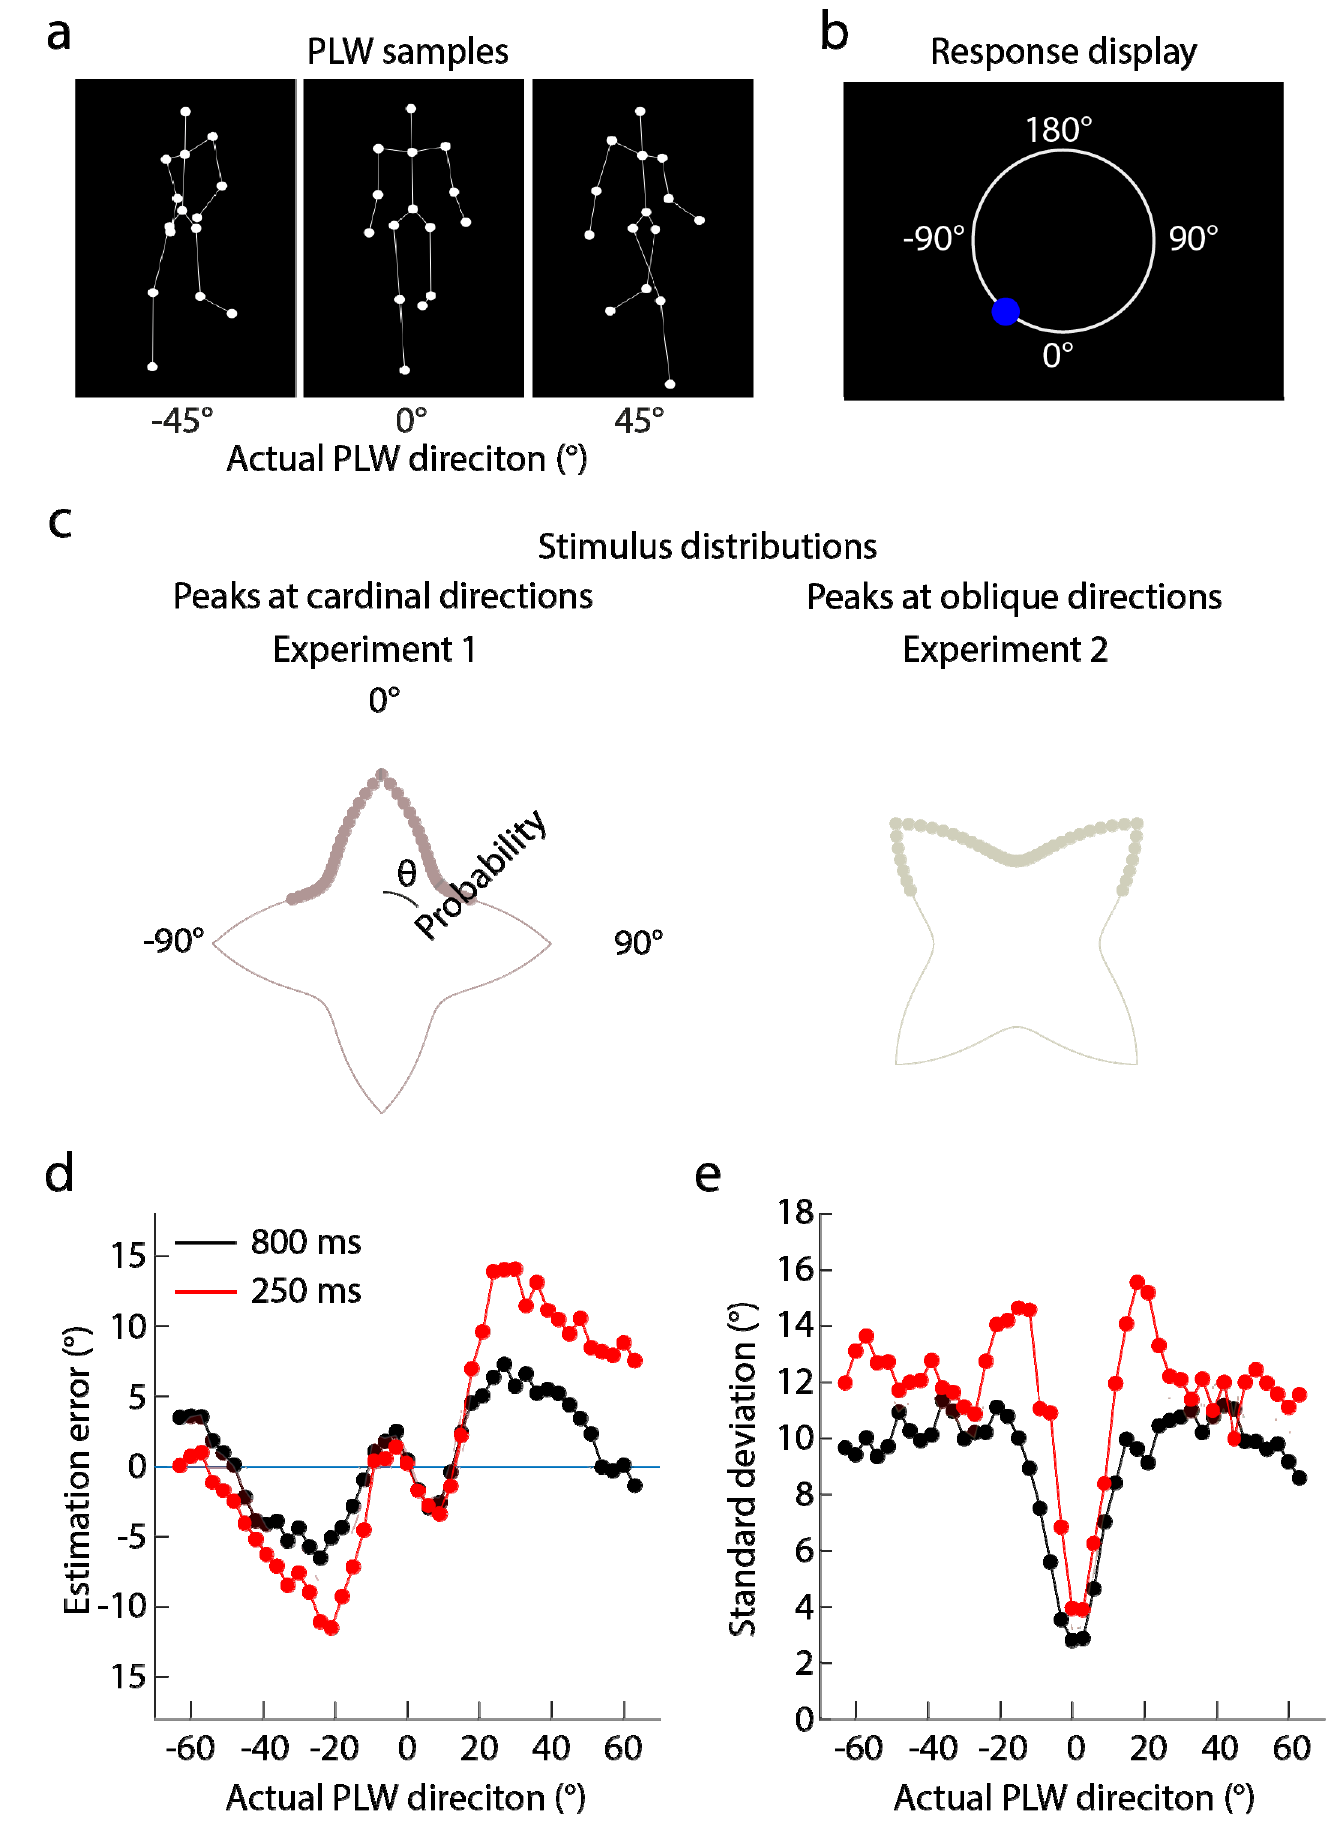
Figure 1. Illustrations of PLW displays, stimulus distribution, and behavioral results. (a) Each point-light walker (PLW) consisted of 16 white dots. The white lines were invisible in the experiment. (b) Response display in which a blue probe was positioned on a white circle. We instructed the participants to manipulate the mouse to shift the probe's location on the circle, thereby indicating their perceived PLW direction. Before conducting the experiment, we informed the participants that the bottom, top, left, and right midpoints of the response circle corresponded to the 0°, 180°, -90° (270°), and 90° PLW directions, respectively, as indicated by the numbers that were invisible in the experiment. (c) Illustrations of stimulus distributions (light solid lines) used in the current study. The left panel shows a distribution in which four peaks are at the cardinal directions (0°, ±90°, and 180°); the right panel shows the peaks at the oblique directions (±45° and ±135°). The dots indicate the PLW directions used in the current study. (d-e) Estimation error and standard deviation are against the PLW direction. The dots and shaded areas indicate the mean estimation error and standard error averaged across all participants.
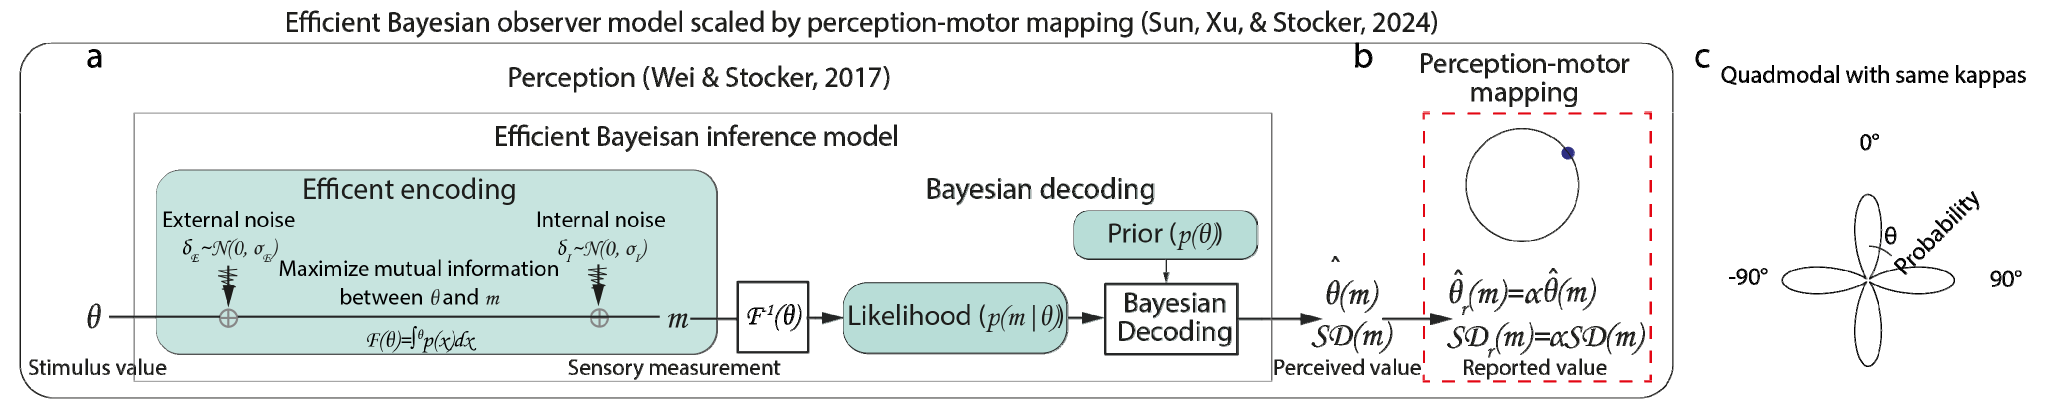
Figure 2. Illustration of the extended efficient Bayesian observer model and ideal long-term priors used in the current study. (a-b) Illustration of an efficient Bayesian inference model scaled by the perception-motor mapping process developed by Sun, Xu, et al. (2024). The model consists of two parts: (a) Bayesian decoding constrained by efficient encoding, and (b) motor mapping. (a) The efficient Bayesian observer model assumes that the stimulus feature ($\theta $) (e.g., heading direction) is first encoded in a sensory signal (m) by maximizing the mutual information between $\text{θ}$ and m ($F(\theta )$), which is distorted by the external (δE) and internal (δI) noises. The two types of noises are assumed to follow a normal distribution with the distribution center 0°and standard deviations σE and σI. Then, the sensory signal (m) is transformed back to the stimulus space by inverting the F process (${F}^{-1}(\theta )$), which generates the likelihood distribution (p(m|$\theta $)). Lastly, the sensory system conducts a Bayesian inference process by combining the prior (p($\theta $)) and the likelihood distribution (p(m|$\text{θ}$)), which computes an optimal estimate of the feature value $\widehat{\theta }\text{(}m\text{)}$. (b) Sun, Xu, et al. (2024) found that the reported estimates (${\widehat{\theta }}_{r}(m)$) that are recorded in the experiment are not exactly equal to the estimates of Bayesian decoding ($\widehat{\theta }(m)$). They are linearly related to each other, given by ${\widehat{\theta }}_{r}(m)=\alpha \widehat{\theta }(m)$. The value of $\text{α}$ is determined by the response range. The larger the response range is, the larger the $\alpha $is. (c) A quad-modal long-term prior distribution used in the current study, in which the four peaks were located at the 0°, ±90°, and 180°.
| Parameters | Significance |
|---|---|
| The noise magnitude of long-term priors around a certain peak. Note that in the quad-modal prior illustrated by | |
| The noise magnitude of the likelihood distribution. | |
| The weight assigned to the stimulus distribution (i.e. short-term prior ( | |
| The magnitude of the scaling factor of the motor-perception mapping process. |
Table 1 Significances of different parameters in our models
| Parameters | Significance |
|---|---|
| The noise magnitude of long-term priors around a certain peak. Note that in the quad-modal prior illustrated by | |
| The noise magnitude of the likelihood distribution. | |
| The weight assigned to the stimulus distribution (i.e. short-term prior ( | |
| The magnitude of the scaling factor of the motor-perception mapping process. |
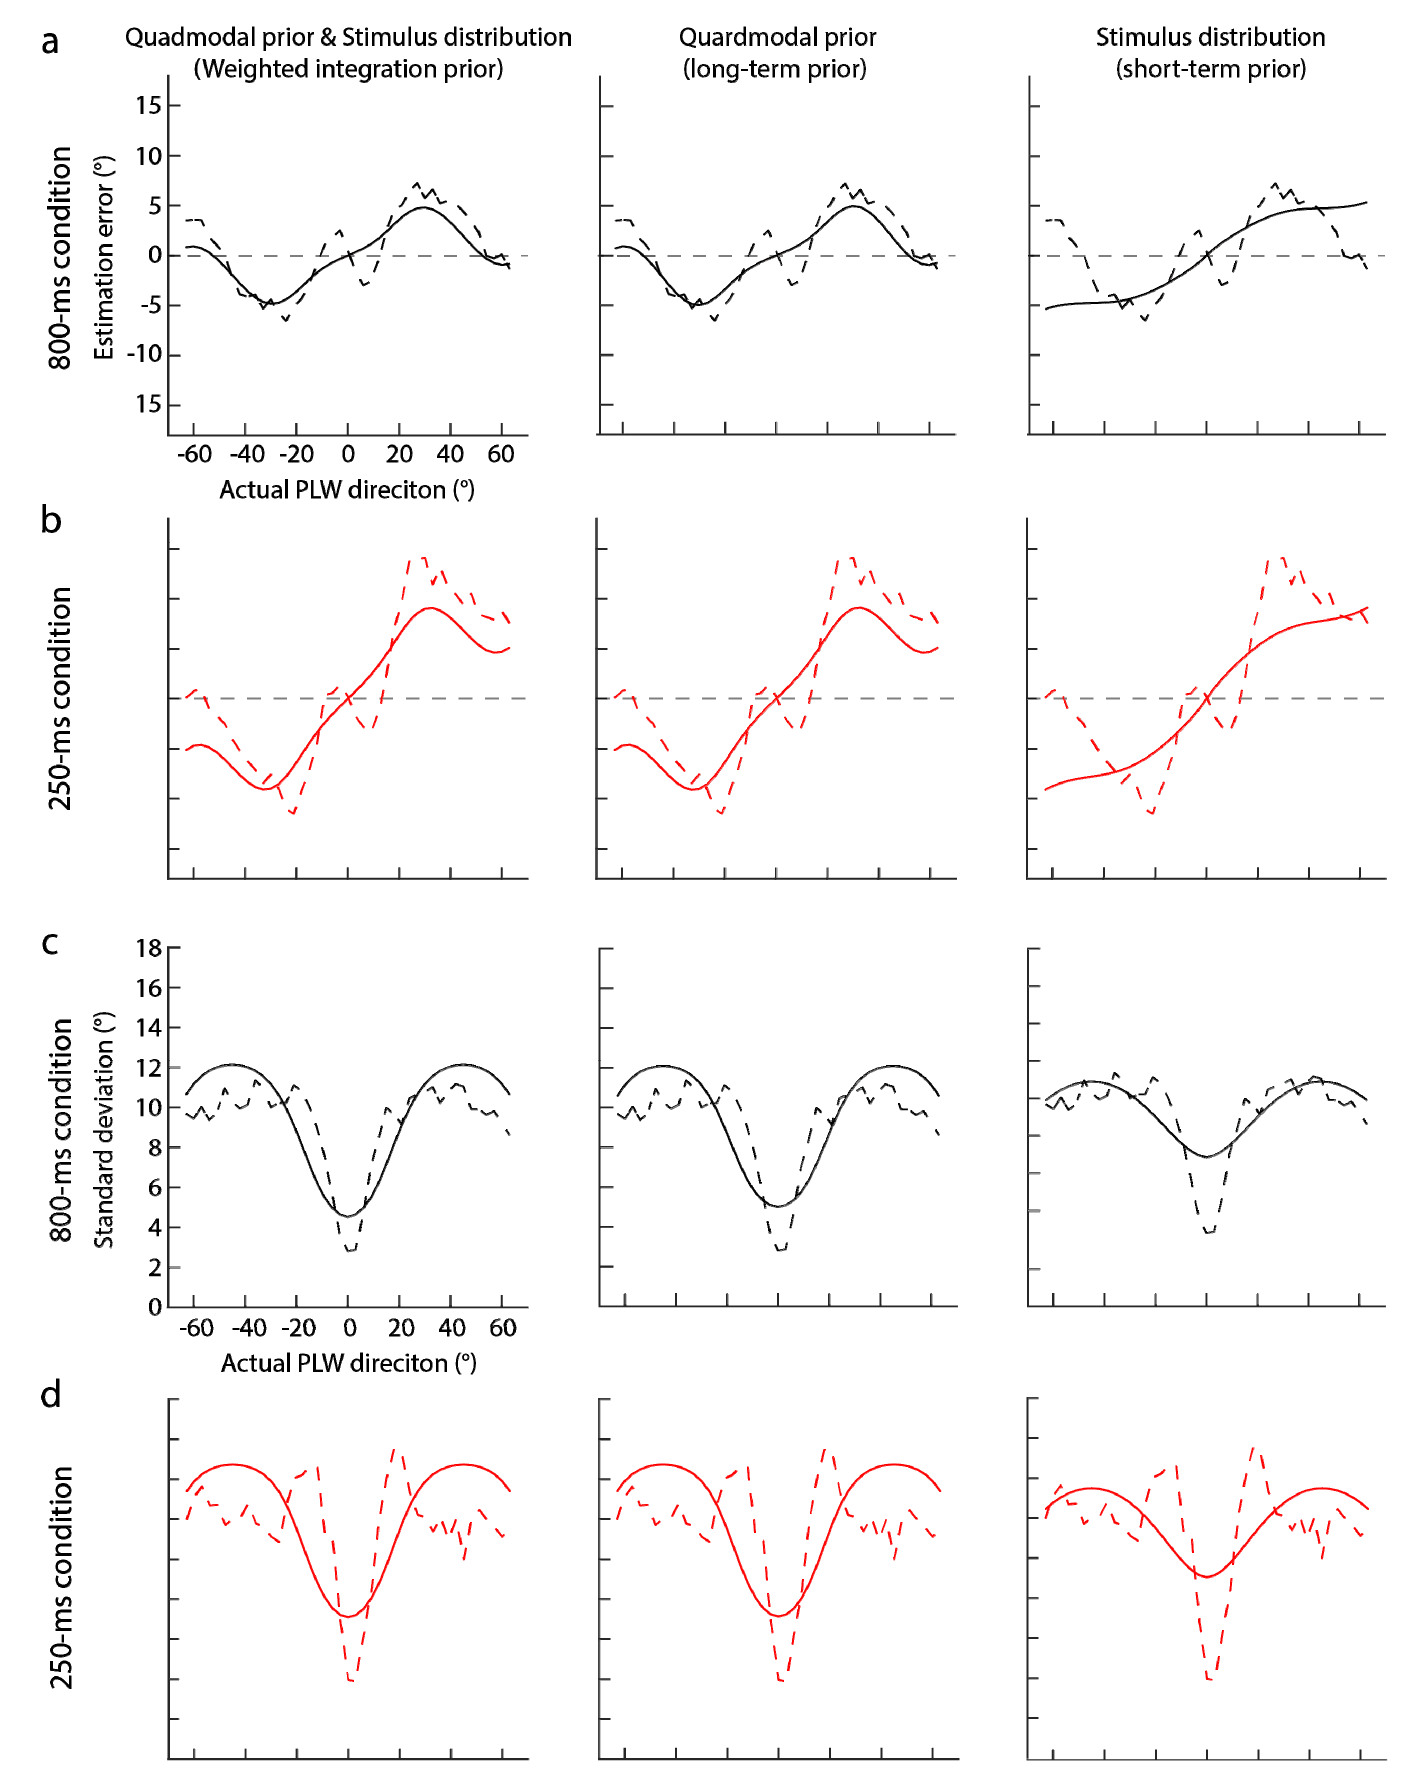
Figure 3. Results of predicted estimation errors and standard deviations in Experiment 1. (a) and (b) show the estimation error results of the 800-ms and 250-ms conditions. (c) and (d) show the standard deviation results of the 800-ms and 250-ms conditions. The dashed line illustrates the mean estimation error or standard deviation averaged across all participants. The solid line illustrates the mean predicted estimation error or standard deviation averaged across all participants. The shaded area illustrates the standard error of predicted estimation errors or standard deviation across all participants. In addition, the panels in the left, middle, and right column illustrate the results of models with a weighted integration prior (Equation 4.3), the quad-modal long-term prior (Equation 4.1), and the short-term prior (Equation 4.2).
| Estimation error | Standard deviation | |||||||
|---|---|---|---|---|---|---|---|---|
| Deviance | AIC | BIC | R2 | Deviance | AIC | BIC | R2 | |
| ModelStimDist&4Peaks | 173.27 | 183.27 | 192.10 | 0.78 | 166.49 | 176.49 | 178.11 | 0.40 |
| Model4Peaks | 172.38 | 180.38 | 187.43 | 0.78 | 166.66 | 174.66 | 181.71 | 0.40 |
| ModelStimDist | 243.87 | 246.87 | 257.44 | 0.060 | 151.01 | 163.01 | 173.58 | 0.58 |
| ModelStimDist&4Peaks | 230.45 | 240.45 | 249.25 | 0.79 | 211.40 | 221.40 | 230.20 | -0.29 |
| Model4Peaks | 230.38 | 238.38 | 245.43 | 0.79 | 211.55 | 219.55 | 226.59 | -0.29 |
| ModelStimDist | 269.41 | 277.41 | 284.46 | -1.10 | 218.89 | 226.89 | 233.93 | -1.03 |
Table 2 Descriptive statistics of model results in Experiment 1.
| Estimation error | Standard deviation | |||||||
|---|---|---|---|---|---|---|---|---|
| Deviance | AIC | BIC | R2 | Deviance | AIC | BIC | R2 | |
| ModelStimDist&4Peaks | 173.27 | 183.27 | 192.10 | 0.78 | 166.49 | 176.49 | 178.11 | 0.40 |
| Model4Peaks | 172.38 | 180.38 | 187.43 | 0.78 | 166.66 | 174.66 | 181.71 | 0.40 |
| ModelStimDist | 243.87 | 246.87 | 257.44 | 0.060 | 151.01 | 163.01 | 173.58 | 0.58 |
| ModelStimDist&4Peaks | 230.45 | 240.45 | 249.25 | 0.79 | 211.40 | 221.40 | 230.20 | -0.29 |
| Model4Peaks | 230.38 | 238.38 | 245.43 | 0.79 | 211.55 | 219.55 | 226.59 | -0.29 |
| ModelStimDist | 269.41 | 277.41 | 284.46 | -1.10 | 218.89 | 226.89 | 233.93 | -1.03 |
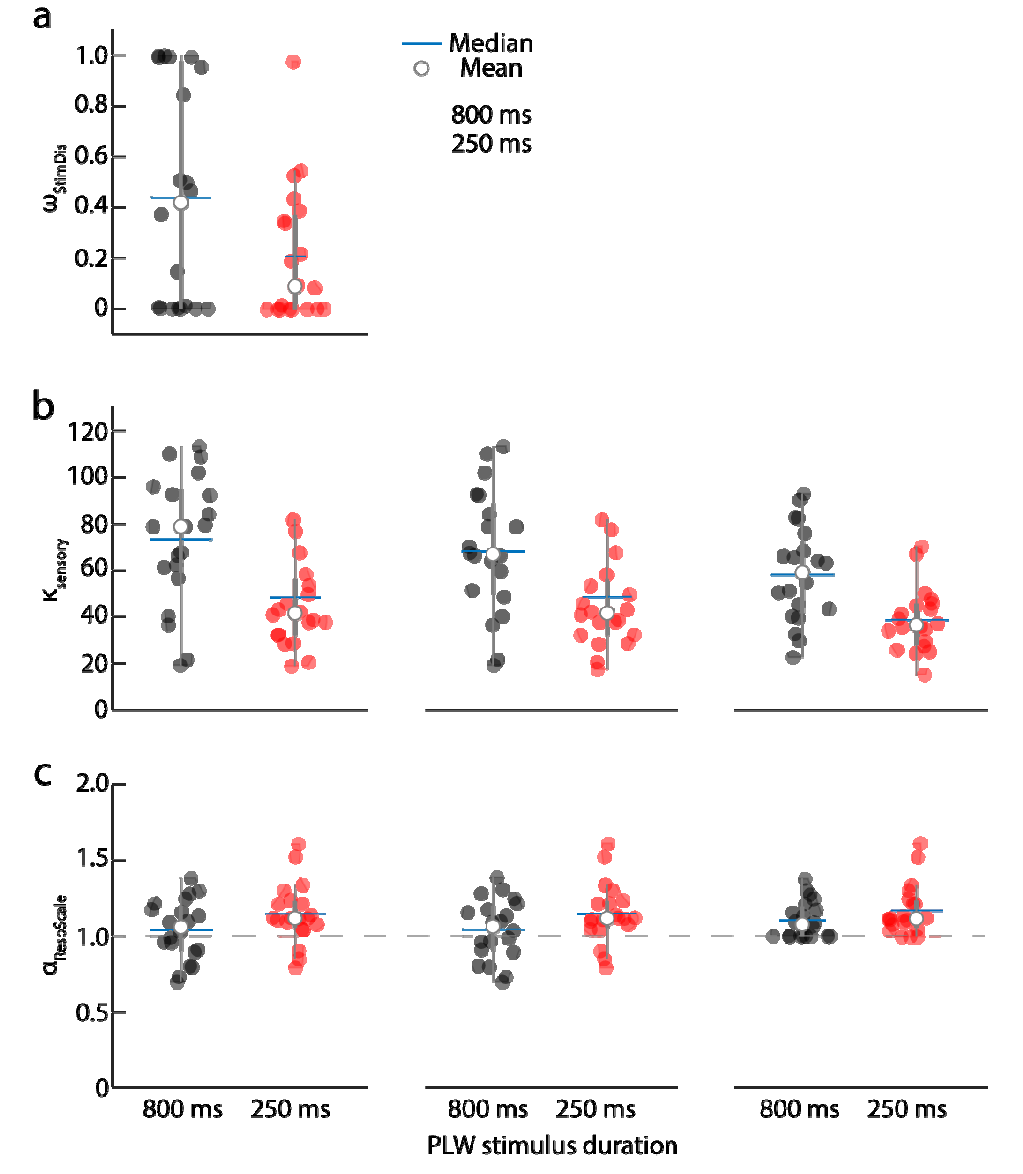
Figure 4. The values of model parameters against different models. (a), (b) and (c) corresponds to the {$\omega \_stim,\kappa \_sen,\alpha $} that indicate the weight of stimulus distribution in the weighted- integration prior, the magnitude of sensory noise, and the scaling factor of the motor-action mapping. Please check the Appendix Figure 2 for the ${\kappa }_{prior}$s of different models. Please check Table 1 for the parameters’ significances.
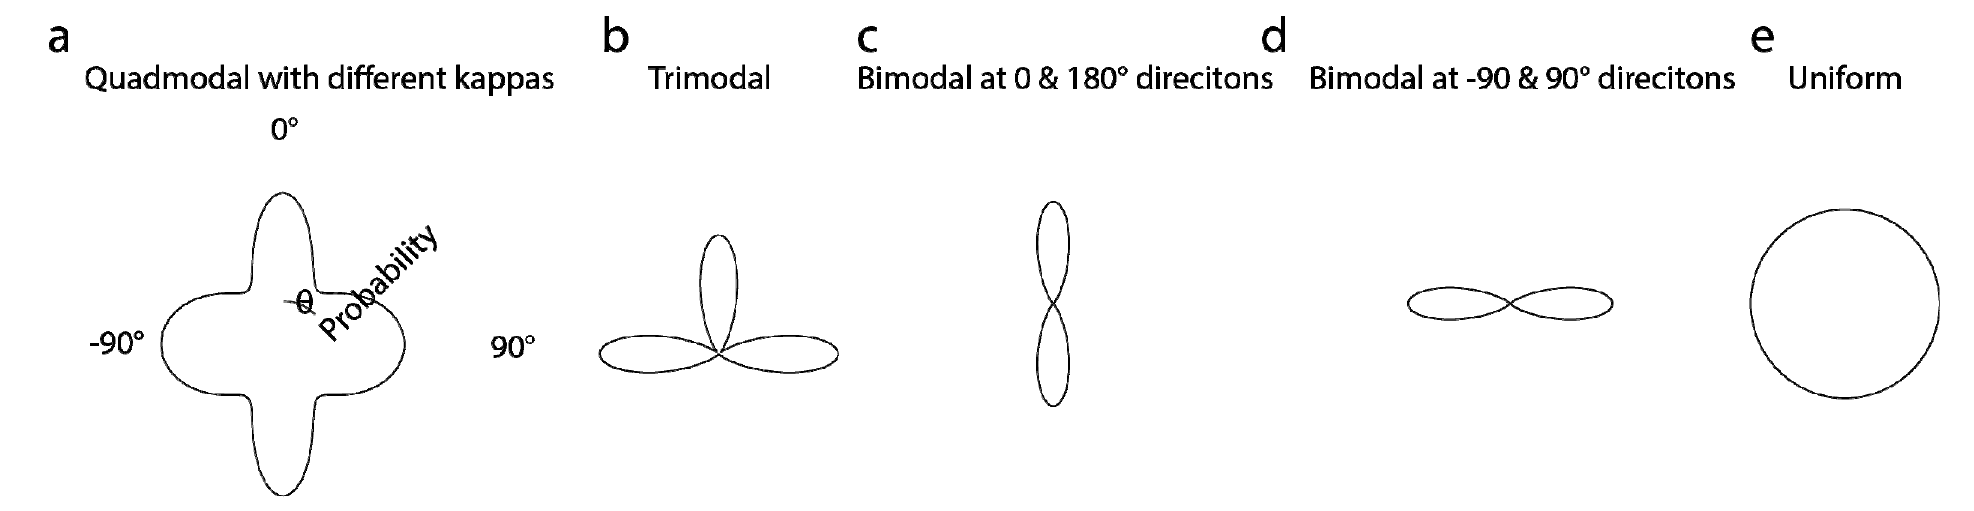
Figure 5. Five new long-term priors used in the models.
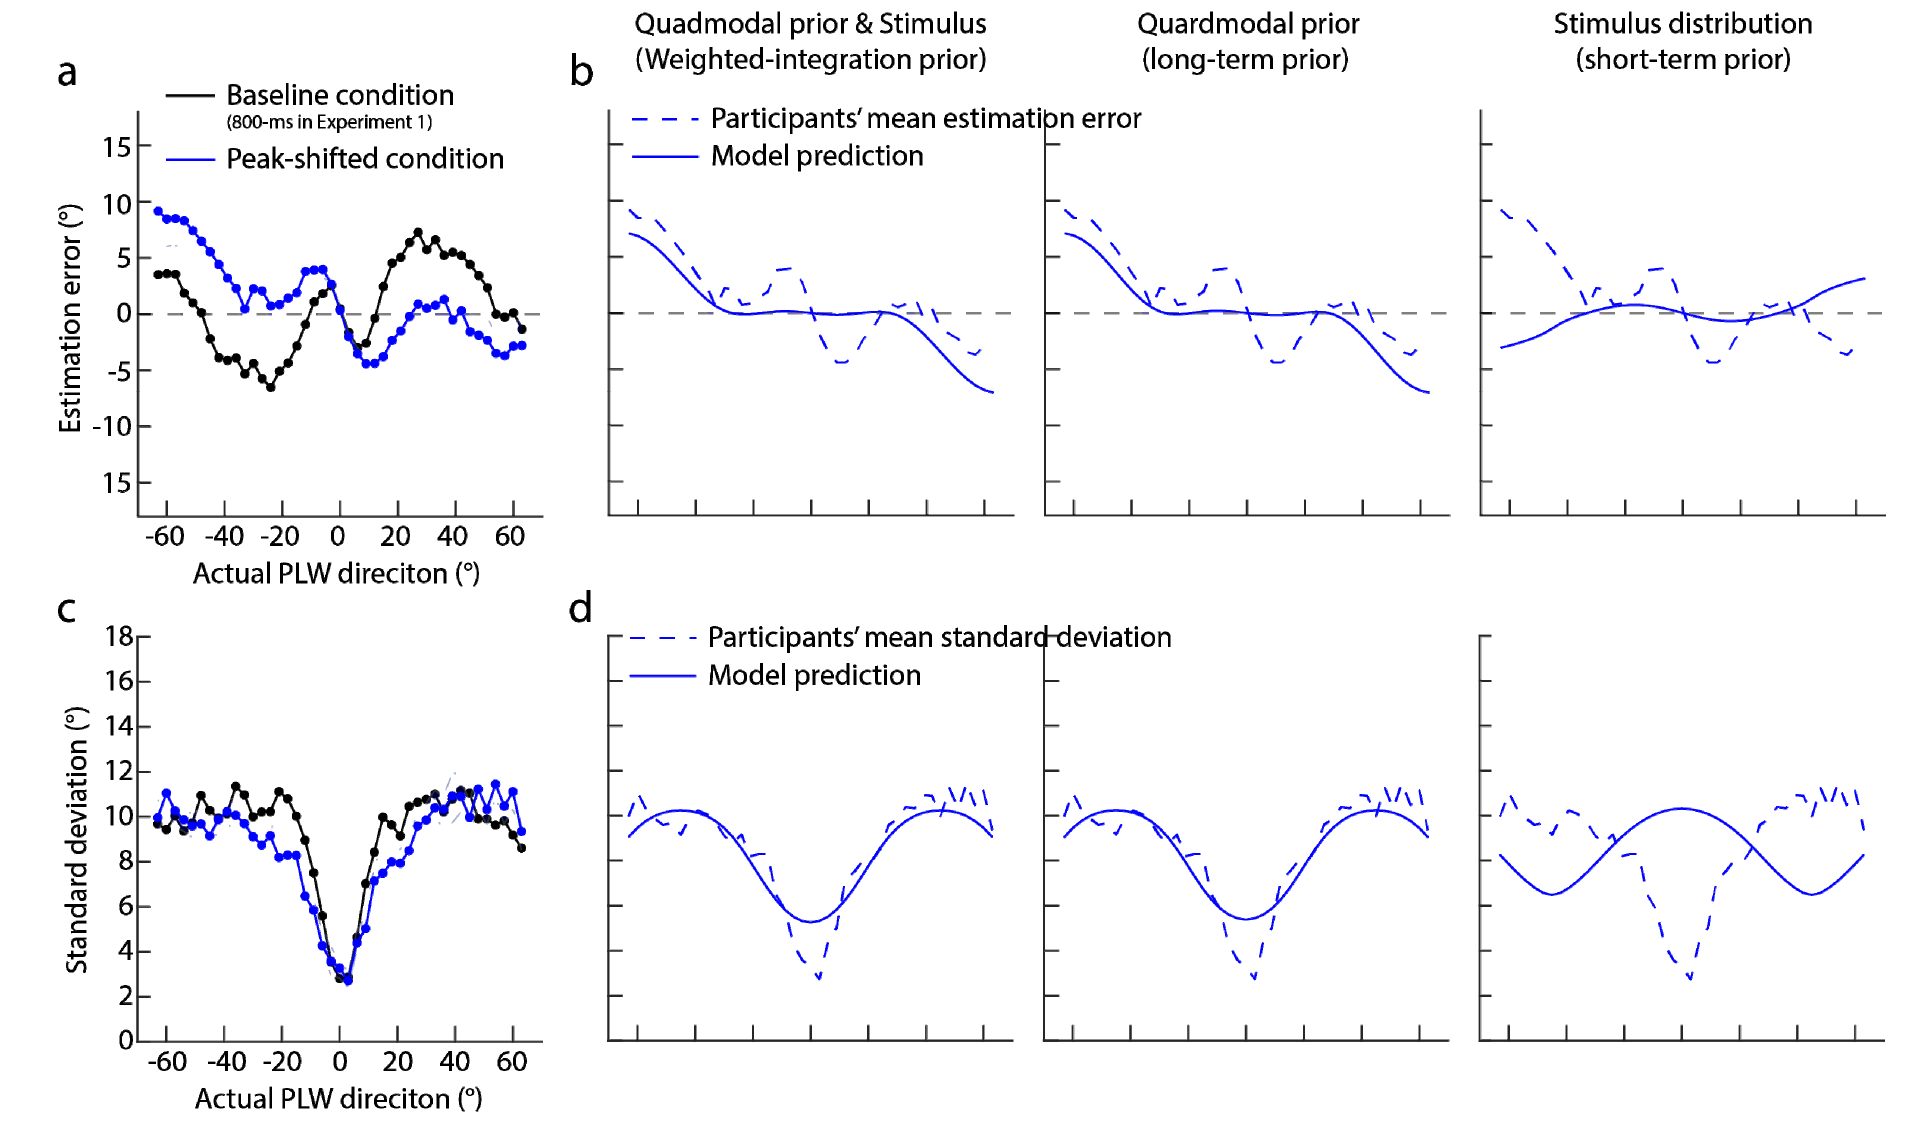
Figure 6. Results of Experiment 2. (a) Estimation error and (c) standard deviation is against the PLW direction. The dots and shaded areas indicate the mean estimation error and standard error averaged across all participants. Note that the baseline condition is the same as the 800-ms condition in Experiment 1. (b) Predicted estimation error and (d) predicted standard deviation are against the PLW direction. Each panel corresponds to one model with a certain prior. The dashed line illustrates the mean estimation error and standard deviation averaged across all participants. The solid line illustrates the mean predicted estimation error and standard deviation averaged across all participants. The shaded area illustrates the standard error across all participants.
| Estimation error | Standard deviation | |||||||
|---|---|---|---|---|---|---|---|---|
| Deviance | AIC | BIC | R2 | Deviance | AIC | BIC | R2 | |
| ModelStimDist&4Peaks | 199.52 | 209.52 | 218.20 | 0.57 | 115.28 | 125.28 | 134.08 | 0.84 |
| Model4Peaks | 199.00 | 207.00 | 214.05 | 0.57 | 118.06 | 126.06 | 133.11 | 0.83 |
| ModelStimDist | 260.19 | 268.19 | 275.24 | -0.77 | 230.33 | 238.33 | 245.38 | -1.36 |
Table 3 Descriptive statistics of model results in Experiment 2.
| Estimation error | Standard deviation | |||||||
|---|---|---|---|---|---|---|---|---|
| Deviance | AIC | BIC | R2 | Deviance | AIC | BIC | R2 | |
| ModelStimDist&4Peaks | 199.52 | 209.52 | 218.20 | 0.57 | 115.28 | 125.28 | 134.08 | 0.84 |
| Model4Peaks | 199.00 | 207.00 | 214.05 | 0.57 | 118.06 | 126.06 | 133.11 | 0.83 |
| ModelStimDist | 260.19 | 268.19 | 275.24 | -0.77 | 230.33 | 238.33 | 245.38 | -1.36 |
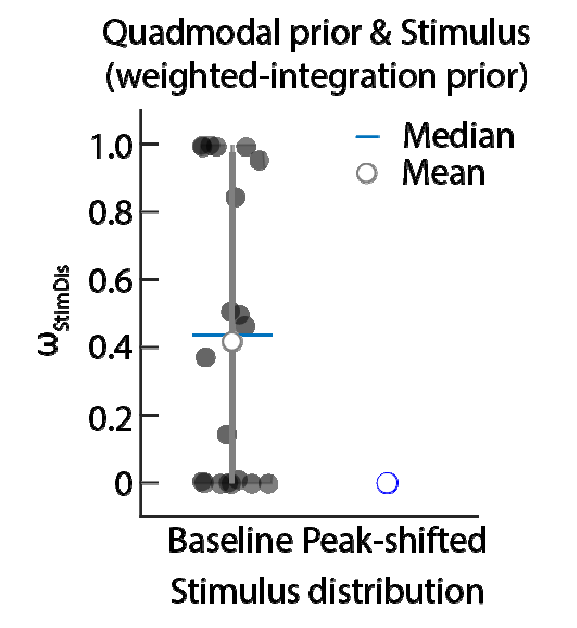
Figure 7. The weight of stimulus distribution {${\omega }_{stim},$} in the weighted- integration prior against different stimulus distributions. Note that the baseline condition is the same as the 800-ms condition in Experiment 1.
| Estimation error | Standard deviation | |||||||
|---|---|---|---|---|---|---|---|---|
| Deviance | AIC | BIC | R | Deviance | AIC | BIC | R | |
| ModelStimDist&4Peaks(same kappa) | 173.27 | 183.27 | 192.10 | 0.78 | 166.49 | 176.49 | 178.11 | 0.40 |
| ModelStimDist&4Peaks (different kappa)) | 185.06 | 197.06 | 207.63 | 0.70 | 148.59 | 160.59 | 171.15 | 0.60 |
| ModelStimDist&3Peaks | 172.98 | 182.98 | 184.60 | 0.78 | 166.38 | 176.38 | 185.19 | 0.40 |
| ModelStimDist&2PeaksV | 206.71 | 216.71 | 225.52 | 0.51 | 148.65 | 158.65 | 167.46 | 0.60 |
| ModelStimDist&2PeaksH | 209.16 | 219.16 | 227.96 | 0.48 | 152.85 | 162.85 | 176.65 | 0.56 |
| ModelStimDist&Uniform | 212.20 | 220.20 | 227.25 | 0.45 | 151.56 | 159.56 | 166.60 | 0.58 |
| Model4Peaks(same kappa) | 172.38 | 180.38 | 187.43 | 0.78 | 166.66 | 174.66 | 181.71 | 0.40 |
| Model3Peaks | 172.18 | 180.18 | 187.22 | 0.78 | 166.70 | 174.70 | 181.74 | 0.40 |
| ModelStimDist | 243.87 | 246.87 | 257.44 | 0.060 | 151.01 | 163.01 | 173.58 | 0.58 |
| ModelStimDist&4Peaks(same kappa) | 230.45 | 240.45 | 249.25 | 0.79 | 211.40 | 221.40 | 230.20 | -0.29 |
| ModelStimDist&4Peaks(different kappa)) | 231.01 | 243.01 | 253.58 | 0.78 | 204.47 | 216.47 | 227.04 | -0.10 |
| ModelStimDist&3Peaks | 231.16 | 241.16 | 249.97 | 0.78 | 211.34 | 221.34 | 230.14 | -0.29 |
| ModelStimDist&2PeaksV | 247.72 | 257.72 | 266.52 | 0.68 | 201.79 | 211.79 | 220.60 | -0.03 |
| ModelStimDist&2PeaksH | 247.43 | 257.43 | 266.12 | 0.68 | 192.94 | 202.94 | 211.74 | 0.16 |
| ModelStimDist&Uniform | 251.62 | 259.62 | 266.67 | 0.65 | 193.01 | 201.01 | 208.06 | 0.16 |
| Model4Peaks(same kappa) | 230.38 | 238.38 | 245.43 | 0.79 | 211.55 | 219.55 | 226.59 | -0.29 |
| Model3Peaks | 230.90 | 238.90 | 245.94 | 0.78 | 211.21 | 219.21 | 226.25 | -0.28 |
| ModelStimDist | 269.41 | 277.41 | 284.46 | -1.10 | 218.89 | 226.89 | 233.93 | -1.03 |
with different the same widths at the 0/180° and -90/90° reference directions.
| Estimation error | Standard deviation | |||||||
|---|---|---|---|---|---|---|---|---|
| Deviance | AIC | BIC | R | Deviance | AIC | BIC | R | |
| ModelStimDist&4Peaks(same kappa) | 173.27 | 183.27 | 192.10 | 0.78 | 166.49 | 176.49 | 178.11 | 0.40 |
| ModelStimDist&4Peaks (different kappa)) | 185.06 | 197.06 | 207.63 | 0.70 | 148.59 | 160.59 | 171.15 | 0.60 |
| ModelStimDist&3Peaks | 172.98 | 182.98 | 184.60 | 0.78 | 166.38 | 176.38 | 185.19 | 0.40 |
| ModelStimDist&2PeaksV | 206.71 | 216.71 | 225.52 | 0.51 | 148.65 | 158.65 | 167.46 | 0.60 |
| ModelStimDist&2PeaksH | 209.16 | 219.16 | 227.96 | 0.48 | 152.85 | 162.85 | 176.65 | 0.56 |
| ModelStimDist&Uniform | 212.20 | 220.20 | 227.25 | 0.45 | 151.56 | 159.56 | 166.60 | 0.58 |
| Model4Peaks(same kappa) | 172.38 | 180.38 | 187.43 | 0.78 | 166.66 | 174.66 | 181.71 | 0.40 |
| Model3Peaks | 172.18 | 180.18 | 187.22 | 0.78 | 166.70 | 174.70 | 181.74 | 0.40 |
| ModelStimDist | 243.87 | 246.87 | 257.44 | 0.060 | 151.01 | 163.01 | 173.58 | 0.58 |
| ModelStimDist&4Peaks(same kappa) | 230.45 | 240.45 | 249.25 | 0.79 | 211.40 | 221.40 | 230.20 | -0.29 |
| ModelStimDist&4Peaks(different kappa)) | 231.01 | 243.01 | 253.58 | 0.78 | 204.47 | 216.47 | 227.04 | -0.10 |
| ModelStimDist&3Peaks | 231.16 | 241.16 | 249.97 | 0.78 | 211.34 | 221.34 | 230.14 | -0.29 |
| ModelStimDist&2PeaksV | 247.72 | 257.72 | 266.52 | 0.68 | 201.79 | 211.79 | 220.60 | -0.03 |
| ModelStimDist&2PeaksH | 247.43 | 257.43 | 266.12 | 0.68 | 192.94 | 202.94 | 211.74 | 0.16 |
| ModelStimDist&Uniform | 251.62 | 259.62 | 266.67 | 0.65 | 193.01 | 201.01 | 208.06 | 0.16 |
| Model4Peaks(same kappa) | 230.38 | 238.38 | 245.43 | 0.79 | 211.55 | 219.55 | 226.59 | -0.29 |
| Model3Peaks | 230.90 | 238.90 | 245.94 | 0.78 | 211.21 | 219.21 | 226.25 | -0.28 |
| ModelStimDist | 269.41 | 277.41 | 284.46 | -1.10 | 218.89 | 226.89 | 233.93 | -1.03 |
| [1] |
Adams, W. J., Graf, E. W., & Ernst, M. O. (2004). Experience can change the 'light-from-above' prior. Nature Neuroscience, 7(10), 1057-1058. https://doi.org/10.1038/nn1312
URL pmid: 15361877 |
| [2] |
Attneave, F. (1954). Some informational aspects of visual perception. Psychological Review, 61(3), 183. https://doi.org/10.1037/h0054663
URL pmid: 13167245 |
| [3] | Barlow, H. B. (1961). Possible principles underlying the transformation of sensory messages. Sensory Communication, 1(01), 217-233. |
| [4] |
Bobbert, M. F., Lemmens, M. V., & Groeneveld, M. J. (2023). Motion information plays only a secondary role in sex identification of walking persons in frontal view. Journal of Vision, 23(2), 11. https://doi.org/10.1167/jov.23.2.11
doi: 10.1167/jov.23.2.11 URL pmid: 36811887 |
| [5] |
Chalk, M., Seitz, A. R., & Seriès, P. (2010). Rapidly learned stimulus expectations alter perception of motion. Journal of Vision, 10(8), 2. https://doi.org/10.1167/10.8.2
doi: 10.1167/10.8.2 URL pmid: 20884577 |
| [6] |
Chen, C., & Mitsudo, H. (2023). The gender-based facing bias in 3-D biological motion perception. Perception, 52(3), 183-194. https://doi.org/10.1177/03010066221145320
doi: 10.1177/03010066221145320 URL |
| [7] |
Chen, C., & Mitsudo, H. (2023). The gender-based facing bias in 3-D biological motion perception. Perception, 52(3), 183-194. https://doi.org/10.1177/03010066221145320
doi: 10.1177/03010066221145320 URL |
| [8] |
Crane, B. T. (2012). Direction specific biases in human visual and vestibular heading perception. PLoS One, 7(12), e51383. https://doi.org/10.1371/journal.pone.0051383
doi: 10.1371/journal.pone.0051383 URL |
| [9] |
Cuturi, L. F., & MacNeilage, P. R. (2013). Systematic biases in human heading estimation. PLoS One, 8(2), e56862. https://doi.org/10.1371/journal.pone.0056862
doi: 10.1371/journal.pone.0056862 URL |
| [10] |
De Gardelle, V., Kouider, S., & Sackur, J. (2010). An oblique illusion modulated by visibility: Non-monotonic sensory integration in orientation processing. Journal of vision, 10(10), 6. https://doi.org/10.1167/10.10.6
doi: 10.1167/10.10.6 URL pmid: 20884471 |
| [11] |
Dittrich, W. H., Troscianko, T., Lea, S. E., & Morgan, D. (1996). Perception of emotion from dynamic point-light displays represented in dance. Perception, 25, 727-738. https://doi.org/10.1068/p250
URL pmid: 8888304 |
| [12] |
Etcoff, N. L., & Magee, J. J. (1992). Categorical perception of facial expressions. Cognition, 44(3), 227-240. https://doi.org/10.1016/0010-0277(92)90002-Y
URL pmid: 1424493 |
| [13] | Gekas, N., Chalk, M., Seitz, A. R., & Seriès, P. (2013). Complexity and specificity of experimentally-induced expectations in motion perception. Journal of Vision, 13(4), 8. https://doi.org/10.1167/13.4.8 |
| [14] | Gibson, J. J. (1950). The perception of the visual world. Boston, MA: Houghton Mifflin |
| [15] |
Girshick, A. R., Landy, M. S., & Simoncelli, E. P. (2011). Cardinal rules: visual orientation perception reflects knowledge of environmental statistics. Nature Neuroscience, 14(7), 926-932. https://doi.org/10.1038/nn.2831
doi: 10.1038/nn.2831 URL pmid: 21642976 |
| [16] |
Gu, Y., Fetsch, C. R., Adeyemo, B., DeAngelis, G. C., & Angelaki, D. E. (2010). Decoding of MSTd population activity accounts for variations in the precision of heading perception. Neuron, 66(4), 596-609. DOI 10.1016/j.neuron.2010.04.026
pmid: 20510863 |
| [17] |
Hahn, M., & Wei, X. X. (2024). A unifying theory explains seemingly contradictory biases in perceptual estimation. Nature Neuroscience, 27(4), 793-804. https://doi.org/10.1038/s41593-024-01574-x
doi: 10.1038/s41593-024-01574-x URL |
| [18] | Harnad, S. (1987). Psychophysical and cognitive aspects of categorical perception. In S. Harnad (Ed.), Categorical perception: The groundwork of cognition. New York: Cambridge University Press. |
| [19] |
Jazayeri, M., & Shadlen, M. N. (2010). Temporal context calibrates interval timing. Nature Neuroscience, 13(8), 1020-1026. https://doi.org/10.1038/nn.2590
doi: 10.1038/nn.2590 URL pmid: 20581842 |
| [20] |
Johansson, G. (1973). Visual perception of biological motion and a model for its analysis. Perception & Psychophysics, 14(2), 201-211. https://doi.org/10.3758/BF03212378
doi: 10.3758/BF03212378 URL |
| [21] | Knill, D., C., & Richards, W. (Eds.). (1996). Perception as Bayesian inference. Cambridge University Press. |
| [22] |
Levari, D. E. (2022). Range-frequency effects can explain and eliminate prevalence-induced concept change. Cognition, 226, 105196. https://doi.org/10.1016/j.cognition.2022.105196
doi: 10.1016/j.cognition.2022.105196 URL |
| [23] |
Levari, D. E., Gilbert, D. T., Wilson, T. D., Sievers, B., Amodio, D. M., & Wheatley, T. (2018). Prevalence-induced concept change in human judgment. Science, 360(6396), 1465-1467. DOI: 10.1126/science.aap8731
pmid: 29954981 |
| [24] | Mamassian, P., Landy, M., & Maloney, L. T. (2002). Bayesian modelling of visual perception. In R. P. N. Rao, B. A. Olshausen, & M. S. Lewiciki (Eds.) Probabilistic Models of the Brain: Perception and Neural Function. (pp.13-36). Cambridge, MA: MIT Press. |
| [25] |
Mao, J., & Stocker, A. A. (2024). Sensory perception is a holistic inference process. Psychological Review. 131(4), 858-890. https://doi.org/10.1037/rev0000457
doi: 10.1037/rev0000457 URL pmid: 38358715 |
| [26] |
Montepare, J. M., & Zebrowitz-McArthur, L. (1988). Impressions of people created by age-related qualities of their gaits. Journal of Personality and Social Psychology, 55(4), 547-556. https://doi.org/10.1037/0022-3514.55.4.547
URL pmid: 3193347 |
| [27] |
Noel, J. P., Zhang, L. Q., Stocker, A. A., & Angelaki, D. E. (2021). Individuals with autism spectrum disorder have altered visual encoding capacity. PLoS Biology, 19(5), e3001215. https://doi.org/10.1371/journal.pbio.3001215
doi: 10.1371/journal.pbio.3001215 URL |
| [28] | Olkkonen, M., McCarthy, P. F., & Allred, S. R. (2014). The central tendency bias in color perception: Effects of internal and external noise. Journal of Vision, 14(11), 5. https://doi.org/10.1167/14.11.5 |
| [29] |
Orgs, G., Kirsch, L., & Haggard, P. (2013). Time perception during apparent biological motion reflects subjective speed of movement, not objective rate of visual stimulation. Experimental Brain Research, 227, 223-229. https://doi.org/10.1007/s00221-013-3502-8
doi: 10.1007/s00221-013-3502-8 URL pmid: 23588421 |
| [30] |
Peng, W., Cracco, E., Troje, N. F., & Brass, M. (2021). Does anxiety induced by social interaction influence the perception of bistable biological motion?. Acta Psychologica, 215, 103277. https://doi.org/10.1016/j.actpsy.2021.103277
doi: 10.1016/j.actpsy.2021.103277 URL |
| [31] |
Ran, P., Sun, M. Y., You, F. H., Zhang, X. Y., Sun, Q., & Sun, Q. (2025). Effects of global information on the estimation of point-light walker directions. Psychological Research, 89(1), 22. https://doi.org/10.1007/s00426-024-02061-5
doi: 10.1007/s00426-024-02061-5 URL |
| [32] |
Schouten, B., Davila, A., & Verfaillie, K. (2013). Further explorations of the facing bias in biological motion perception: perspective cues, observer sex, and response times. PLoS One, 8(2), e56978. https://doi.org/10.1371/journal.pone.0056978
doi: 10.1371/journal.pone.0056978 URL |
| [33] |
Schouten, B., Troje, N. F., Brooks, A., van der Zwan, R., & Verfaillie, K. (2010). The facing bias in biological motion perception: Effects of stimulus gender and observer sex. Attention, Perception, & Psychophysics, 72, 1256-1260. https://doi.org/10.3758/APP.72.5.1256
doi: 10.3758/APP.72.5.1256 URL |
| [34] |
Sotiropoulos, G., Seitz, A. R., & Seriès, P. (2014). Contrast dependency and prior expectations in human speed perception. Vision Research, 97, 16-23. https://doi.org/10.1016/j.visres.2014.01.012
doi: 10.1016/j.visres.2014.01.012 URL pmid: 24503425 |
| [35] |
Stocker, A. A., & Simoncelli, E. P. (2006). Noise characteristics and prior expectations in human visual speed perception. Nature Neuroscience, 9(4), 578-585. https://doi.org/10.1038/nn1669
doi: 10.1038/nn1669 URL pmid: 16547513 |
| [36] |
Stone, L. S., & Thompson, P. (1992). Human speed perception is contrast dependent. Vision Research, 32(8), 1535-1549. https://doi.org/10.1016/0042-6989(92)90209-2
doi: 10.1016/0042-6989(92)90209-2 URL pmid: 1455726 |
| [37] |
Sun, J., & Perona, P. (1998). Where is the sun?. Nature Neuroscience, 1(3), 183-184.
doi: 10.1038/630 pmid: 10195141 |
| [38] | Sun, Q., Dong, L. L., You, F. H., & Chang, D. H. (2025, in press). Estimations of biological motion walking direction are affected by observer and walker genders. BMC Psychology. |
| [39] |
Sun, Q., Gong, X. M., & Sun, Q. (2025). Impact of conflicts between long-and short-term priors on the weighted prior integration in visual perception. Cognition, 254, 106006. https://doi.org/10.1016/j.cognition.2024.106006
doi: 10.1016/j.cognition.2024.106006 URL |
| [40] |
Sun, Q., Gong, X. M., Zhan, L. Z., Wang, S. Y., & Dong, L. L. (2023). Serial dependence bias can predict the overall estimation error in visual perception. Journal of Vision, 23(13), 2. https://doi.org/10.1167/jov.23.13.2
doi: 10.1167/jov.23.13.2 URL pmid: 37917052 |
| [41] |
Sun, Q., Wang, J. Y., & Gong, X. M. (2024). Conflicts between short-and long-term experiences affect visual perception through modulating sensory or motor response systems: Evidence from Bayesian inference models. Cognition, 246, 105768. https://doi.org/10.1016/j.cognition.2024.105768
doi: 10.1016/j.cognition.2024.105768 URL |
| [42] | Sun, Q., Xu, L. H., & Stocker, A. A. (2024). A linear sensorimotor transformation accounts for response range-dependent biases in human heading estimation. bioRxiv, 2024-05. https://doi.org/10.1101/2024.05.15.594435 |
| [43] |
Sweeny, T. D., Haroz, S., & Whitney, D. (2012). Reference repulsion in the categorical perception of biological motion. Vision Research, 64, 26-34. https://doi.org/10.1016/j.visres.2012.05.008
doi: 10.1016/j.visres.2012.05.008 URL pmid: 22634421 |
| [44] |
Tomassini, A., Morgan, M. J., & Solomon, J. A. (2010). Orientation uncertainty reduces perceived obliquity. Vision Research, 50(5), 541-547. https://doi.org/10.1016/j.visres.2009.12.005
doi: 10.1016/j.visres.2009.12.005 URL pmid: 20005889 |
| [45] | Troje, N. F. (2002a). Decomposing biological motion: A framework for analysis and synthesis of human gait patterns. Journal of Vision, 2(5), 2. https://doi.org/10.1167/2.5.2 |
| [46] | Troje, N. F. (2002b). The little difference: Fourier based synthesis of gender-specific biological motion. Dynamic Perception, 115-120. |
| [47] |
Vanrie, J., Dekeyser, M., & Verfaillie, K. (2004). Bistability and biasing effects in the perception of ambiguous point-light walkers. Perception, 33(5), 547-560. https://doi.org/10.1068/p5004
URL pmid: 15250660 |
| [48] |
Weech, S., McAdam, M., Kenny, S., Troje, N. F.(2014) What causes the facing-the-viewer bias in biological motion?. Journal of Vision 14: 10. https://doi.org/10.1167/14.12.10
doi: 10.1167/14.12.10 URL pmid: 25761278 |
| [49] | Weech, S., & Troje, N. F. (2018). Inverting the facing-the-viewer bias for biological motion stimuli. i-Perception, 9(1), 2041669517750171. https://doi.org/10.1177/2041669517750171 |
| [50] | Wei, X. X., & Stocker, A. A. (2012). Efficient coding provides a direct link between prior and likelihood in perceptual Bayesian inference. Advances in Neural Information Processing Systems, 25. |
| [51] |
Wei, X. X., & Stocker, A. A. (2015). A Bayesian observer model constrained by efficient coding can explain'anti-Bayesian'percepts. Nature Neuroscience, 18(10), 1509-1517. https://doi.org/10.1038/nn.4105
doi: 10.1038/nn.4105 URL |
| [52] |
Wei, X. X., & Stocker, A. A. (2017). Lawful relation between perceptual bias and discriminability. Proceedings of the National Academy of Sciences, 114(38), 10244-10249. https://doi.org/10.1073/pnas.1619153114
doi: 10.1073/pnas.1619153114 URL |
| [53] | Xu, L. H., Sun, Q., Zhang, B., & Li, X. (2022). Attractive serial dependence in heading perception from optic flow occurs at the perceptual and postperceptual stages. Journal of Vision, 22(12), 11. https://doi.org/10.1167/jov.22.12.11 |
| [1] | WANG Jixian, LIU Minghui. The unconscious integration advantage of self-related information: Evidence from the subliminal same−different task paradigm [J]. Acta Psychologica Sinica, 2025, 57(9): 1609-1621. |
| [2] | LIAN Haomin, ZHANG Qian, GU Xuemin, LI Shouxin. Influence of Sustained Visual Attention on the Prioritization of Visual Working Memory [J]. Acta Psychologica Sinica, 2025, 57(2): 191-206. |
| [3] | FENG Biao, ZHANG Donghuan, CHEN Wei, ZENG Ling, WU Xiaoyue, HUANG Junling, ZHENG Xifu. Perceptual or conceptual? Modulation of fear generalization pathways by prior learning experience [J]. Acta Psychologica Sinica, 2025, 57(12): 2100-2115. |
| [4] | CAO Min, XIE Heping, SUN Lijun, ZHANG Dongjing, KONG Fanchang, ZHOU Zongkui. Processing priority for avatar reference in online games: Evidence from behavioral and ERPs studies [J]. Acta Psychologica Sinica, 2021, 53(6): 639-650. |
| [5] | Wumei LIU, Liang LEI, Zhiyuan LI, Yun SU, Xiaozhi HUANG. Touch or not touch? Prior touch facilitates consumers’ adoption of new products [J]. Acta Psychologica Sinica, 2018, 50(7): 782-792. |
| [6] | LIU Zhiying, KU Yixuan. Perceiving better, inhibiting better: Effects of perceptual precision on distractor-inhibition processes during working memory [J]. Acta Psychologica Sinica, 2017, 49(10): 1247-1255. |
| [7] | JIANG Cheng-Ming, LIU Hong-Zhi, CAI Xiao-Hong, LI Shu. A process test of priority models of intertemporal choice [J]. Acta Psychologica Sinica, 2016, 48(1): 59-72. |
| [8] | HUANG Zan, WANG Xinxin. Assortment Structure, Prior Knowledge and Brand Choice [J]. Acta Psychologica Sinica, 2015, 47(5): 663-678. |
| [9] | LIU Hong-Zhi, JIANG Cheng-Ming, RAO Li-Lin, LI Shu. Discounting or Priority: Which Rule Dominates the Intertemporal Choice Process? [J]. Acta Psychologica Sinica, 2015, 47(4): 522-532. |
| [10] | PAN Lu; QIAN Xiuying. Effects of Prior Outcomes on Risk-Preference in Dynamic Repeated Decision-Making [J]. Acta Psychologica Sinica, 2014, 46(12): 1860-1870. |
| [11] | ZHANG Bao, Huang Sai, HOU Qiuxia. The Priority of Color in Working-Memory-Driven Ocular Capture [J]. Acta Psychologica Sinica, 2014, 46(1): 17-26. |
| [12] | ZHOU Aibao;MA Xiaofeng;Li Jing;CUI Dan. The Advantage Effect of Retrieval Practice on Memory Retention and Transfer: Based on Explanation of Cognitive Load Theory [J]. Acta Psychologica Sinica, 2013, 45(8): 849-859. |
| [13] | YANG Hong-Sheng,WANG Fang,GU Nian-Jun,HUANG Xi-Ting. Processing Priority for Self-related Information: Evidence from Visual Search of Screen Names [J]. , 2012, 44(4): 489-497. |
| [14] | WANG Zuo-Jun,LI Shu. Tests of the Integrative Model and Priority Heuristic Model from the Point of View of Choice Process: Evidence from an Eye-tracking Study [J]. , 2012, 44(2): 179-198. |
| [15] | FANG Jie;ZHANG Min-Qiang. Assessing Point and Interval Estimation for the Mediating Effect: Distribution of the Product, Nonparametric Bootstrap and Markov Chain Monte Carlo Methods [J]. Acta Psychologica Sinica, 2012, 44(10): 1408-1420. |
| Viewed | ||||||
|
Full text |
|
|||||
|
Abstract |
|
|||||