

CN 11-1911/B


Acta Psychologica Sinica ›› 2024, Vol. 56 ›› Issue (7): 938-953.doi: 10.3724/SP.J.1041.2024.00938
• Special issue: Exploring cultural and psychological transformations in Chinese society • Previous Articles Next Articles
Received:2022-09-01
Published:2024-07-25
Online:2024-05-21
Contact:
LUO Siyang
E-mail:luosy6@mail.sysu.edu.cn
Supported by:YUAN Hang, LUO Siyang. (2024). Representation similarity analysis − A new perspective to study sociocultural change: Taking the mental health of elderly people as an example*. Acta Psychologica Sinica, 56(7), 938-953.
Add to citation manager EndNote|Ris|BibTeX
URL: https://journal.psych.ac.cn/acps/EN/10.3724/SP.J.1041.2024.00938

Figure 1. Differences between simple correlation analysis and representational similarity analysis: (A) Suppose that the variables X and Y are two psychological variables, each containing five dimensions (X: X1, X2, X3, X4, X5; Y: Y1, Y2, Y3, Y4, Y5). Traditional social change studies focus on the change trend of variable X over time, or the covariation trend of variables X and Y over time or the causality relationship, usually focusing on the change characteristics of the unidimensional characteristics of variables (such as the mean value of X or X1). The RSA matrix reflects the relationship of each logarithm of variable X in 5 dimensions, and provides information about the global pattern of variable X. The comparison of the RSA matrix of variable X and Y is a comparison of the pattern similarity of the two variables. (B) Based on linear correlation analysis, it can be concluded that X and Y have a significant correlation (r = 0.91*), but based on RSA analysis, it is found that there is no similarity between X and Y in the pattern (r = 0.63). (*p < 0.05)

Figure 2. Construction of representational similarity model in social change research: RSA matrix can be constructed from mental-space dimension (such as different dimensions under a certain psychological variable), time dimension (such as the level of a certain psychological variable at different time points) and spatial dimension (such as the level of a certain psychological variable in different provinces).

Figure 3. Construction process of the similarity matrix (national scale) representing changes in the loneliness level of the elderly: the difference between the loneliness level of the elderly in eight years was calculated, and the difference value was normalized as the similarity score. Each cell in the 8×8 matrix represents the similarity of the loneliness level in every two years.

Figure 4. Construction process of the representation similarity matrix (national scale) of the changes in mental health patterns of the elderly: In eight years from 1998 to 2018, we normalized the score difference between the two pairs of seven mental health items, and each 8×8 matrix represented the similarity of the relationship between the 7 mental health items in each year. Then, the mental health similarity matrix of each year was vectorized and compared in pairs. Pearson correlation coefficient was used to represent the similarity between the two vectors. Pearson correlation coefficient of 28 pairs of years represented the similarity of the relationship model of mental health items between eight years.

Figure 5. RSA matrix of changes in the cognitive function level of the elderly (regional scale) : Each cell of the 8×8 matrix represents the difference between the relationship modes of six cognitive function topics of the elderly in each province between two years, and the matrix as a whole represents the changes in the cognitive function structure of the elderly in the time dimension of the province.

Figure 6. Cross-regional RSA matrix of the mental health level of the elderly (national scale) : Each cell of the 21×21 matrix represents the similarity of the change patterns of the relationship between mental health issues in each of the two provinces from 1998 to 2018, and the matrix as a whole represents the similarity of the change patterns of mental health among the 21 regions.

Figure 7. Representation similarity matrix of mental health patterns of the elderly in 22 provinces by year (national scale) : Each 21×21 matrix represents the similarity of mental health model between 21 regions in each year, and each cell of the matrix represents the similarity of mental health model matrix between each two provinces in a certain year.

Figure 8. Representation similarity matrix of conceptual model. Left: China’s “Five-Year Plan” transition matrix, each cell in the 8×8 matrix represents the similarity of China’s “Five-Year Plan” cycle in each two years; Medium: Rice planting area distribution matrix, each cell in the 21×21 matrix represents the similarity of rice planting area in each two provinces; Right: Cultural tightness concept matrix, each cell in the 21×21 matrix represents the similarity between the culture (loose/tight) of each of the two provinces.

Figure 9. Comparison of representational similarity models in social change studies: There are many forms of matrix comparison, We can compare the representational similarity between one-dimensional variables (such as the comparison of the national mental health pattern matrix of the elderly in 1998 and 2018 in the mental space dimension), multidimensional variables (such as the comparison of the national mental health change pattern matrix and the cognitive function change pattern matrix in the time dimension), and different scales. Such as country-region scale (such as Beijing and the national elderly mental health change model), national-conceptual scale (such as the national elderly mental health inter-region model and the “The Rice Theory” conceptual model).

Figure 10. Correlation between the change pattern of mental health of the elderly in 22 provinces and the overall change pattern of mental health of the elderly in China (schematic diagram).

Figure 11. Representational similarity value (r) between the mental health change pattern of the elderly in 22 provinces and the overall mental health change pattern of the elderly in China.
| Province | r | Pearson correlation | Mantel test |
|---|---|---|---|
| p | p | ||
| Shaanxi | 0.94 | <0.001*** | 0.005** |
| Fujian | 0.95 | <0.001*** | 0.003** |
| Guangdong | 0.87 | <0.001*** | 0.070 |
| Jiangsu | 0.81 | <0.001*** | <0.001*** |
| Shandong | 0.50 | 0.007** | 0.060 |
| Zhejiang | 0.43 | 0.022* | 0.011* |
| Jilin | 0.34 | 0.073 | 0.131 |
| Tianjin | 0.32 | 0.095 | 0.137 |
| Chongqing | 0.26 | 0.180 | 0.128 |
| Guangxi | 0.24 | 0.221 | 0.151 |
| Liaoning | 0.21 | 0.286 | 0.130 |
| Hunna | 0.21 | 0.294 | 0.168 |
| Hebei | 0.15 | 0.455 | 0.157 |
| Jiangxi | 0.06 | 0.751 | 0.204 |
| Hubei | 0.04 | 0.835 | 0.188 |
| Sichuan | ?0.04 | 0.839 | 0.375 |
| Heilongjiang | ?0.06 | 0.764 | 0.337 |
| Henna | ?0.07 | 0.709 | 0.397 |
| Beijing | ?0.12 | 0.548 | 0.533 |
| Anhui | ?0.13 | 0.506 | 0.483 |
| Shanghai | ?0.17 | 0.378 | 0.719 |
| Shanxi | ?0.24 | 0.228 | 0.937 |
Table 1 The representational similarity value (r) between the mental health change pattern of the elderly in 22 provinces and the overall change pattern of the mental health of the elderly in China.
| Province | r | Pearson correlation | Mantel test |
|---|---|---|---|
| p | p | ||
| Shaanxi | 0.94 | <0.001*** | 0.005** |
| Fujian | 0.95 | <0.001*** | 0.003** |
| Guangdong | 0.87 | <0.001*** | 0.070 |
| Jiangsu | 0.81 | <0.001*** | <0.001*** |
| Shandong | 0.50 | 0.007** | 0.060 |
| Zhejiang | 0.43 | 0.022* | 0.011* |
| Jilin | 0.34 | 0.073 | 0.131 |
| Tianjin | 0.32 | 0.095 | 0.137 |
| Chongqing | 0.26 | 0.180 | 0.128 |
| Guangxi | 0.24 | 0.221 | 0.151 |
| Liaoning | 0.21 | 0.286 | 0.130 |
| Hunna | 0.21 | 0.294 | 0.168 |
| Hebei | 0.15 | 0.455 | 0.157 |
| Jiangxi | 0.06 | 0.751 | 0.204 |
| Hubei | 0.04 | 0.835 | 0.188 |
| Sichuan | ?0.04 | 0.839 | 0.375 |
| Heilongjiang | ?0.06 | 0.764 | 0.337 |
| Henna | ?0.07 | 0.709 | 0.397 |
| Beijing | ?0.12 | 0.548 | 0.533 |
| Anhui | ?0.13 | 0.506 | 0.483 |
| Shanghai | ?0.17 | 0.378 | 0.719 |
| Shanxi | ?0.24 | 0.228 | 0.937 |
| Variables | M | SD | 1 | |
|---|---|---|---|---|
| 1 | representational similarity values (r) | 0.44 | 0.25 | |
| 2 | GDP (average from 1998 to 2018) | 14817.76 | 9197.24 | 0.46* |
| 3 | CPI (average from 1998 to 2018) | 101.98 | 0.33 | ?0.28 |
| 4 | Number of health facilities (average from 1998 to 2018) | 21444.35 | 11708.51 | 0.06 |
| 5 | Population coverage rate of radio and TV programs (average from 1998 to 2018) | 96.03 | 3.11 | 0.04 |
| 6 | PM2.5 (average from 1998 to 2018) | 52.62 | 14.20 | ?0.29 |
Table 2 Correlation of representational similarity values between social, economic and cultural level and the mental health change pattern of the elderly in 22 provinces and the overall mental health change pattern of the elderly in China
| Variables | M | SD | 1 | |
|---|---|---|---|---|
| 1 | representational similarity values (r) | 0.44 | 0.25 | |
| 2 | GDP (average from 1998 to 2018) | 14817.76 | 9197.24 | 0.46* |
| 3 | CPI (average from 1998 to 2018) | 101.98 | 0.33 | ?0.28 |
| 4 | Number of health facilities (average from 1998 to 2018) | 21444.35 | 11708.51 | 0.06 |
| 5 | Population coverage rate of radio and TV programs (average from 1998 to 2018) | 96.03 | 3.11 | 0.04 |
| 6 | PM2.5 (average from 1998 to 2018) | 52.62 | 14.20 | ?0.29 |

Figure 12. Correlation of representational similarity values between GDP level and the mental health change patterns of the elderly in 22 provinces and the overall mental health change patterns of the elderly in China.

Figure 13. The representational similarity between the mental health change model and cognitive function change model of the elderly and the conceptual models of national policies, natural environment and social theory (schematic diagram).
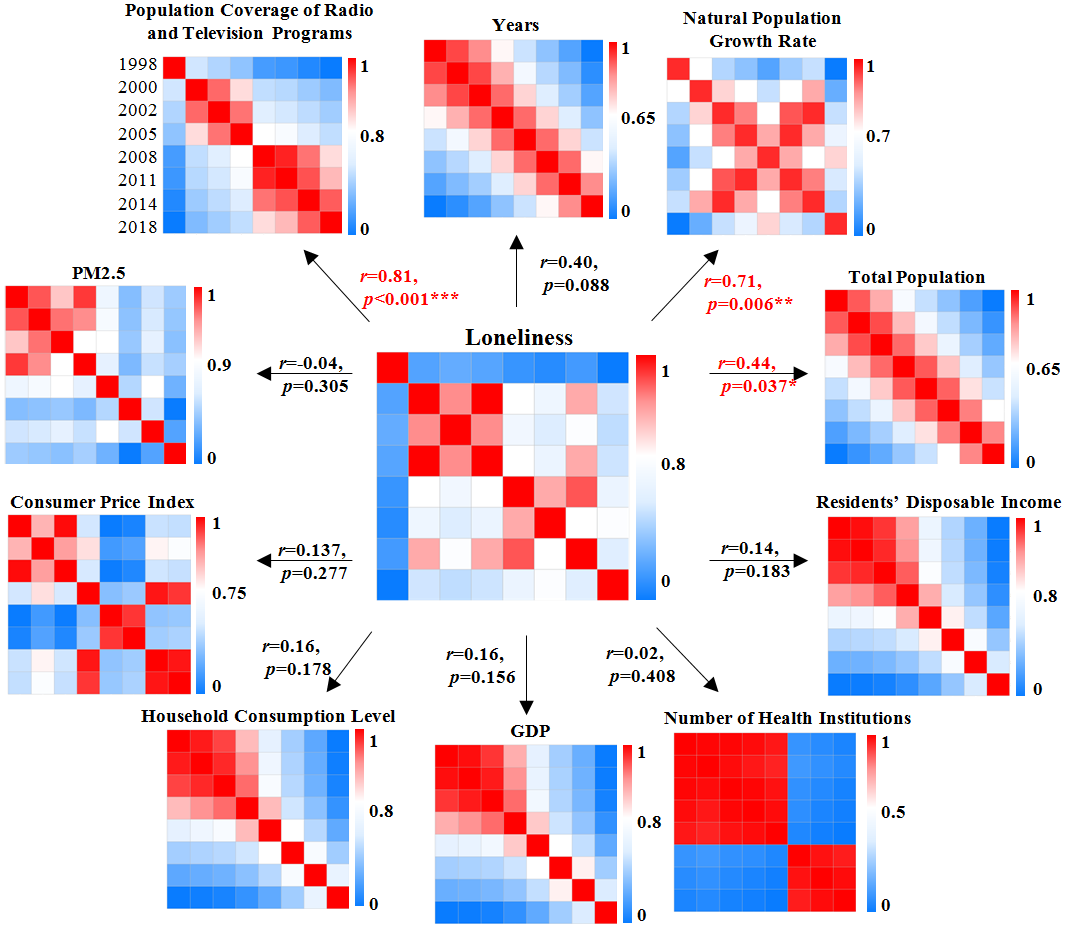
Figure S1. The similarity between changes in elderly’s loneliness and changes in socioeconomic and cultural indicators. (*p <.05, ** p <.01, *** p <.001)
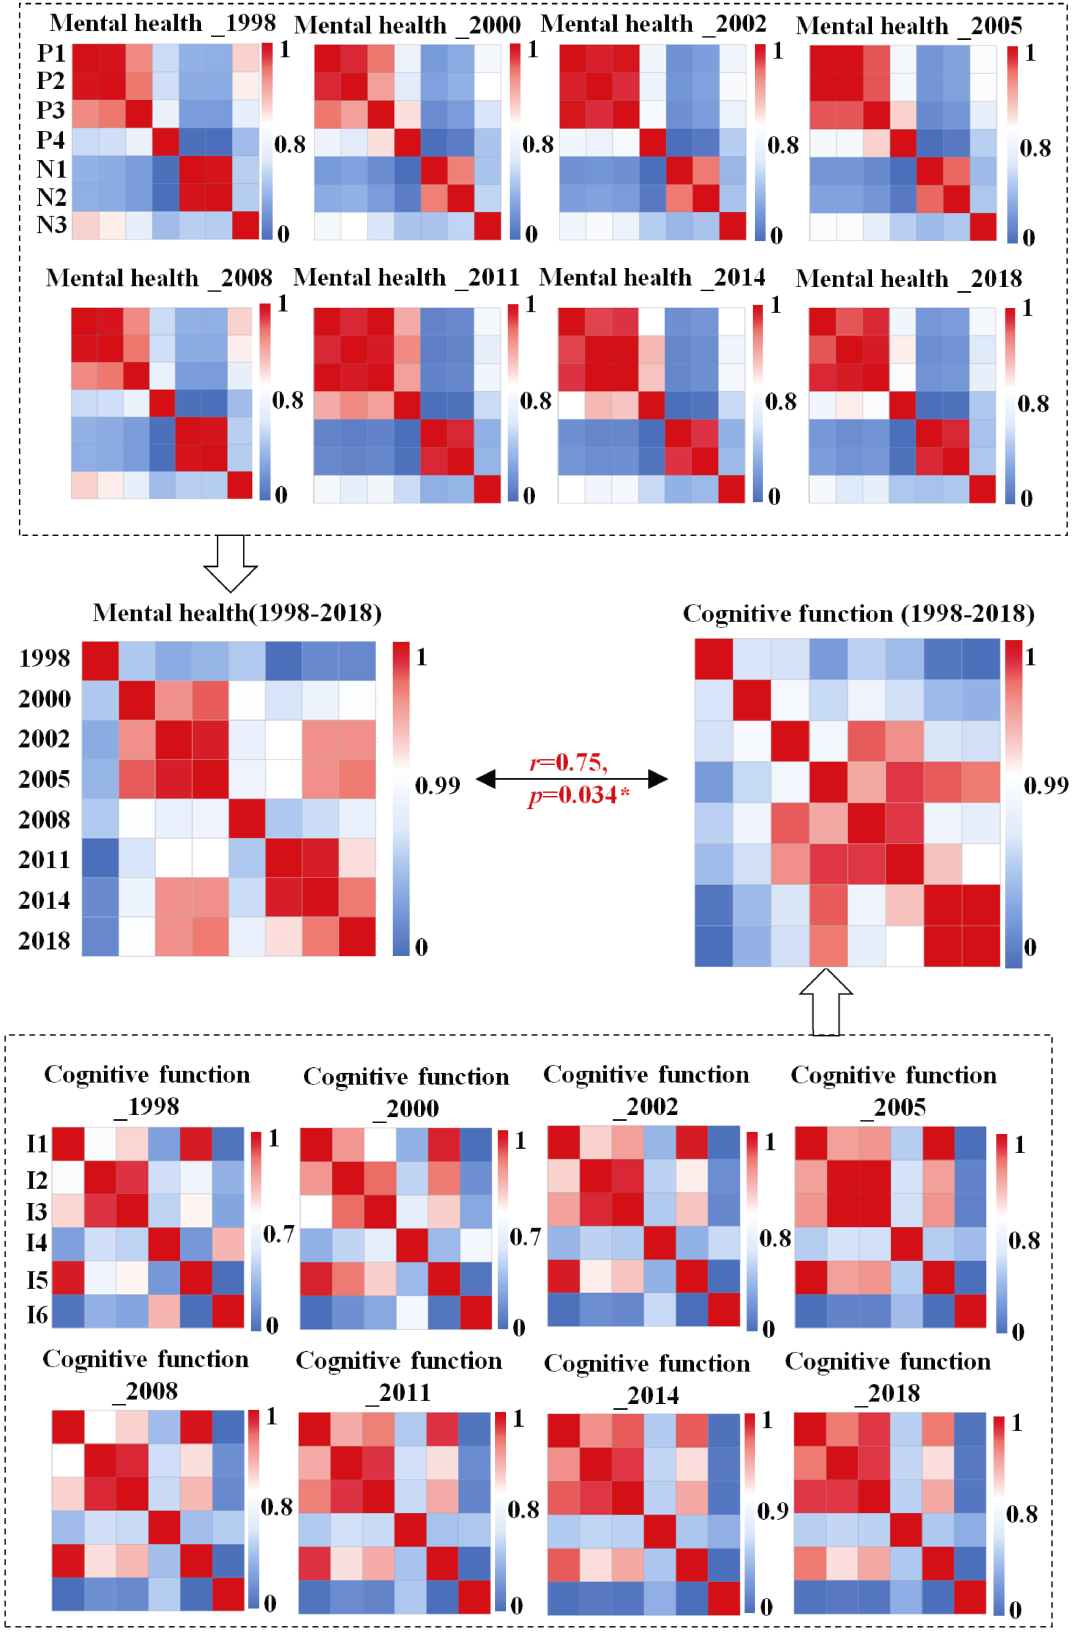
Figure S2. Representational similarity of changes in mental health pattern (total level) and cognitive function pattern (total level) in the elderly (*p <.05, ** p <.01, *** p <.001)
| 1 | 2 | ||||||
|---|---|---|---|---|---|---|---|
| Mantel test | Pearson correlation | Mantel test | Pearson correlation | ||||
| r | p | p | r | p | p | ||
| 1 | Mental health change (total level) | 1 | |||||
| 2 | Cognition function change (total level) | 0.73 | <0.001*** | <0.001*** | 1 | ||
| 3 | GDP | ?0.01 | 0.321 | 0.954 | 0.29 | 0.144 | 0.135 |
| 4 | CPI | 0.11 | 0.289 | 0.574 | 0.12 | 0.285 | 0.534 |
| 5 | Number of health facilities | 0.07 | 0.385 | 0.741 | 0.12 | 0.179 | 0.665 |
| 6 | Overall population coverage of radio and television programs | 0.69 | 0.033* | <0.001*** | 0.83 | 0.002** | <0.001*** |
| 7 | Per capita disposal income | ?0.03 | 0.317 | 0.885 | 0.95 | 0.147 | 0.205 |
| 8 | Resident consumption level | 0.01 | 0.300 | 0.976 | 0.31 | 0.144 | 0.103 |
| 9 | Natural population growth rate | 0.54 | 0.090 | 0.003** | 0.66 | 0.006** | <0.001*** |
| 10 | Total population | 0.29 | 0.144 | 0.131 | 0.63 | 0.004** | <0.001*** |
| 11 | PM2.5 | ?0.15 | 0.531 | 0.419 | ?0.15 | 0.592 | 0.454 |
| 12 | Year | 0.24 | 0.146 | 0.211 | 0.58 | 0.008** | 0.001** |
Table S1 The representation similarity between socioeconomic and cultural change indicators and changes in mental health pattern (total level) and cognitive function pattern (total level) of the elderly
| 1 | 2 | ||||||
|---|---|---|---|---|---|---|---|
| Mantel test | Pearson correlation | Mantel test | Pearson correlation | ||||
| r | p | p | r | p | p | ||
| 1 | Mental health change (total level) | 1 | |||||
| 2 | Cognition function change (total level) | 0.73 | <0.001*** | <0.001*** | 1 | ||
| 3 | GDP | ?0.01 | 0.321 | 0.954 | 0.29 | 0.144 | 0.135 |
| 4 | CPI | 0.11 | 0.289 | 0.574 | 0.12 | 0.285 | 0.534 |
| 5 | Number of health facilities | 0.07 | 0.385 | 0.741 | 0.12 | 0.179 | 0.665 |
| 6 | Overall population coverage of radio and television programs | 0.69 | 0.033* | <0.001*** | 0.83 | 0.002** | <0.001*** |
| 7 | Per capita disposal income | ?0.03 | 0.317 | 0.885 | 0.95 | 0.147 | 0.205 |
| 8 | Resident consumption level | 0.01 | 0.300 | 0.976 | 0.31 | 0.144 | 0.103 |
| 9 | Natural population growth rate | 0.54 | 0.090 | 0.003** | 0.66 | 0.006** | <0.001*** |
| 10 | Total population | 0.29 | 0.144 | 0.131 | 0.63 | 0.004** | <0.001*** |
| 11 | PM2.5 | ?0.15 | 0.531 | 0.419 | ?0.15 | 0.592 | 0.454 |
| 12 | Year | 0.24 | 0.146 | 0.211 | 0.58 | 0.008** | 0.001** |
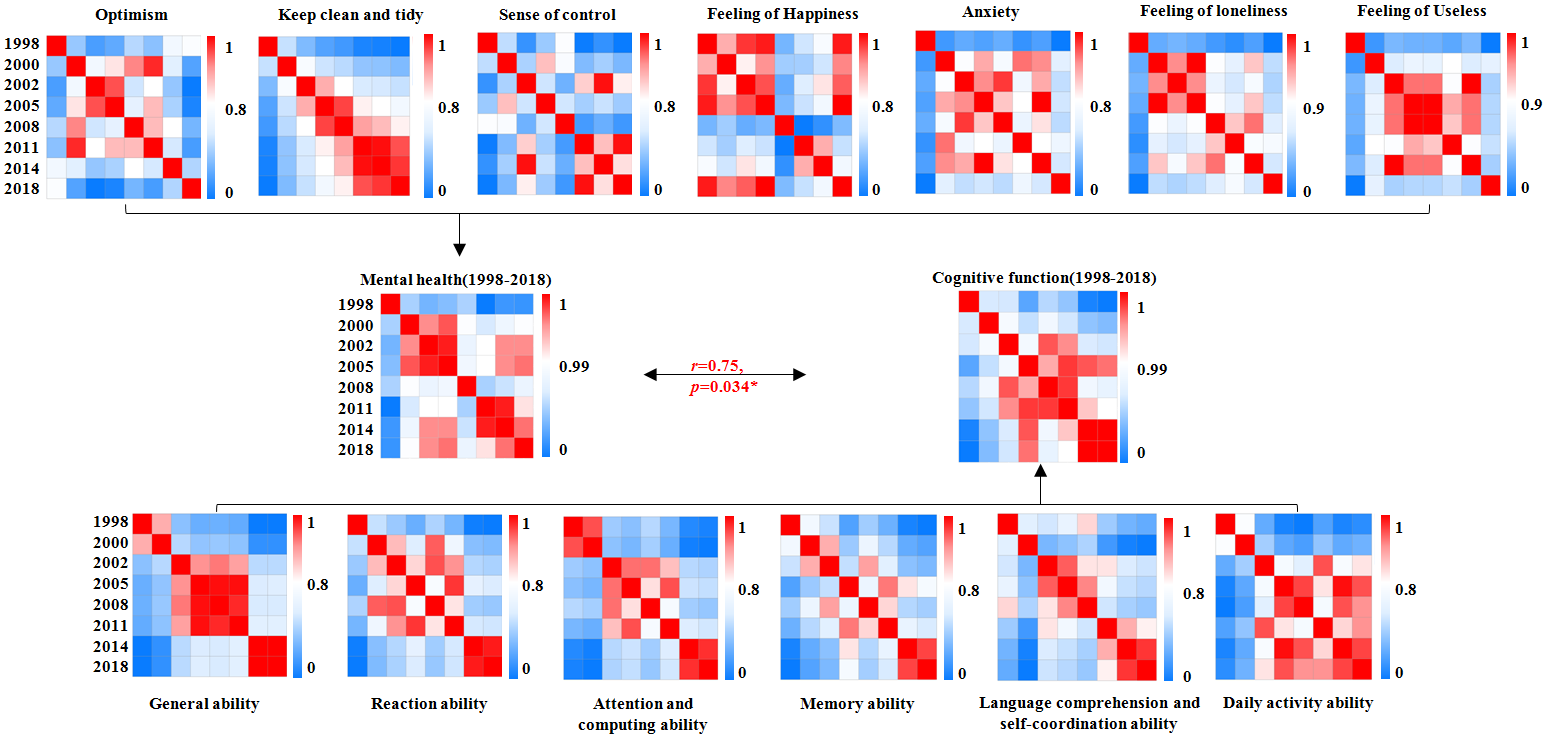
Figure S3. Representational similarity of mental health change pattern (total level) and cognitive function change pattern (total level) in the elderly. (*p < 0.05, **p < 0.01, ***p < 0.001)
| canonical variable | canonical correlation coefficient | Wilk value | F | p |
|---|---|---|---|---|
| 1 | 0.972 | 0.001 | 5.273 | <0.001*** |
| 2 | 0.930 | 0.027 | 3.208 | <0.001*** |
| 3 | 0.768 | 0.204 | 1.764 | 0.049* |
| 4 | 0.599 | 0.497 | 1.207 | 0.306 |
| 5 | 0.376 | 0.775 | 0.859 | 0.534 |
| 6 | 0.311 | 0.903 | . | . |
Table S2 Canonical correlation analysis between mental health changes and cognitive function changes in the elderly
| canonical variable | canonical correlation coefficient | Wilk value | F | p |
|---|---|---|---|---|
| 1 | 0.972 | 0.001 | 5.273 | <0.001*** |
| 2 | 0.930 | 0.027 | 3.208 | <0.001*** |
| 3 | 0.768 | 0.204 | 1.764 | 0.049* |
| 4 | 0.599 | 0.497 | 1.207 | 0.306 |
| 5 | 0.376 | 0.775 | 0.859 | 0.534 |
| 6 | 0.311 | 0.903 | . | . |
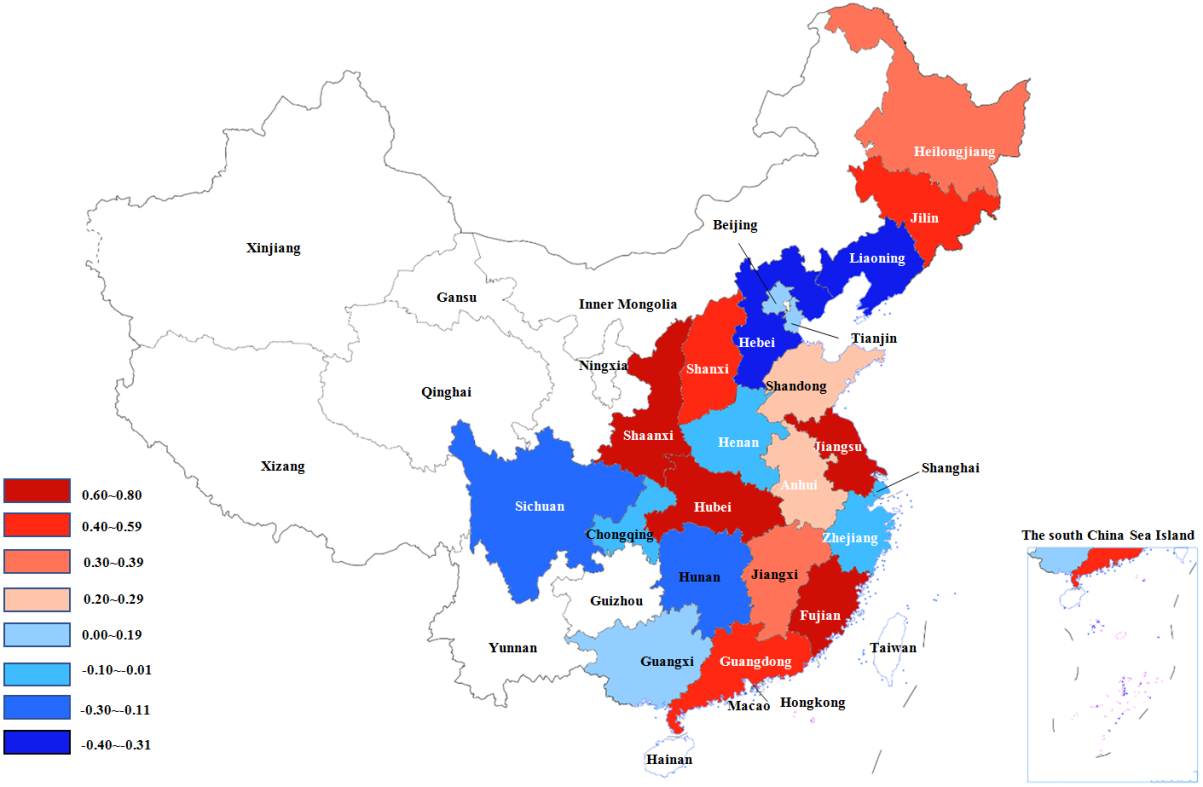
Figure S5. Representational similarity value (r) between the mental health change pattern and cognitive function change pattern of the elderly in 22 provinces.
| province | r | Pearson correlation | Mantel test |
|---|---|---|---|
| p | p | ||
| Shaanxi | 0.76 | <0.001*** | 0.006** |
| Jiangsu | 0.68 | <0.001*** | 0.028* |
| Hebei | 0.64 | <0.001*** | 0.075 |
| Fujian | 0.61 | <0.001*** | 0.010* |
| Shanxi | 0.54 | 0.003** | 0.002** |
| Jilin | 0.52 | 0.005** | 0.010* |
| Guangdong | 0.43 | 0.022* | 0.145 |
| Heilongjiang | 0.35 | 0.192 | 0.174 |
| Jiangxi | 0.31 | 0.109 | 0.099 |
| Shandong | 0.21 | 0.286 | 0.213 |
| Anhui | 0.2 | 0.299 | 0.211 |
| Tianjin | 0.16 | 0.404 | 0.180 |
| Guangxi | 0.11 | 0.578 | 0.301 |
| Beijing | 0.08 | 0.672 | 0.275 |
| Shanghai | ?0.04 | 0.864 | 0.473 |
| Zhejiang | ?0.04 | 0.834 | 0.526 |
| Henan | ?0.07 | 0.727 | 0.364 |
| Chongqing | ?0.10 | 0.603 | 0.439 |
| Hunan | ?0.15 | 0.442 | 0.747 |
| Sichuan | ?0.23 | 0.24 | 0.864 |
| Liaoning | ?0.34 | 0.079 | 0.942 |
| Hebei | ?0.37 | 0.054 | 0.988 |
Table S3 Representative similarity value (r) between mental health change patterns and cognitive function change patterns of the elderly in 22 provinces
| province | r | Pearson correlation | Mantel test |
|---|---|---|---|
| p | p | ||
| Shaanxi | 0.76 | <0.001*** | 0.006** |
| Jiangsu | 0.68 | <0.001*** | 0.028* |
| Hebei | 0.64 | <0.001*** | 0.075 |
| Fujian | 0.61 | <0.001*** | 0.010* |
| Shanxi | 0.54 | 0.003** | 0.002** |
| Jilin | 0.52 | 0.005** | 0.010* |
| Guangdong | 0.43 | 0.022* | 0.145 |
| Heilongjiang | 0.35 | 0.192 | 0.174 |
| Jiangxi | 0.31 | 0.109 | 0.099 |
| Shandong | 0.21 | 0.286 | 0.213 |
| Anhui | 0.2 | 0.299 | 0.211 |
| Tianjin | 0.16 | 0.404 | 0.180 |
| Guangxi | 0.11 | 0.578 | 0.301 |
| Beijing | 0.08 | 0.672 | 0.275 |
| Shanghai | ?0.04 | 0.864 | 0.473 |
| Zhejiang | ?0.04 | 0.834 | 0.526 |
| Henan | ?0.07 | 0.727 | 0.364 |
| Chongqing | ?0.10 | 0.603 | 0.439 |
| Hunan | ?0.15 | 0.442 | 0.747 |
| Sichuan | ?0.23 | 0.24 | 0.864 |
| Liaoning | ?0.34 | 0.079 | 0.942 |
| Hebei | ?0.37 | 0.054 | 0.988 |
| M | SD | 1 | ||
|---|---|---|---|---|
| 1 | representational similarity value (r) | 0.19 | 0.34 | |
| 2 | GDP (average from 1998 to 2018) | 14817.76 | 9197.24 | 0.12 |
| 3 | population coverage rate of radio and TV programs (average from 1998 to 2018) | 96.03 | 3.11 | 0.24 |
| 4 | PM2.5(average from 1998 to 2018) | 52.62 | 14.20 | ?0.02 |
Table S4 Correlation between socio-economic, cultural, and natural change indicators and the representational similarity values of changes in mental health patterns and cognitive function patterns of the elderly in each province
| M | SD | 1 | ||
|---|---|---|---|---|
| 1 | representational similarity value (r) | 0.19 | 0.34 | |
| 2 | GDP (average from 1998 to 2018) | 14817.76 | 9197.24 | 0.12 |
| 3 | population coverage rate of radio and TV programs (average from 1998 to 2018) | 96.03 | 3.11 | 0.24 |
| 4 | PM2.5(average from 1998 to 2018) | 52.62 | 14.20 | ?0.02 |
| Predictor | B | SE | t | p | 95% CI | |
|---|---|---|---|---|---|---|
| LL | UL | |||||
| (Intercept) | 0.71 | 0.05 | 15.07 | <0.001*** | 1.86 | 2.23 |
| mental health change | 0.25 | 0.05 | 5.03 | <0.001*** | 1.16 | 1.41 |
| GDP change | ?0.02 | 0.01 | ?2.96 | 0.003** | 0.96 | 0.99 |
| population coverage of radio and TV programs change | ?0.005 | 0.002 | ?2.55 | 0.011* | 0.992 | 0.999 |
Table S5 The moderating effects of socio-economic, cultural, and natural change indicators on the representational similarity of changes in mental health patterns and cognitive function patterns of the elderly in each province
| Predictor | B | SE | t | p | 95% CI | |
|---|---|---|---|---|---|---|
| LL | UL | |||||
| (Intercept) | 0.71 | 0.05 | 15.07 | <0.001*** | 1.86 | 2.23 |
| mental health change | 0.25 | 0.05 | 5.03 | <0.001*** | 1.16 | 1.41 |
| GDP change | ?0.02 | 0.01 | ?2.96 | 0.003** | 0.96 | 0.99 |
| population coverage of radio and TV programs change | ?0.005 | 0.002 | ?2.55 | 0.011* | 0.992 | 0.999 |
| Predictor | B | SE | t | p | 95% CI | |
|---|---|---|---|---|---|---|
| LL | UL | |||||
| (Intercept) | 0.97 | 0.03 | 38.26 | <0.001*** | 0.92 | 1.01 |
| mental health change | 0.02 | 0.03 | 0.87 | 0.382 | ?0.03 | 0.07 |
| CPI change | ?0.01 | 0.003 | ?2.73 | 0.006** | ?0.01 | ?0.002 |
| Residents Consumption Level change | ?0.13 | 0.05 | ?2.60 | 0.010* | ?0.23 | ?0.03 |
| mental health change × Residents Consumption Level change | 0.13 | 0.05 | 2.49 | 0.013* | 0.03 | 0.23 |
Table S6 The moderating effect of social and economic changes on the representational similarity between the mental health change patterns of the elderly in 22 provinces and the whole country mental health change patterns of the elderly
| Predictor | B | SE | t | p | 95% CI | |
|---|---|---|---|---|---|---|
| LL | UL | |||||
| (Intercept) | 0.97 | 0.03 | 38.26 | <0.001*** | 0.92 | 1.01 |
| mental health change | 0.02 | 0.03 | 0.87 | 0.382 | ?0.03 | 0.07 |
| CPI change | ?0.01 | 0.003 | ?2.73 | 0.006** | ?0.01 | ?0.002 |
| Residents Consumption Level change | ?0.13 | 0.05 | ?2.60 | 0.010* | ?0.23 | ?0.03 |
| mental health change × Residents Consumption Level change | 0.13 | 0.05 | 2.49 | 0.013* | 0.03 | 0.23 |
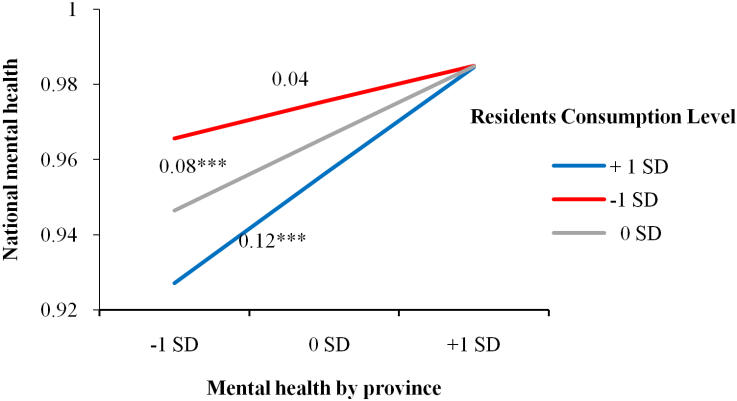
Figure S6. The moderating effect of the representational similarity model of changes in residents' consumption level on the representational similarity between national model and regional model of mental health change in the elderly. (*p < 0.05, ** p < 0.01, *** p < 0.001)
| Year | r | Pearson correlation | Mantel test |
|---|---|---|---|
| p | p | ||
| 2002 | 0.40 | <0.001*** | 0.011* |
| 2000 | 0.25 | <0.001*** | 0.108 |
| 2011 | 0.24 | <0.001*** | 0.054 |
| 2018 | 0.24 | <0.001*** | 0.239 |
| 2014 | 0.09 | 0.152 | 0.153 |
| 1998 | 0.02 | 0.765 | 0.39 |
| 2005 | 0.01 | 0.923 | 0.409 |
| 2008 | ?0.01 | 0.983 | 0.373 |
Table S7 Representational similarity values (r) between regional patterns of mental health and cognitive function of the elderly in different years
| Year | r | Pearson correlation | Mantel test |
|---|---|---|---|
| p | p | ||
| 2002 | 0.40 | <0.001*** | 0.011* |
| 2000 | 0.25 | <0.001*** | 0.108 |
| 2011 | 0.24 | <0.001*** | 0.054 |
| 2018 | 0.24 | <0.001*** | 0.239 |
| 2014 | 0.09 | 0.152 | 0.153 |
| 1998 | 0.02 | 0.765 | 0.39 |
| 2005 | 0.01 | 0.923 | 0.409 |
| 2008 | ?0.01 | 0.983 | 0.373 |
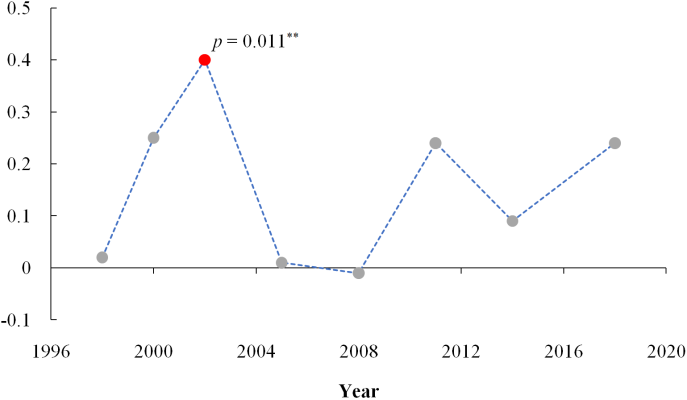
Figure S8. The variation trend of the representational similarity value (r) between regional patterns of mental health and cognitive function of the elderly in each year over time. (*p < 0.05, ** p < 0.01, *** p < 0.001)
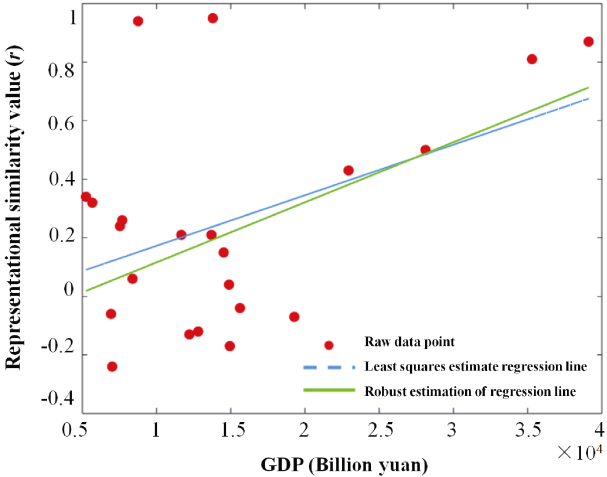
Figure S9. Regression equation fitting graph with GDP level as the independent variable and the representational similarity value (r) between the regional and the national mental health of the elderly as the dependent variable.
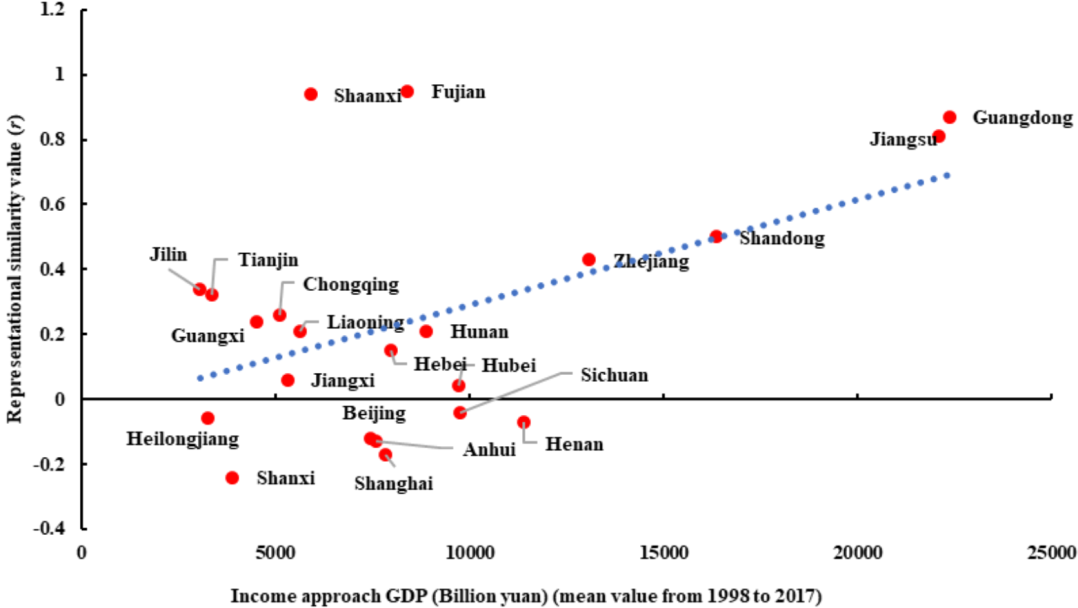
Figure S10. Correlation of income method GDP and the representative similarity values between regional and whole country mental health change patterns of the elderly.
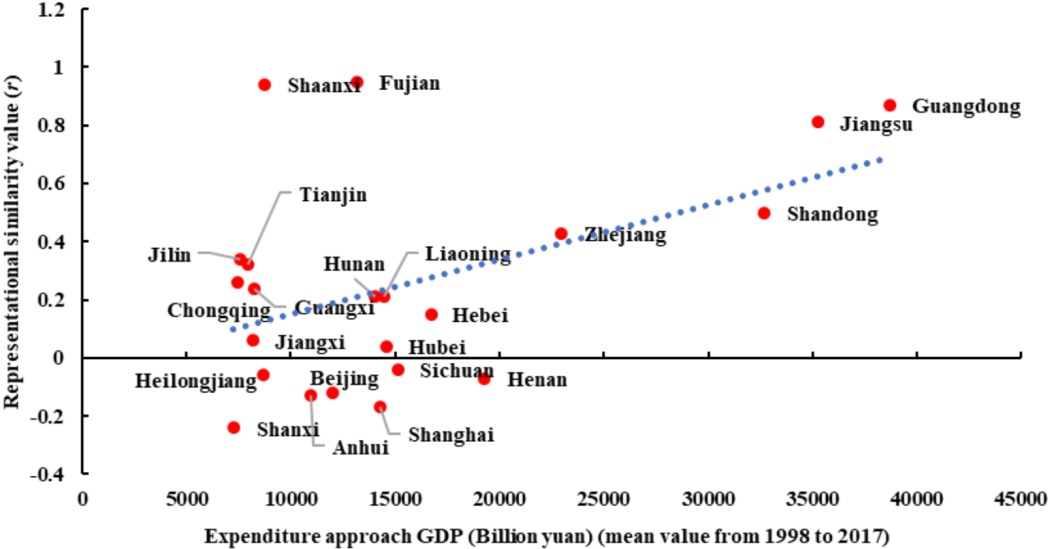
Figure S11. Correlation of expenditure method GDP and the representative similarity values between regional and whole country mental health change patterns of the elderly.
| [1] |
Cai H. J., Huang Z. H., Lin L., Zhang M. Y., Wang X. O., Zhu H. J.,... Jing Y. M. (2020). The psychological change of the Chinese people over the past half century: A literature review. Advances in Psychological Science, 28(10), 1599-1618.
doi: 10.3724/SP.J.1042.2020.01599 |
| [2] |
Cai H. J., Zhang M. Y., Bao H. W. S., Zhu H. J., Yang Z. Y., Cheng X.,... Wang Z. X. (2023). Examining societal change from the perspective of psychology: Research design and analytic techniques. Advances in Psychological Science, 31(2), 159-172.
doi: 10.3724/SP.J.1042.2023.00159 |
| [3] | Cai H. J., Zou X., Feng Y., Liu Y. Z., & Jing Y. M. (2018). Increasing need for uniqueness in contemporary China: Empirical evidence. Frontiers in Psychology, 9, doi: 10.3389/fpsyg.2018.00554 |
| [4] | Center for Healthy Aging and Development Studies. (2020). The Chinese Longitudinal Healthy Longevity Survey (CLHLS)-Longitudinal Data (1998-2018). Peking University Open Research Data Platform, V2 |
| [5] |
Chua R. Y. J., Huang K. G., & Jin M. (2019). Mapping cultural tightness and its links to innovation, urbanization, and happiness across 31 provinces in China. PNAS, 116(14), 6720-6725.
doi: 10.1073/pnas.1815723116 pmid: 30833399 |
| [6] | Deng W. Z. (2009). Sociological dictionary. Shanghai Lexicographical Publishing House. |
| [7] | Duan Q., Xu Z. C., Hu Q., & Luo S. Y. (2022). Neural variability fingerprint predicts individuals’ information security violation intentions. Fundamental Research, 2(2), 303-310. |
| [8] | Enke B. (2023). Market exposure and human morality. Nature Human Behaviour, 7(1), 134-141. |
| [9] |
Gelfand M. J., Nishii L. H., & Raver J. L. (2006). On the nature and importance of cultural tightness-looseness. Journal of Applied Psychology, 91(6), 1225-1244.
pmid: 17100480 |
| [10] |
Haxby J. V., Connolly A. C., & Guntupalli J. S. (2014). Decoding neural representational spaces using multivariate pattern analysis. Annual Review of Neuroscience, 37, 435-456.
doi: 10.1146/annurev-neuro-062012-170325 pmid: 25002277 |
| [11] | Huang G. L., Yu X. L., Long Q. Y., Huang L. Q., & Luo S. Y. (2022). The impact of economic freedom on COVID-19 pandemic control: The moderating role of equality. Globalization and Health, 18(1), 15. |
| [12] |
Huang L. Q., Sun Y., & Luo S. Y. (2022). The impact of individualism on the efficiency of epidemic control and the underlying computational and psychological mechanisms. Acta Psychologica Sinica, 54(5), 497-533.
doi: 10.3724/SP.J.1041.2022.00497 |
| [13] |
Jiang G. R., Li D. Y., Ren Z. H., Yan Y. P., Wu X. C., Zu X.,... Zhang. L. (2021). The status quo and characteristics of Chinese mental health literacy. Acta Psychologica Sinica, 53(2), 182-201.
doi: 10.3724/SP.J.1041.2021.00182 |
| [14] | Klein K. J., & Kozlowski S. W. J. (Eds.). ( 2000). Multilevel theory, research, and methods in organizations: Foundations, extensions, and new directions. Jossey-Bass/Wiley. |
| [15] |
Li L. M. W., Luo S. Y., Ma J. J., Lin Y., Fan L. L., Zhong S. Q.,... Wu X. (2018). Functional Connectivity Pattern Underlies Individual Differences in Independent Self-Construal. Social Cognitive and Affective Neuroscience, 13(3), 269-280.
doi: 10.1093/scan/nsy008 pmid: 29385622 |
| [16] | Liu Z. X. (2017). Transmission of Religious Affiliation across Generations: The case of Taiwan. Sociological Studies, 32(1), 193-216+246. |
| [17] | Luo S. Y., Li L. M. W., Espina E., Bond M. H., Lun V. M.-C., Huang L. Q.,... Liu J. H. (2023). Individual uniqueness in trust profiles and well-being: Understanding the role of cultural tightness-looseness from a representation similarity perspective. British Journal of Social Psychology, 62(2), 825-844. |
| [18] |
Luo S. Y., Ma Y. N., Liu Y., Li B. F., Wang C. B., Shi Z. H.,... Han S. H. (2015). Interaction between oxytocin receptor polymorphism and interdependent culture values on human empathy. Social Cognitive and Affective Neuroscience, 10(9), 1273-1281.
doi: 10.1093/scan/nsv019 pmid: 25680993 |
| [19] |
Luo S. Y., Zhang T., Li W. X., Yu M. H., Hein G., & Han S. H. (2019). Interactions between oxytocin receptor gene and intergroup relationship on empathic neural responses to others' pain. Social Cognitive and Affective Neuroscience, 14(5), 505-517.
doi: 10.1093/scan/nsz029 pmid: 31070227 |
| [20] |
Luo S. Y., Zhu Y. Y., Fan L. Y., Gao D. G., & Han S. H. (2020). Resting-state brain network properties mediate the association between the oxytocin receptor gene and interdependence. Social Neuroscience, 15(3), 296-310.
doi: 10.1080/17470919.2020.1714718 pmid: 31928145 |
| [21] |
Luo S. Y., Zhu Y. Y., & Han S. H. (2021). Functional Connectome Fingerprint of Holistic-analytic Cultural Style. Social Cognitive and Affective Neuroscience, 17(2), 172-186.
doi: 10.1093/scan/nsab080 pmid: 34160613 |
| [22] |
Mantel N. (1967). The detection of disease clustering and a generalized regression approach. Cancer Research, 27(2), 209-220.
pmid: 6018555 |
| [23] | Peng L., & Luo S. Y. (2021). Impact of social economic development on personality traits among Chinese college students: A cross-temporal meta-analysis, 2001-2016. Personality and Individual Differences, 171, 110461. |
| [24] |
Popal H., Wang Y., & Olson I. R. (2019). A Guide to Representational Similarity Analysis for Social Neuroscience. Social Cognitive and Affective Neuroscience, 14(11), 1243-1253.
doi: 10.1093/scan/nsz099 pmid: 31989169 |
| [25] | R Core Team. (2020). R: A language and environment for statistical computing. R Foundation for Statistical Computing. |
| [26] |
Talhelm T., Zhang X., Oishi S., Shimin C., Duan D., Lan X., & Kitayama S. (2014). Large-scale psychological differences within China explained by rice versus wheat agriculture. Science, 344(6184), 603-608.
doi: 10.1126/science.1246850 pmid: 24812395 |
| [27] | Tan H. X., Duan Q., Liu Y. H., Qiao X. Y., & Luo S. Y. (2022). Does losing money truly hurt? The shared neural bases of monetary loss and pain. Human Brain Mapping, 43(10), 3153-3163. |
| [28] | Twenge J. M. (1997). Attitudes Toward Women, 1970-1995: A Meta-Analysis. Psychology of Women Quarterly, 21(1), 35-51. |
| [29] | Xin Z. Q., & Chi L. P. (2008). Cross-temporal meta-analysis: Linking social change to psychological development. Journal of East China Normal University (Educational Sciences), 26(2), 44-51. |
| [30] | Yamawaki N. (2012). Within-Culture Variations of Collectivism in Japan. Journal of Cross-Cultural Psychology, 43(8), 1191-1204. |
| [31] | Yu F., Peng T., Peng K. P., Tang S., Chen C. S., Qian X. J.,... Chai F. Y. (2016). Cultural Value Shifting in Pronoun Use. Journal of Cross-Cultural Psychology, 47(2), 310-316. |
| [32] | Yu M. H., Huang L. L., Mao J. Q., Dna G., & Luo S. Y. (2022). Childhood maltreatment, automatic negative thoughts and resilience: The protective roles of culture and genes. Journal of Interpersonal Violence, 37(1-2). 349-370. |
| [33] | Yuan H., Long Q. Y., Huang G. L., Huang L. Q., & Luo S. Y. (2022). Different roles of interpersonal trust and institutional trust in COVID-19 pandemic control. Social Science & Medicine, 293, 114677. |
| [34] | Zhang J. J., Zhang H., & Feng X. H. (2023). The change of ethnic psychology from “view of otherness” to “view of the world”——Meta-ethnographic analysis from the perspective of interracial marriage. Journal of South China normal University (Social Science Edition), (2), 63-83. |
| [35] | Zhang J. R., Hua S. W., Ling H., & Tang Z. (2020). An Implicit Experimental Study of Intergenerational Differences in Work Values. Chinese Journal of Clinical Psychology, 28(4), 675-678+738. |
| [1] | HUANG Shunsen, LAI Xiaoxiong, ZHANG Cai, ZHAO Xinmei, DAI Xinran, QI Mengdi, WANG Huanlei, WANG Wenrong, WANG Yun. Relationship between adolescents’ smartphone stress and mental health: Based on the multiverse-style analysis and intensive longitudinal method [J]. Acta Psychologica Sinica, 2024, 56(6): 745-758. |
| [2] | HU Yiqiu, ZENG Zihao, PENG Liyi, WANG Hongcai, LIU Shuangjin, YANG Qin, FANG Xiaoyi. The effects of the parent-child relationship and parental educational involvement on adolescent depression, self-injury, and suicidal ideation: The roles of defeat and meaning in life [J]. Acta Psychologica Sinica, 2023, 55(1): 129-141. |
| [3] | GE Xiaoyu, HOU Yubo. Confucian ideal personality traits (Junzi personality) and mental health: The serial mediating roles of self-control and authenticity [J]. Acta Psychologica Sinica, 2021, 53(4): 374-386. |
| [4] | JIANG Guangrong, LI Danyang, REN Zhihong, YAN Yupeng, WU Xinchun, ZHU Xu, YU Lixia, XIA Mian, LI Fenglan, WEI Hui, ZHANG Yan, ZHAO Chunxiao, ZHANG Lin. The status quo and characteristics of Chinese mental health literacy [J]. Acta Psychologica Sinica, 2021, 53(2): 182-198. |
| [5] | REN Zhihong, ZHAO Chunxiao, TIAN Fan, YAN Yupeng, LI Danyang, ZHAO Ziyi, TAN Mengling, JIANG Guangrong. Meta-analysis of the effect of mental health literacy intervention in Chinese people [J]. Acta Psychologica Sinica, 2020, 52(4): 497-512. |
| [6] | HAN Yichu, WEN Hengfu, CHENG Shuhua, ZHANG Chungan, LI Xin. Relationship between perceived discrimination and mental health of migrant children: A meta-analysis of Chinese students [J]. Acta Psychologica Sinica, 2020, 52(11): 1313-1326. |
| [7] | YANG Ruijuan, YOU Xuqun. Advancing the Effort-Reward Imbalance Model: Economic rewards influence on teachers’ mental health [J]. Acta Psychologica Sinica, 2017, 49(9): 1184-1194. |
| [8] | ZHAO Mengxue; FENG Zhengzhi; WANG Yichao; LAI Wei; HU Feng; LIU Keyu; XIA Fan; JIANG Juan; WANG Jia; XIA Lei. Chinese military mental health at high altitude, 1993-2013: A cross-temporal meta-analysis of SCL-90 [J]. Acta Psychologica Sinica, 2017, 49(5): 653-662. |
| [9] | HUANG Silin, HOU Jiawei, ZHANG Mei, XIN Ziqiang, ZHANG Hongchuan, SUN Ling, DOU Donghui. A Cross-Temporal Meta-Analysis of Changes in Chinese Migrant Workers’ Mental Health: 1995~2011 [J]. Acta Psychologica Sinica, 2015, 47(4): 466-477. |
| [10] | REN Zhen; YANG Anbo; WANG Dengfeng; LIN Ying. Structure Models of Leader-Member Relationship (LMR) from the Perspectives of Cultural Differences between China and the West [J]. Acta Psychologica Sinica, 2014, 46(9): 1355-1377. |
| [11] | XIN Zi-Qiang,ZHANG Mei,HE Lin. Changes in College Students’ Mental Health: A Cross-Temporal Meta-Analysis [J]. , 2012, 44(5): 664-679. |
| [12] | YI Xin-Fa,ZHAO Qian,CAI Shu-Shan. Changes in Mental Health of Members of the Chinese Army (1990~2007):A Cross-Temporal Meta-Analysis [J]. , 2012, 44(2): 226-236. |
| [13] | WANG Li-Jie,SUN Qiu-De,YAN Jin,LIU Ai-Li,DONG Jian-Shu,LIU Jia-Jia,WANG Jian-Ping. Changes in Hippocampus Morphology, Cognitive Function and Coping Style Induced by Chronic Military Stress [J]. , 2011, 43(07): 792-797. |
| [14] | HUANG Min-Er,WU Zhong-Qi,TANG Gan-Qi. How Does Personality Relate to Mental Health in Service Industry Setting? The Mediating Effects of Emotional Labor Strategies [J]. , 2010, 42(12): 1175-1189. |
| [15] | HUANG Xin-Yin,Yan ZHANG,CHEN Yan-Wei,Hisashi Kawabayashi,XU Ai-Bing. Analysis on Applicability of Interactive Evolutionary Computation to Anxiety Measurement [J]. , 2010, 42(05): 625-632. |
| Viewed | ||||||
|
Full text |
|
|||||
|
Abstract |
|
|||||
