ISSN 0439-755X
CN 11-1911/B
CN 11-1911/B
Acta Psychologica Sinica ›› 2026, Vol. 58 ›› Issue (6): 1213-1236.doi: 10.3724/SP.J.1041.2026.1213
ZHOU Lei1, LI Litong1, LIANG Zhuyuan2,3( ), LI Shu4, HUI Qingshan1, ZHANG Lei5,6,7,8
Received:2025-03-20
Published:2026-06-25
Online:2026-04-28
Contact:
LIANG Zhuyuan
E-mail:liangzy@psych.ac.cn
Supported by:ZHOU Lei, LI Litong, LIANG Zhuyuan, LI Shu, HUI Qingshan, ZHANG Lei. (2026). Comparison of risky and intertemporal choice processes: An equivalent conversion paradigm of probability and time. Acta Psychologica Sinica, 58(6), 1213-1236.
Add to citation manager EndNote|Ris|BibTeX
URL: https://journal.psych.ac.cn/acps/EN/10.3724/SP.J.1041.2026.1213
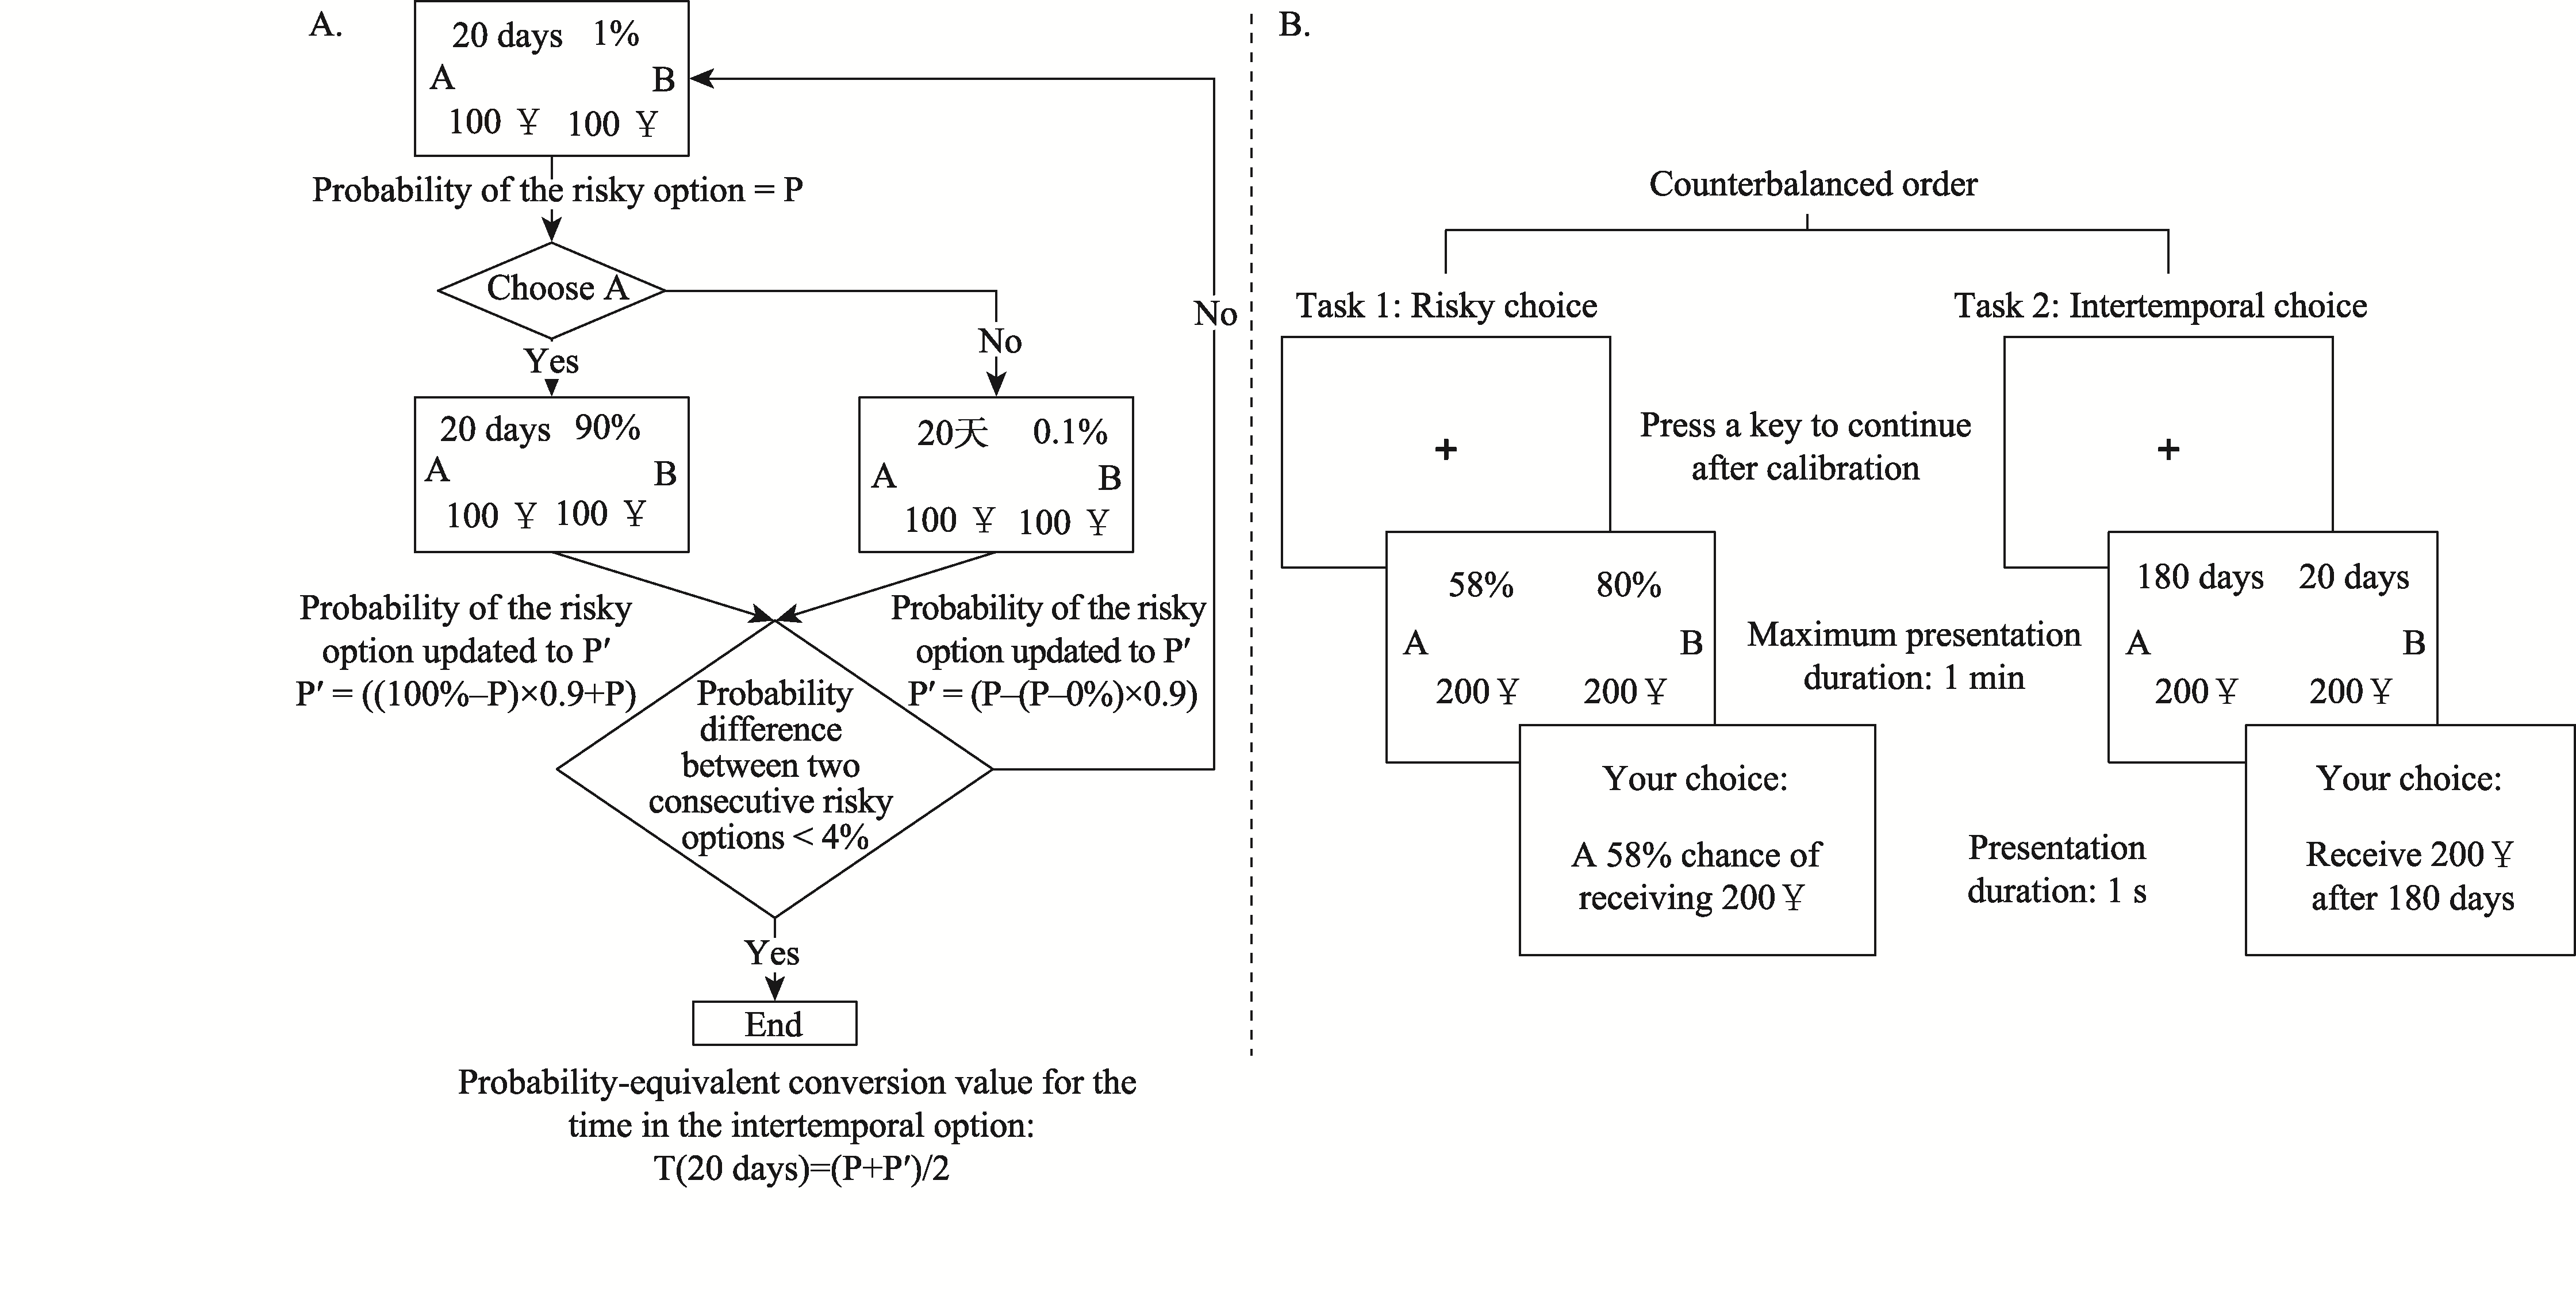
Figure 1. Experimental Procedure of Study 1. Note. A. Stage 1: Probability-time equivalent conversion experiment; B. Stage 2: Eye-tracking experiment comparing single-outcome risky and intertemporal choice.
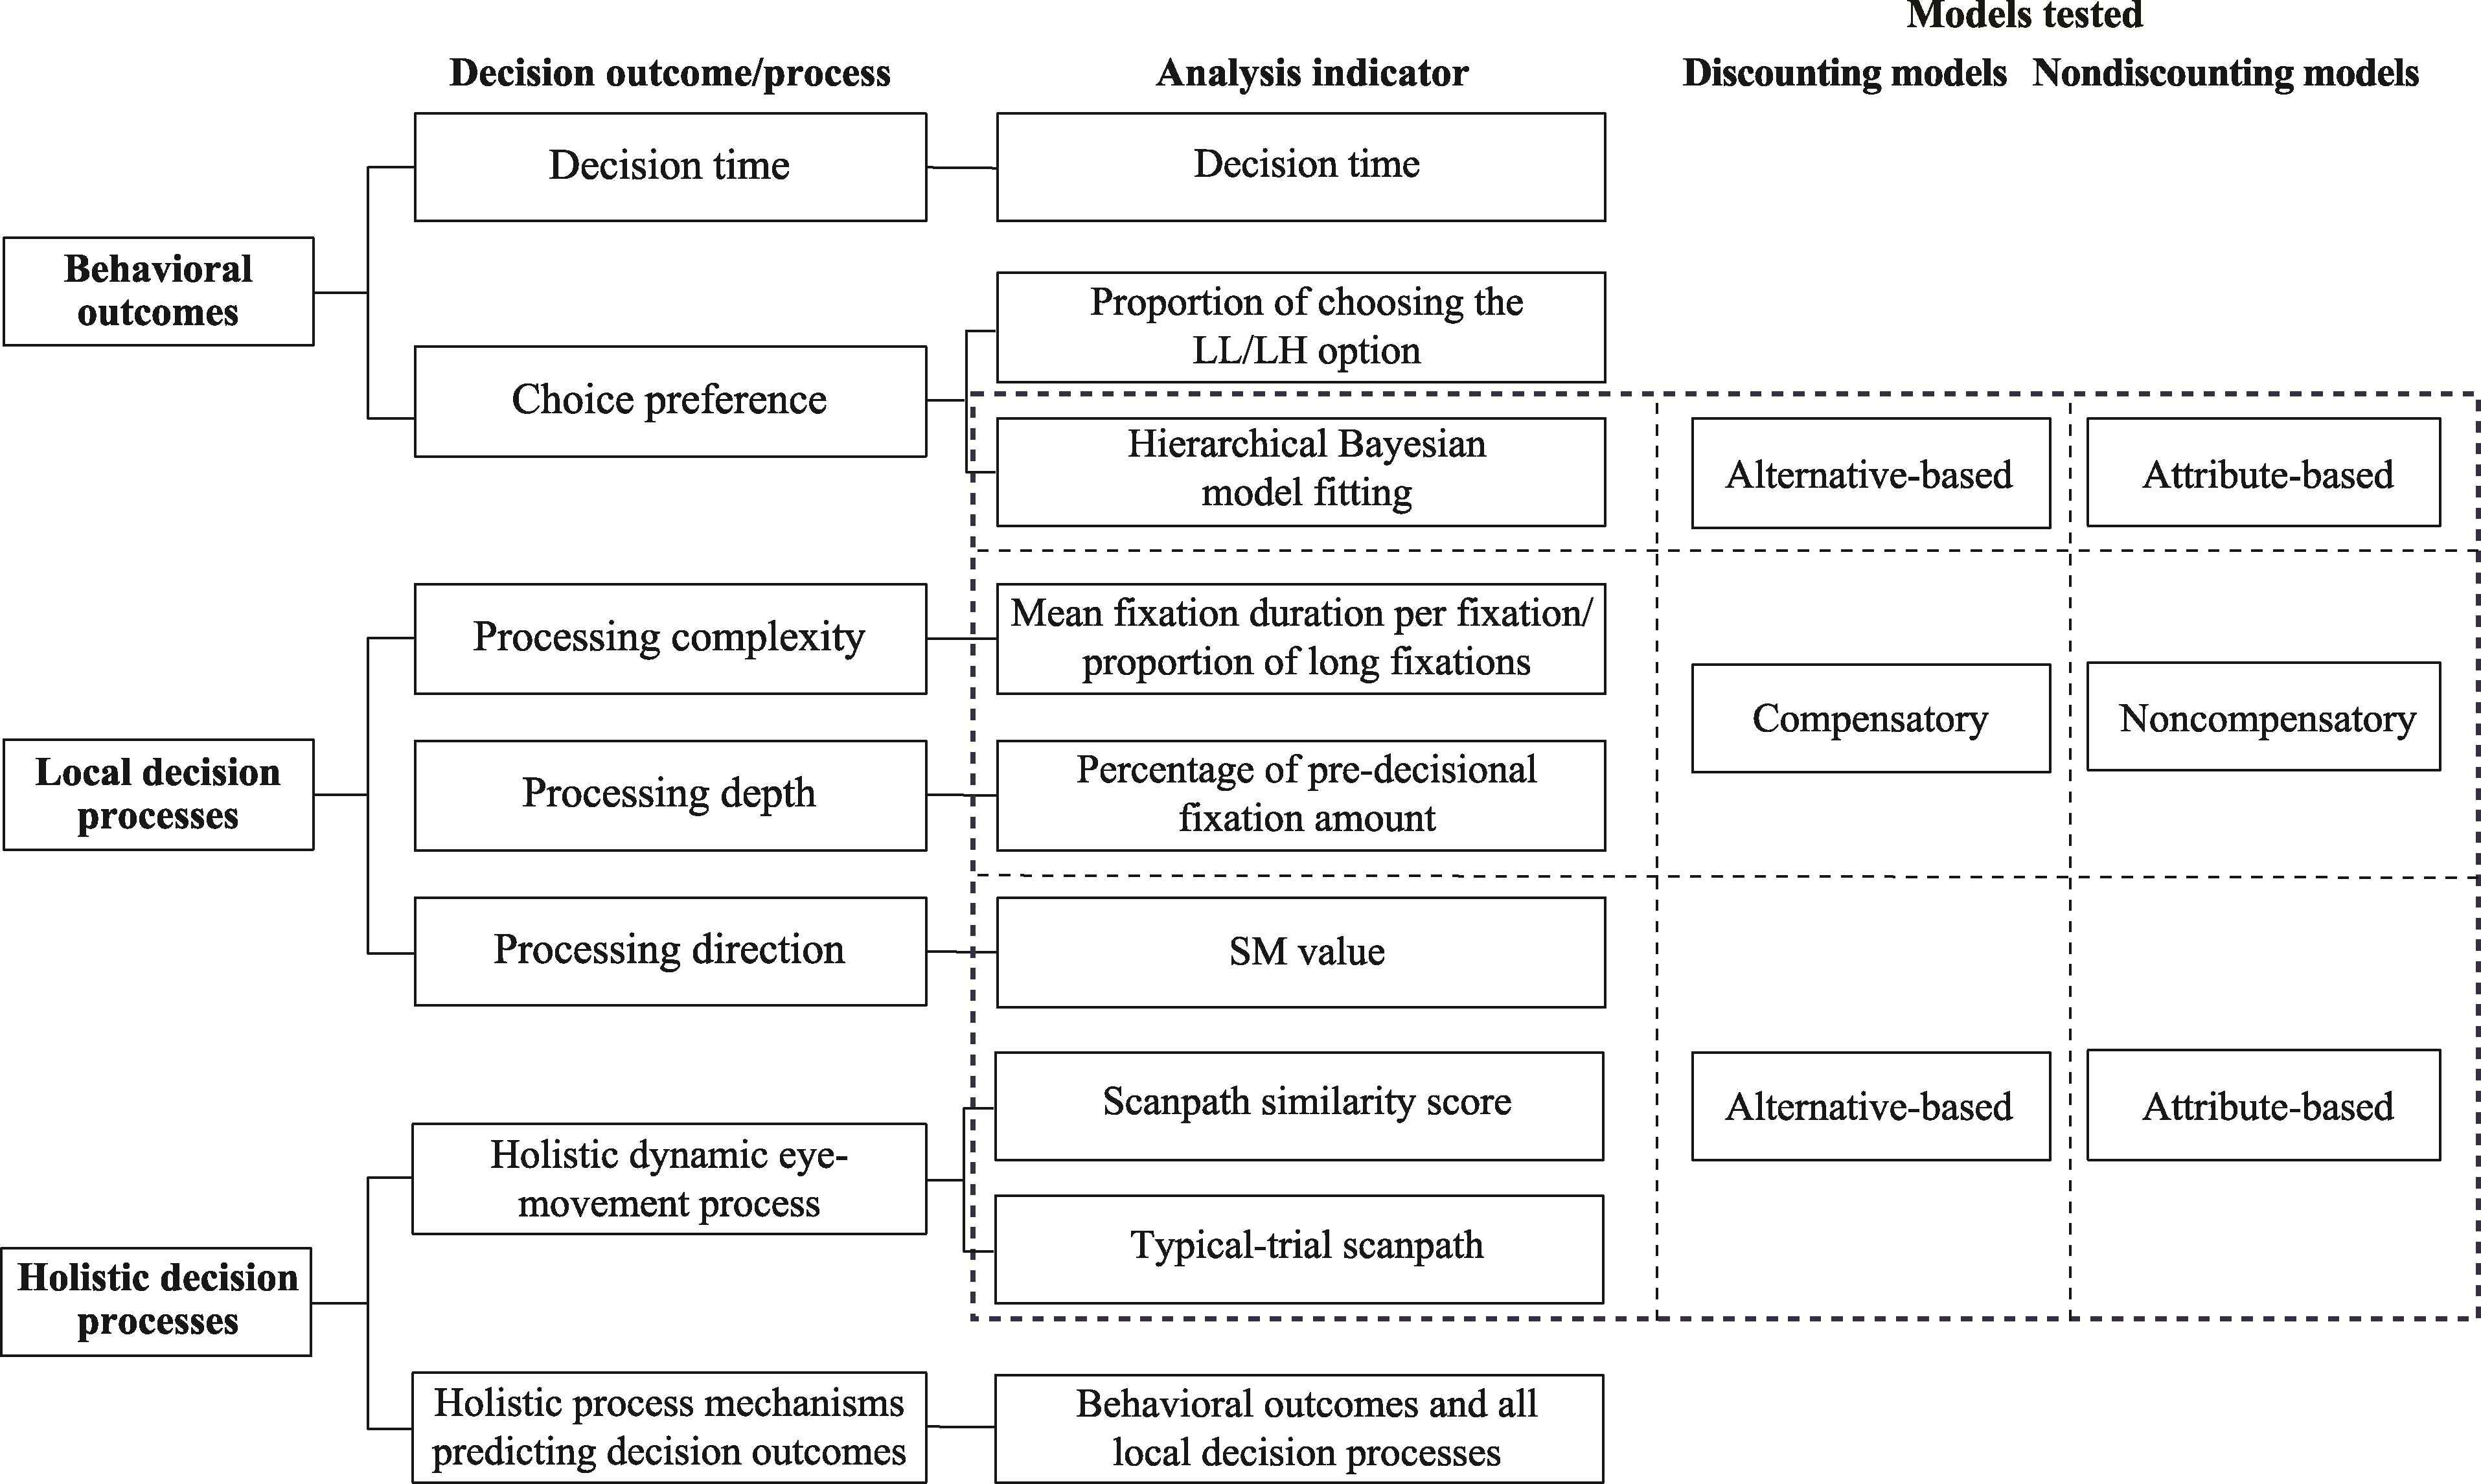
Figure 2. Logical Framework of Data Analysis in Studies 1 and 2.
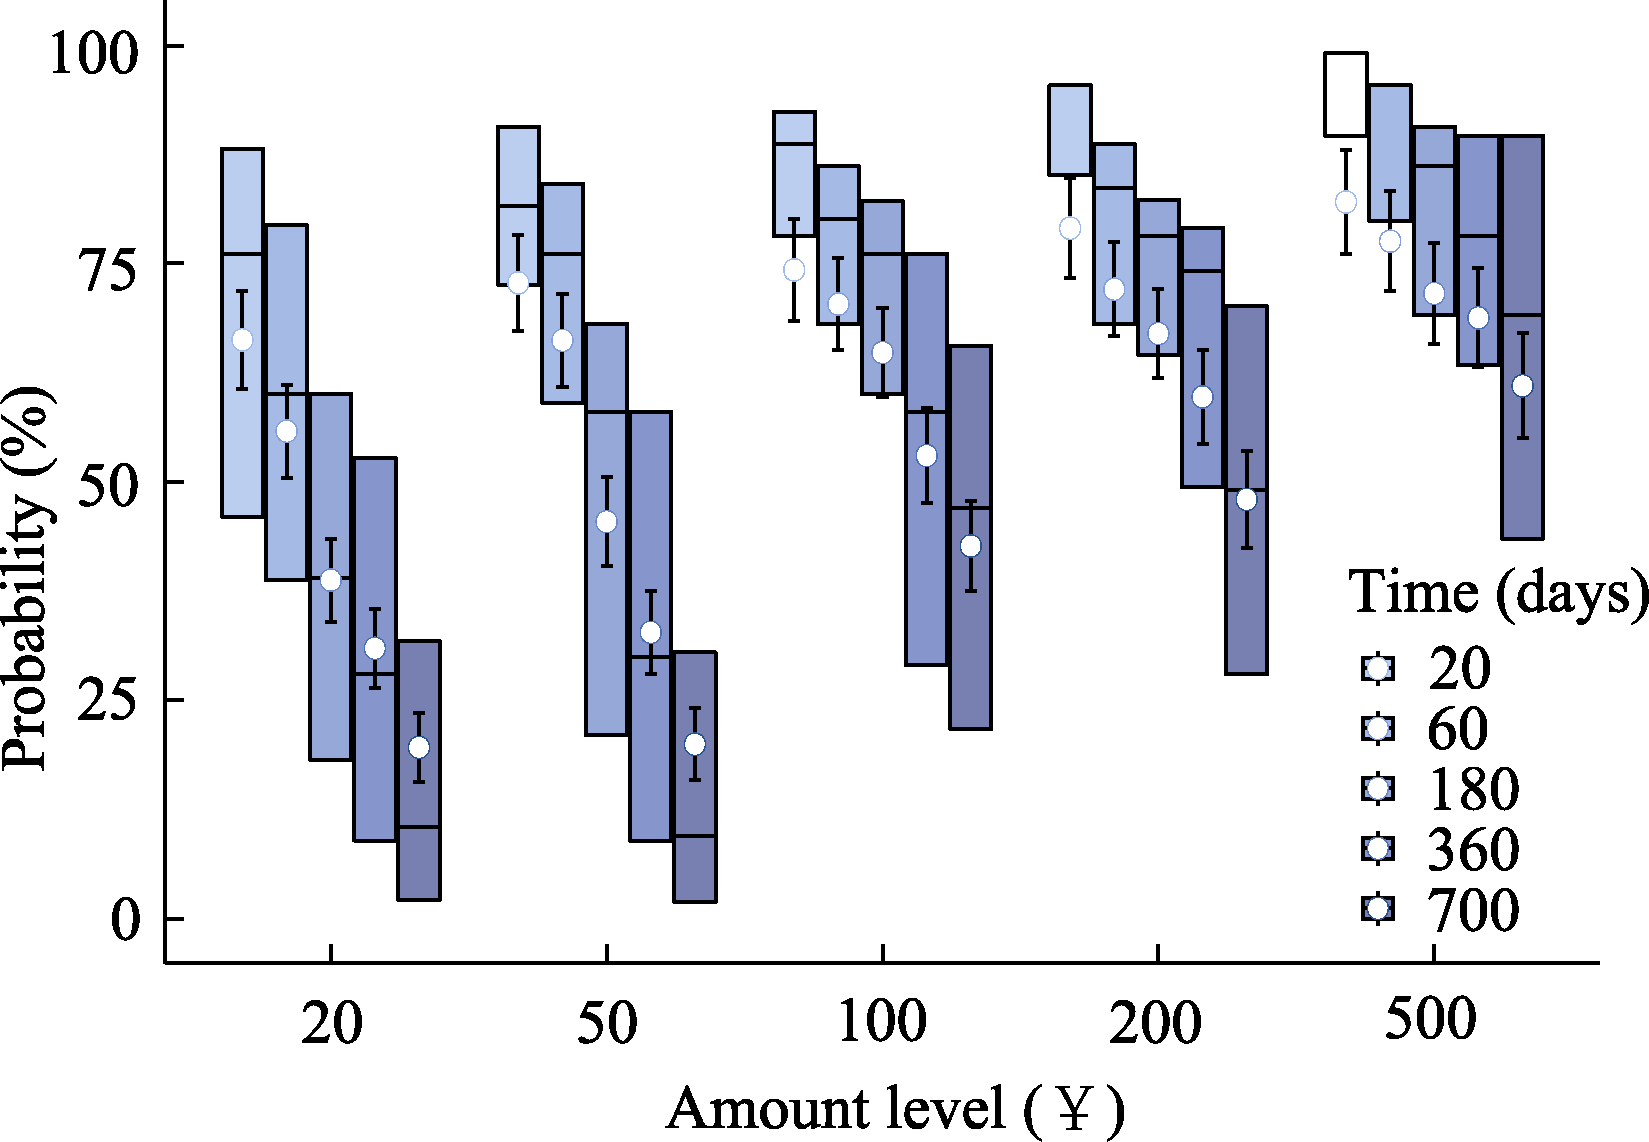
Figure 3. Parameter Distribution of Probability-Time Equivalent Conversion Points in Study 1. Note. The horizontal lines in each box plot, from top to bottom, represent the upper quartile, median, and lower quartile, respectively. White circles indicate the mean (M), and error bars indicate the standard error (SE). Within each group of bars, the bars from left to right represent delay times of 20, 60, 180, 360, and 700 days, respectively. See the online version for the color figure.
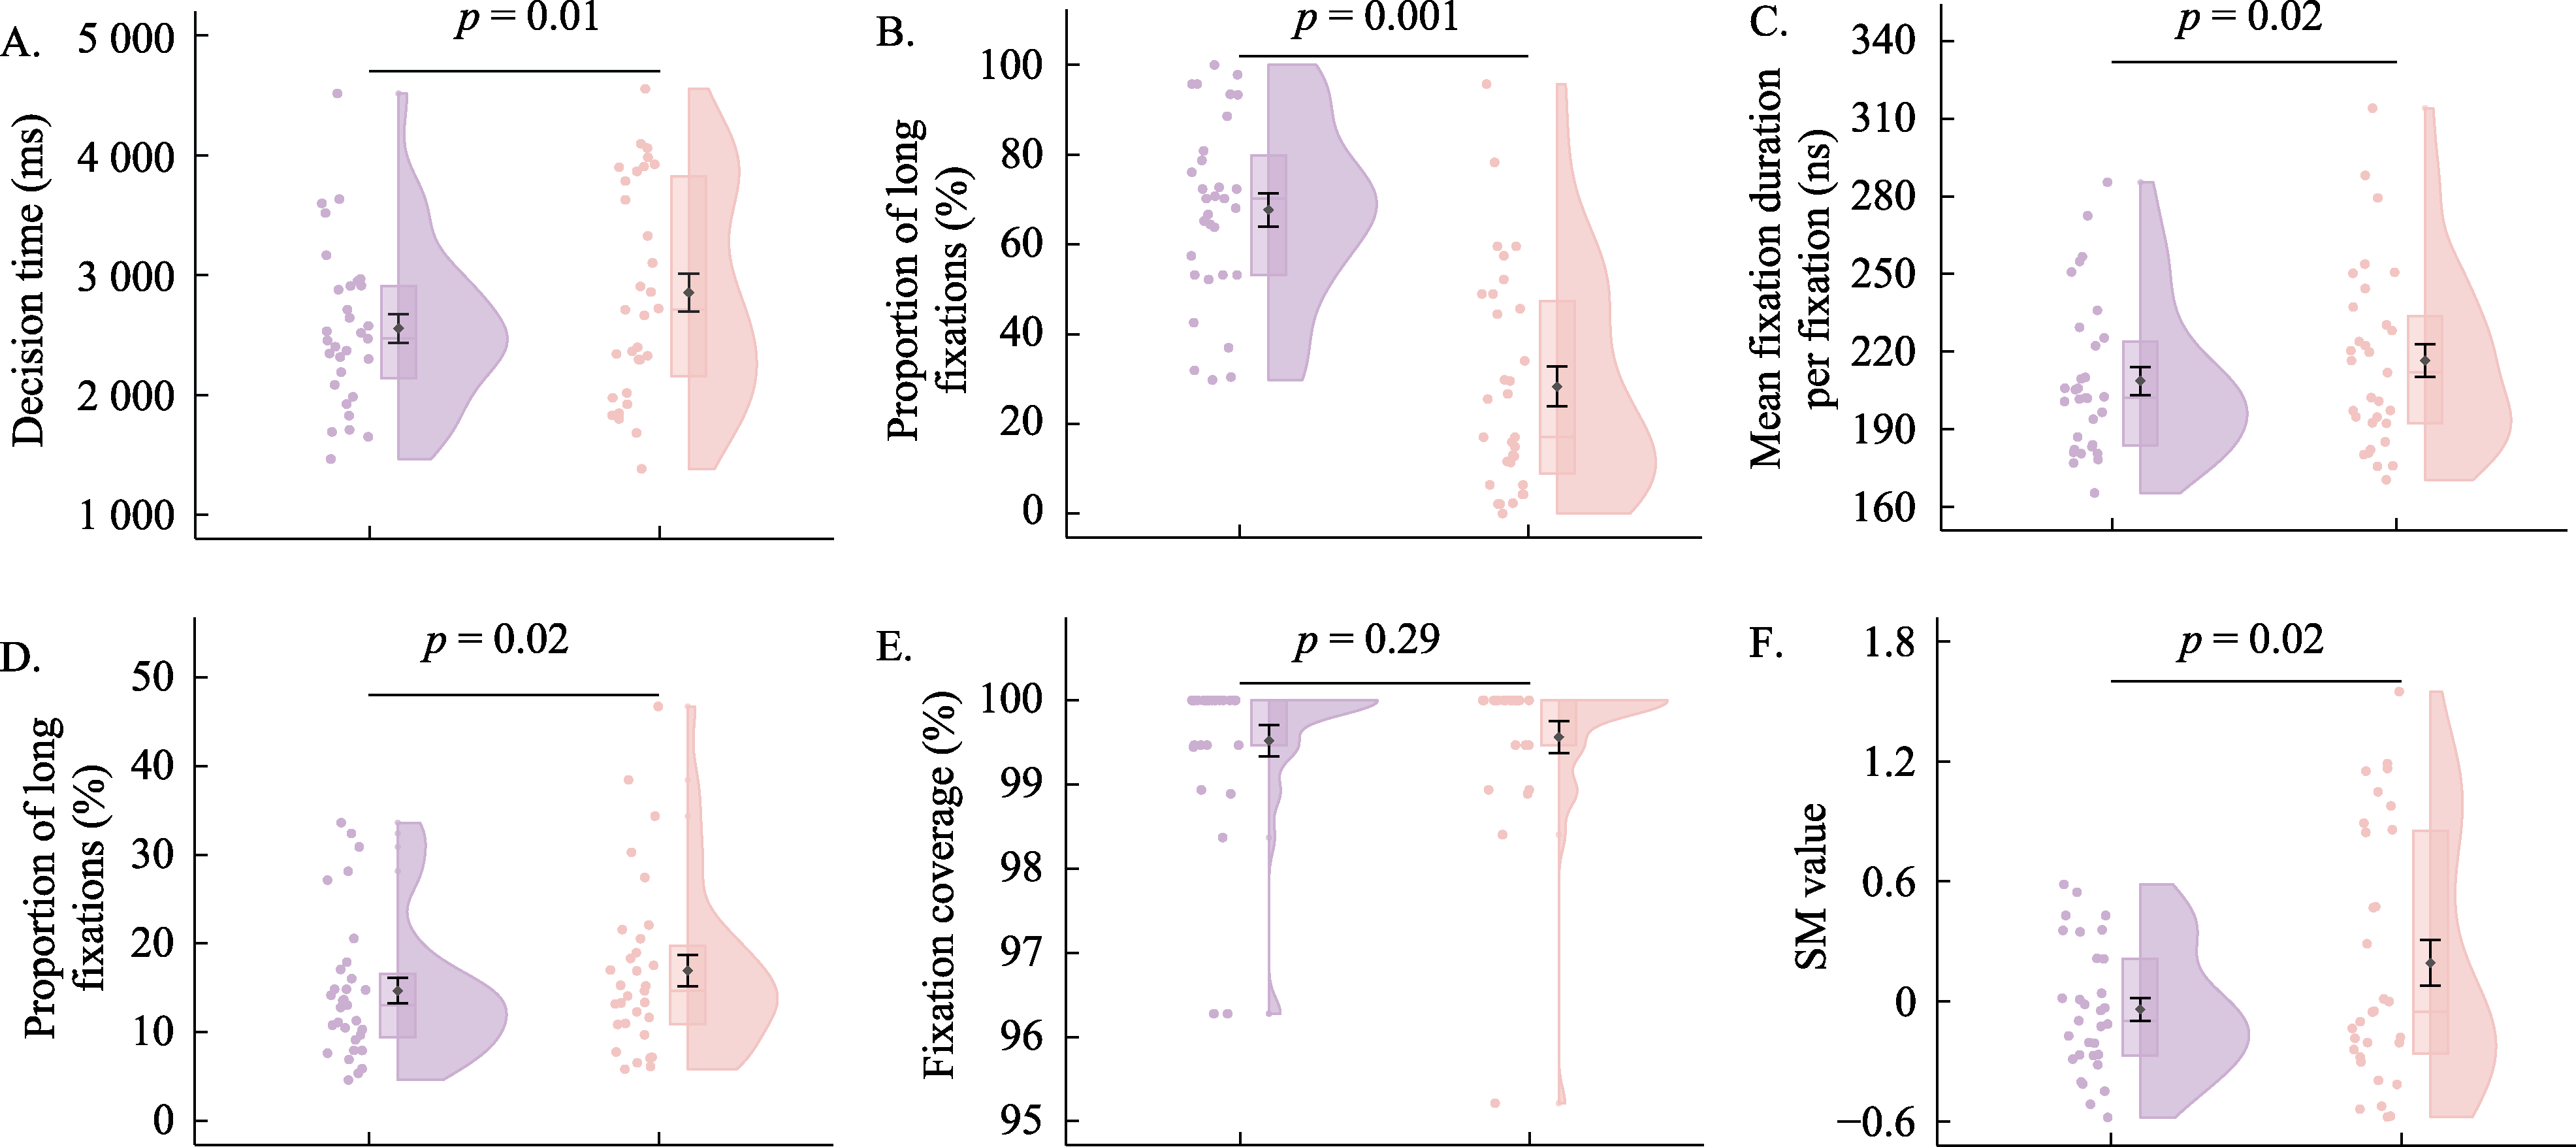
Figure 4. Comparison of Behavioral and Local-Process Levels Between Risky and Intertemporal Choice Tasks in Study 1. Note. A. Decision time; B. Choice preference; C. Processing complexity, indexed by mean fixation duration per fixation; D. Processing complexity, indexed by the proportion of long fixations; E. Processing depth; F. Processing direction. In each panel, the two plots from left to right represent risky choice and intertemporal choice, respectively. See the online version for the color figure.
| Model category | Fitted model | Risky choice | Intertemporal choice | ||||
|---|---|---|---|---|---|---|---|
| elpd (SE) | elpd-diff(SE) | Predictive accuracy | elpd (SE) | elpd-diff(SE) | Predictive accuracy | ||
| Discounting model | Exponential model | -1253.6 (31.2) | -602.3 (59.2) | 69.98% | -903.8 (56.2) | -237.5 (37.7) | 70.31% |
| Hyperbolic model | -1439.9 (10.1) | -788.5 (72.6) | 72.54% | -824.8 (55.4) | -158.5 (28.5) | 71.18% | |
| Nondiscounting model | ITCH heuristic model | -651.4 (68.4) | 0 (0) | 86.83% | -666.3 (43.1) | 0 (0) | 81.75% |
Table 1 Hierarchical Bayesian Model Fitting of Choice Preference in Risky and Intertemporal Choice in Study 1
| Model category | Fitted model | Risky choice | Intertemporal choice | ||||
|---|---|---|---|---|---|---|---|
| elpd (SE) | elpd-diff(SE) | Predictive accuracy | elpd (SE) | elpd-diff(SE) | Predictive accuracy | ||
| Discounting model | Exponential model | -1253.6 (31.2) | -602.3 (59.2) | 69.98% | -903.8 (56.2) | -237.5 (37.7) | 70.31% |
| Hyperbolic model | -1439.9 (10.1) | -788.5 (72.6) | 72.54% | -824.8 (55.4) | -158.5 (28.5) | 71.18% | |
| Nondiscounting model | ITCH heuristic model | -651.4 (68.4) | 0 (0) | 86.83% | -666.3 (43.1) | 0 (0) | 81.75% |
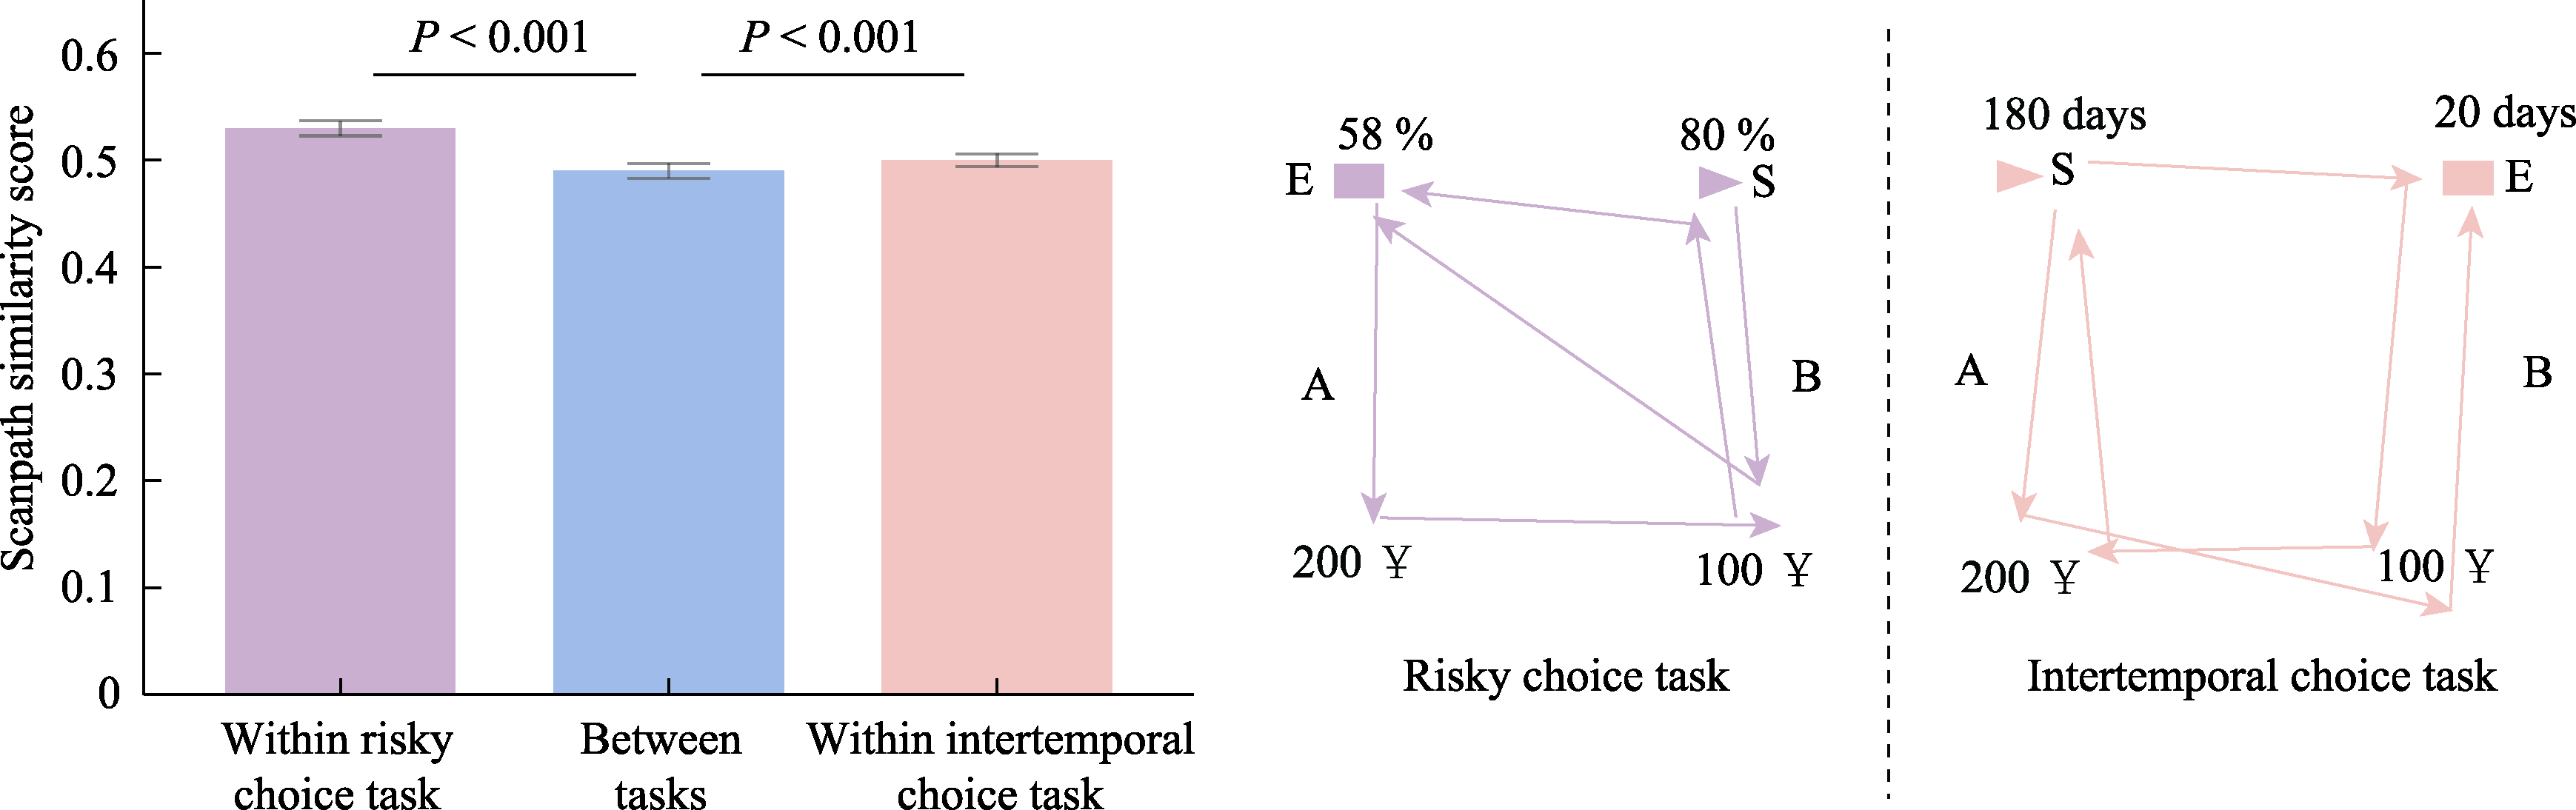
Figure 5. Comparison of Holistic-Process Levels Between Risky and Intertemporal Choice Tasks in Study 1.
| Dependent variable | Predictor | b | SE | z | p | 95% CI |
|---|---|---|---|---|---|---|
| Risky choice: proportion of choosing the LH option | Intercept | 0.97 | 0.22 | 4.33 | < 0.001 | [0.53, 1.41] |
| Decision time | 0.02 | 0.08 | 0.31 | 0.760 | [-0.13, 0.18] | |
| Mean fixation duration per fixation | 0.12 | 0.12 | 0.96 | 0.339 | [-0.12, 0.35] | |
| Proportion of long fixations | -0.06 | 0.11 | -0.59 | 0.556 | [-0.28, 0.15] | |
| SM value | -0.21 | 0.07 | -3.06 | 0.002 | [-0.35, -0.08] | |
| Fixation coverage | 0.12 | 0.07 | 1.85 | 0.064 | [-0.01, 0.25] | |
| Intertemporal choice: proportion of choosing the LL option | Intercept | -1.32 | 0.29 | -4.57 | < 0.001 | [-1.89, -0.76] |
| Decision time | 0.20 | 0.08 | 2.37 | 0.018 | [0.04, 0.37] | |
| Mean fixation duration per fixation | 0.03 | 0.13 | 0.25 | 0.802 | [-0.22, 0.28] | |
| Proportion of long fixations | -0.25 | 0.13 | -2.02 | 0.044 | [-0.50, -0.01] | |
| SM value | -0.04 | 0.09 | -0.44 | 0.658 | [-0.22, 0.14] | |
| Fixation coverage | -0.06 | 0.10 | -0.65 | 0.516 | [-0.25, 0.12] |
Table 2 Prediction of Choice Preference in Risky and Intertemporal Choice Tasks in Study 1 Based on Generalized Linear Models
| Dependent variable | Predictor | b | SE | z | p | 95% CI |
|---|---|---|---|---|---|---|
| Risky choice: proportion of choosing the LH option | Intercept | 0.97 | 0.22 | 4.33 | < 0.001 | [0.53, 1.41] |
| Decision time | 0.02 | 0.08 | 0.31 | 0.760 | [-0.13, 0.18] | |
| Mean fixation duration per fixation | 0.12 | 0.12 | 0.96 | 0.339 | [-0.12, 0.35] | |
| Proportion of long fixations | -0.06 | 0.11 | -0.59 | 0.556 | [-0.28, 0.15] | |
| SM value | -0.21 | 0.07 | -3.06 | 0.002 | [-0.35, -0.08] | |
| Fixation coverage | 0.12 | 0.07 | 1.85 | 0.064 | [-0.01, 0.25] | |
| Intertemporal choice: proportion of choosing the LL option | Intercept | -1.32 | 0.29 | -4.57 | < 0.001 | [-1.89, -0.76] |
| Decision time | 0.20 | 0.08 | 2.37 | 0.018 | [0.04, 0.37] | |
| Mean fixation duration per fixation | 0.03 | 0.13 | 0.25 | 0.802 | [-0.22, 0.28] | |
| Proportion of long fixations | -0.25 | 0.13 | -2.02 | 0.044 | [-0.50, -0.01] | |
| SM value | -0.04 | 0.09 | -0.44 | 0.658 | [-0.22, 0.14] | |
| Fixation coverage | -0.06 | 0.10 | -0.65 | 0.516 | [-0.25, 0.12] |
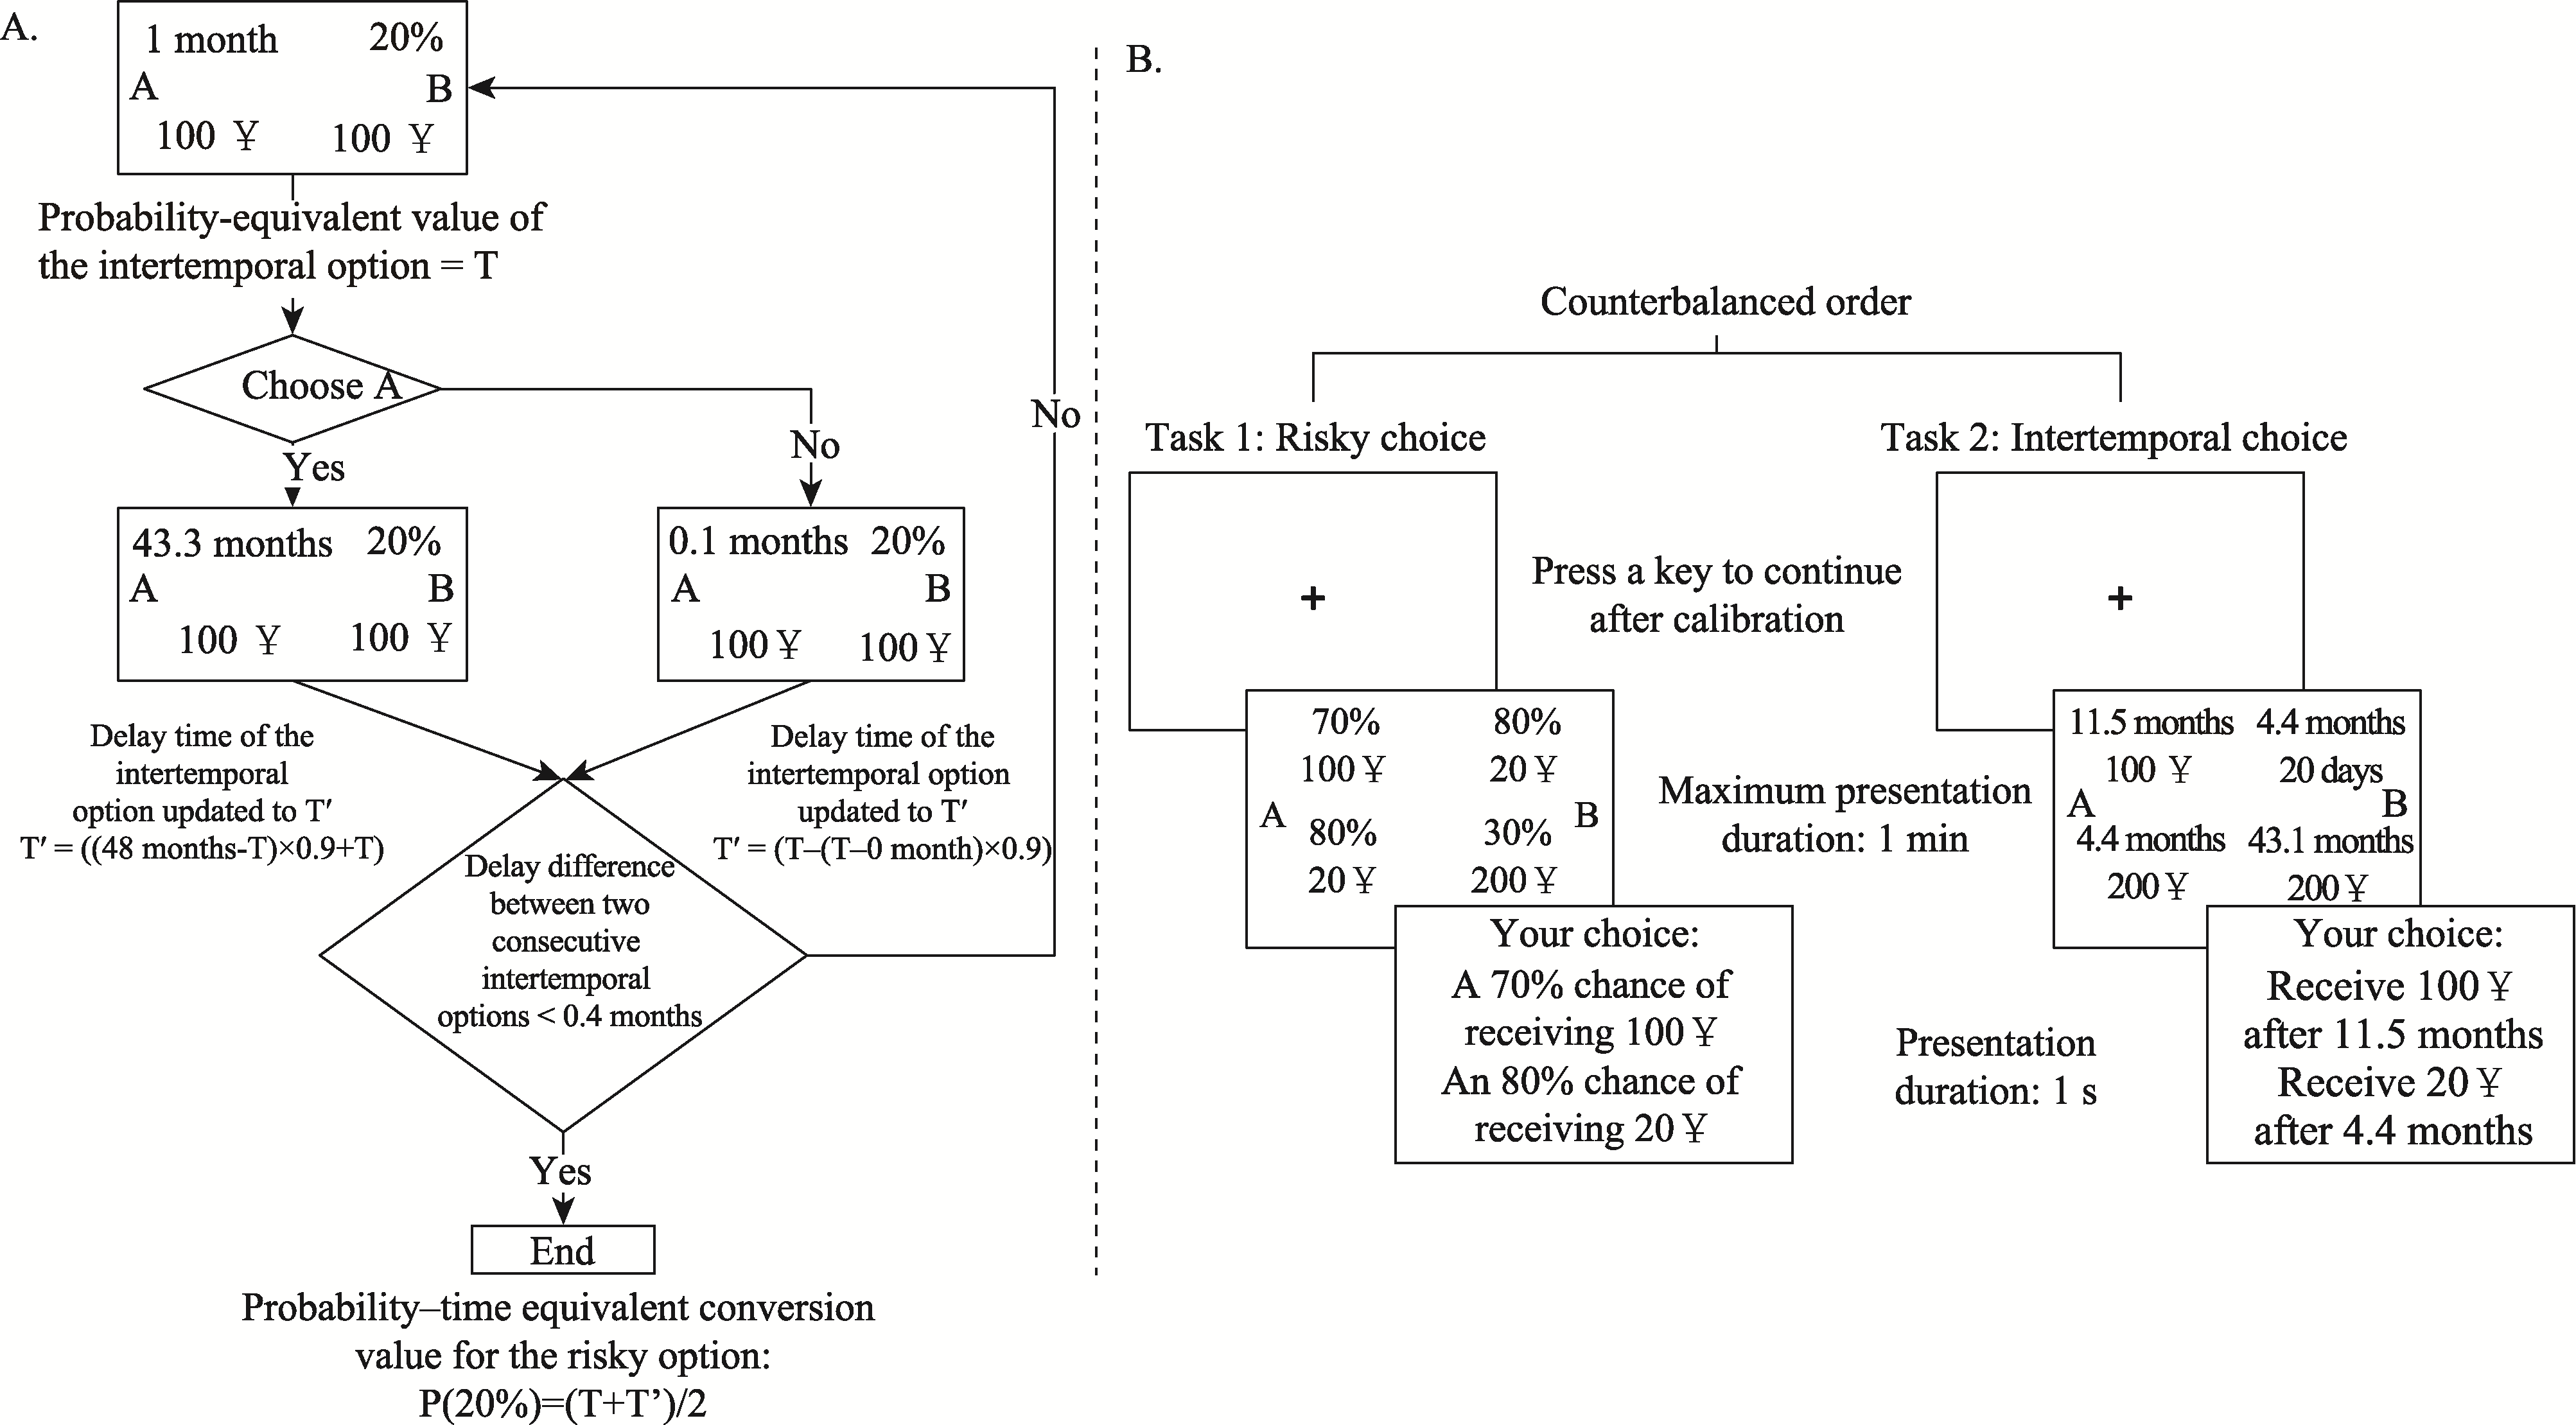
Figure 6. Experimental Procedure of Study 2. Note. A. Stage 1: Probability-time equivalent conversion experiment; B. Stage 2: Eye-tracking experiment comparing dual-outcome risky and intertemporal choice.
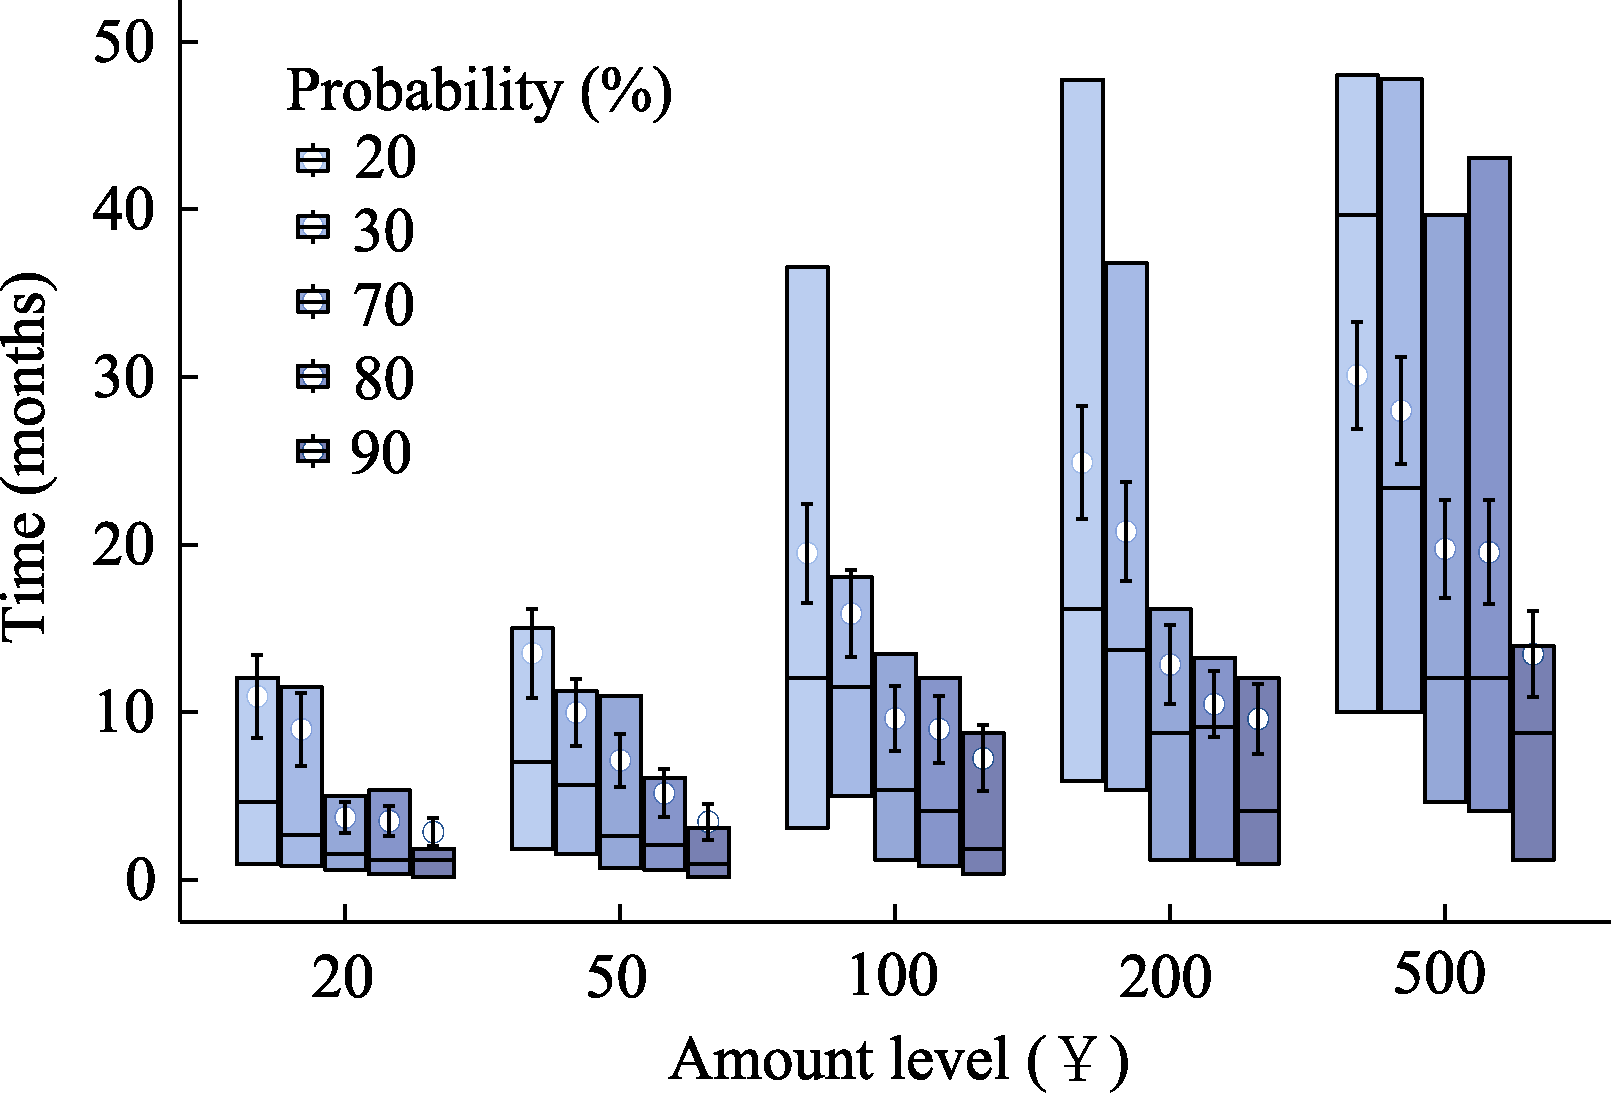
Figure 7. Parameter Distribution of Probability-Time Equivalent Conversion Points in Study 2. Note. The horizontal lines in each box plot, from top to bottom, represent the upper quartile, median, and lower quartile, respectively. White circles indicate the mean (M), and error bars indicate the standard error (SE). Within each group of bars, the bars from left to right represent probability levels of 20%, 30%, 70%, 80%, and 90%, respectively. See the online version for the color figure.
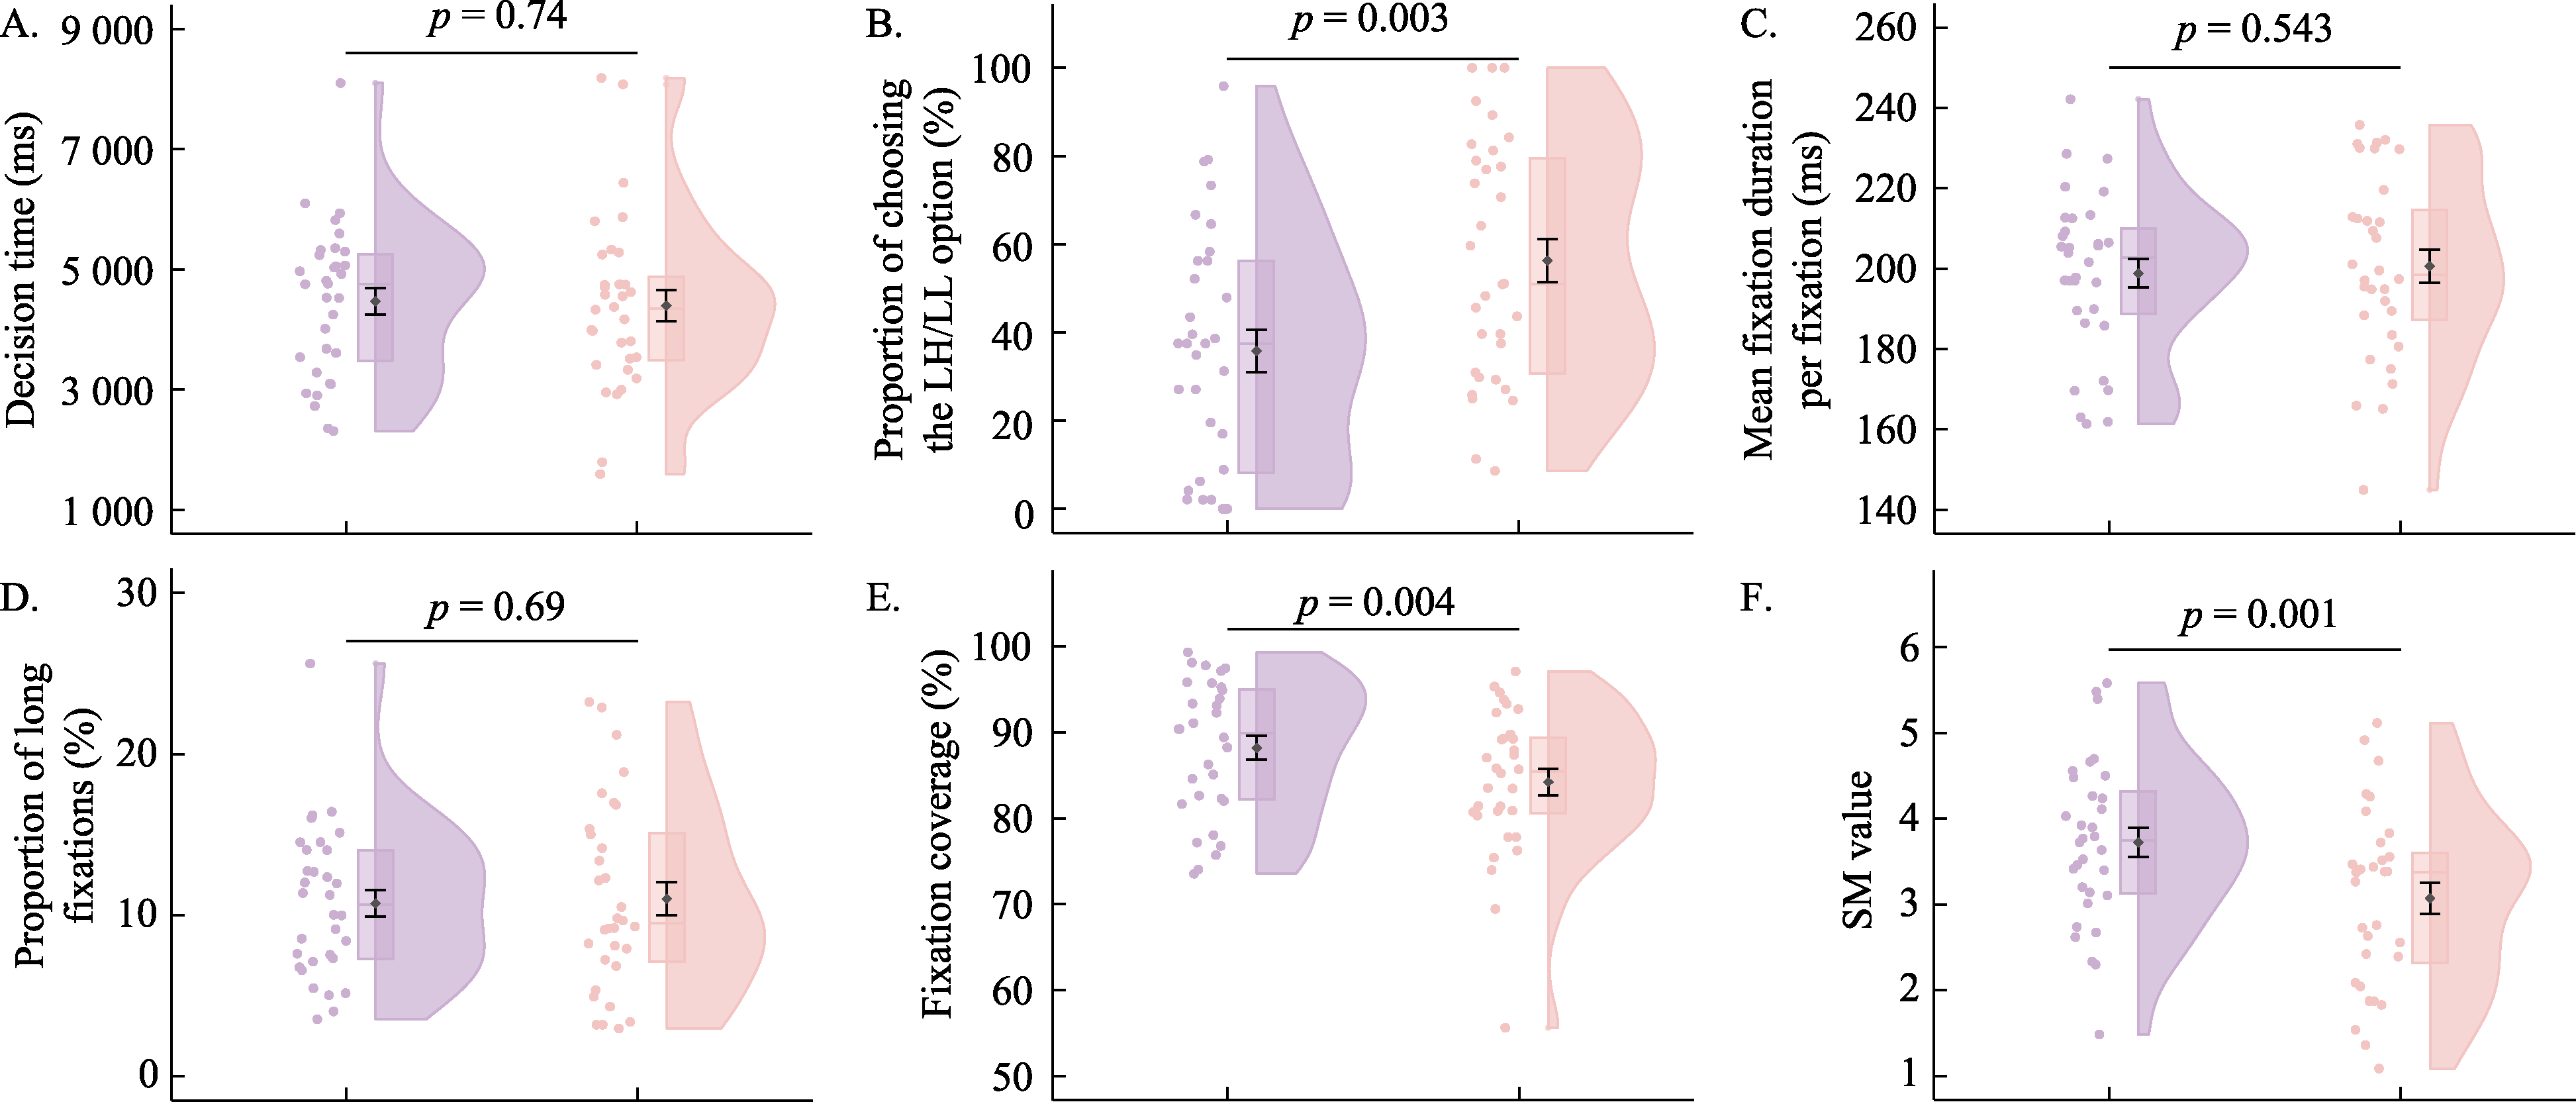
Figure 8. Comparison of Behavioral and Local-Process Levels Between Risky and Intertemporal Choice Tasks in Study 2. Note. A. Decision time; B. Choice preference; C. Processing complexity, indexed by mean fixation duration per fixation; D. Processing complexity, indexed by the proportion of long fixations; E. Processing depth; F. Processing direction. In each panel, the two plots from left to right represent risky choice and intertemporal choice, respectively. See the online version for the color figure.
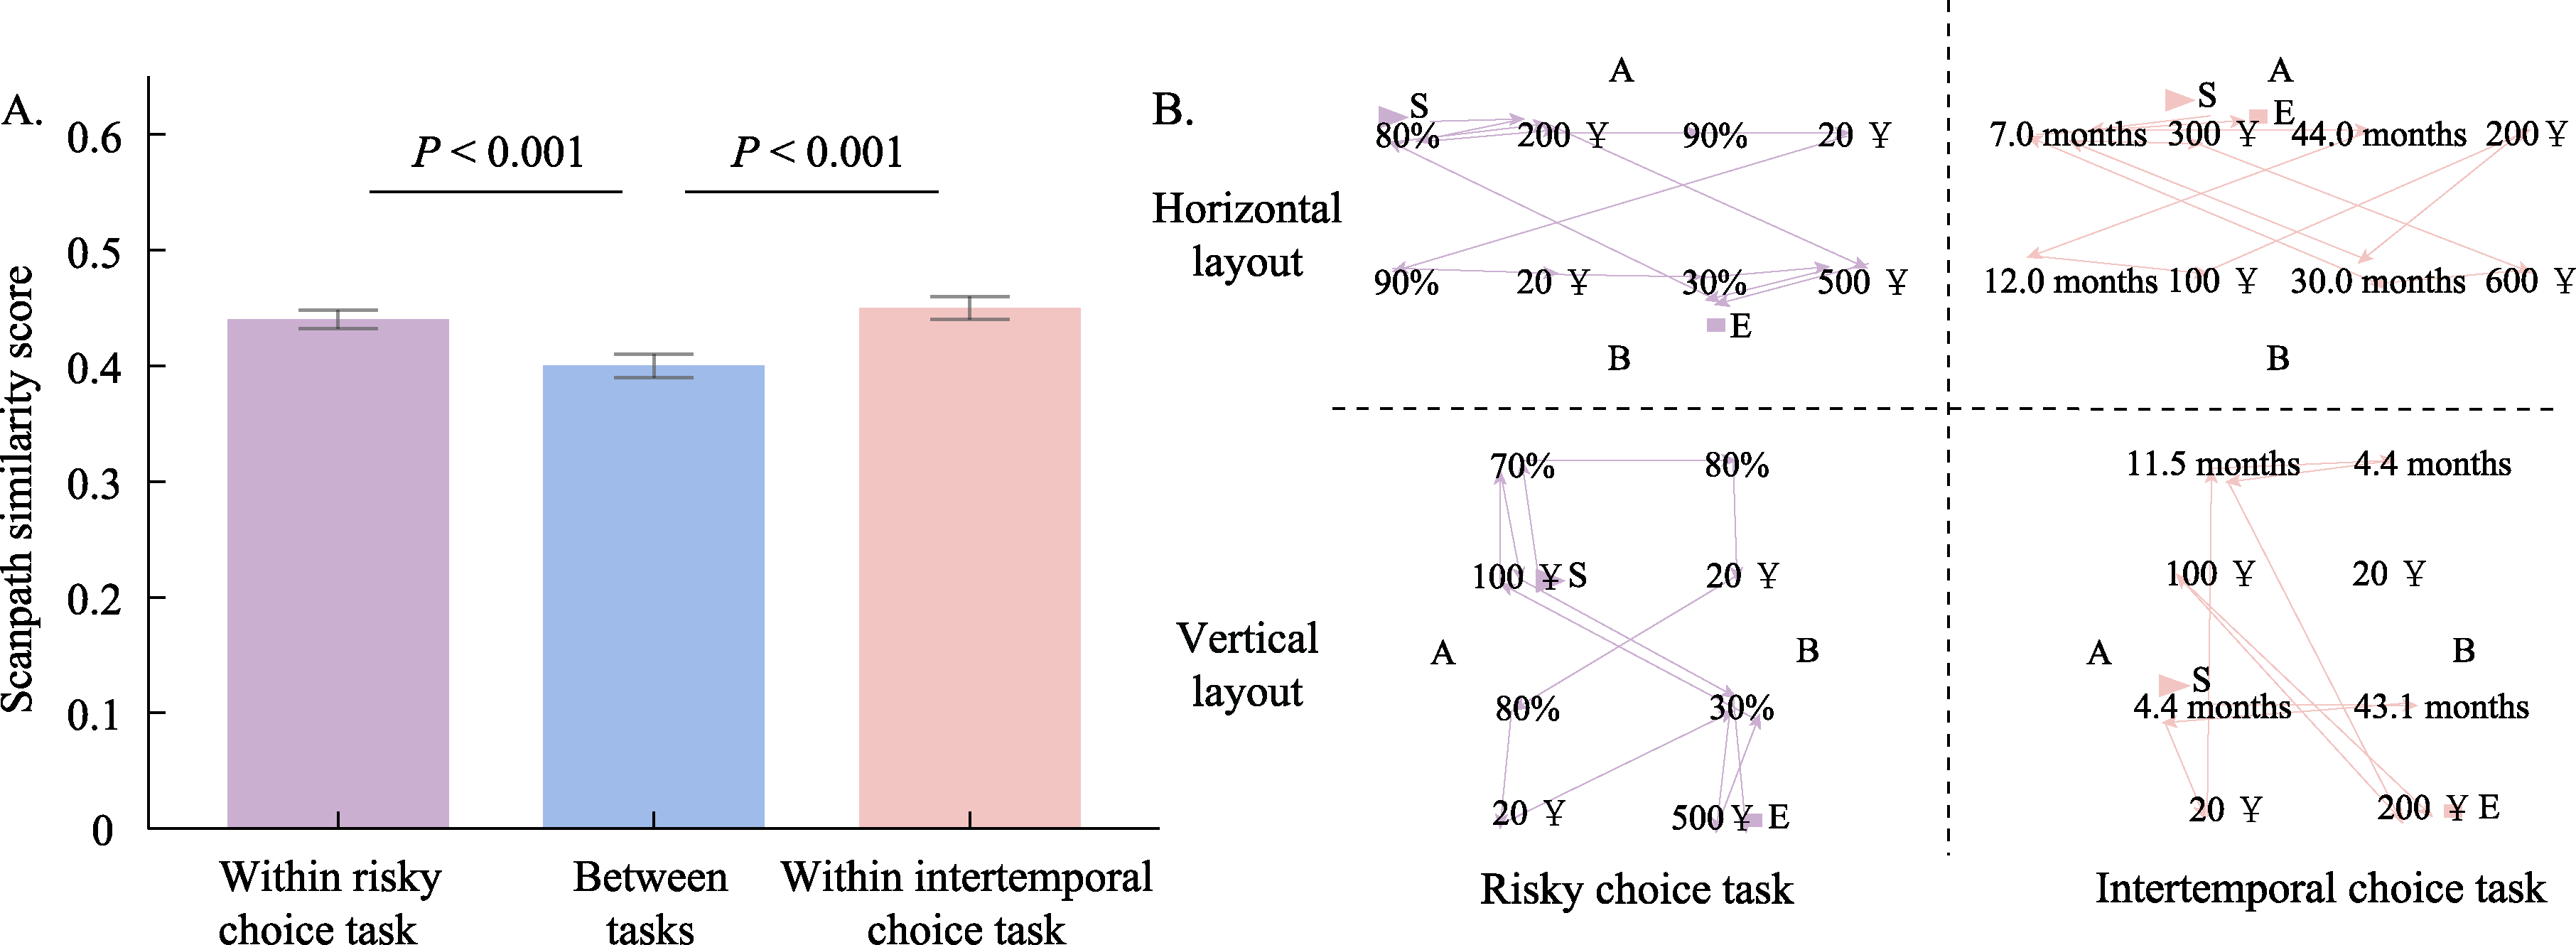
Figure 9. Comparison of Holistic-Process Levels Between Risky and Intertemporal Choice Tasks in Study 2. Note. A. Scanpath similarity scores; B. Typical-trial scanpaths. S indicates the starting position, arrows indicate the direction of the scanpath, and E indicates the ending position. In Panel A, the three bars from left to right represent within-risky-choice-task, between-task, and within-intertemporal-choice-task conditions, respectively. See the online version for the color figure.
| Dependent variable | Predictor | b | SE | z | p | 95% CI |
|---|---|---|---|---|---|---|
| Risky choice: LH option | Intercept | -1.57 | 0.61 | -2.55 | 0.011 | [-2.77, -0.36] |
| Decision time | -0.10 | 0.15 | -0.69 | 0.492 | [-0.40, 0.19] | |
| Mean fixation duration per fixation | -0.24 | 0.16 | -1.46 | 0.143 | [-0.56, 0.08] | |
| Proportion of long fixations | 0.05 | 0.15 | 0.33 | 0.740 | [-0.24, 0.34] | |
| SM value | -0.18 | 0.14 | -1.27 | 0.205 | [-0.45, 0.10] | |
| Fixation coverage | -0.28 | 0.13 | -2.16 | 0.031 | [-0.53, -0.03] | |
| Intertemporal choice: LL option | Intercept | 0.49 | 0.43 | 1.14 | 0.256 | [-0.36, 1.34] |
| Decision time | -0.16 | 0.13 | -1.25 | 0.212 | [-0.40, 0.09] | |
| Mean fixation duration per fixation | -0.25 | 0.14 | -1.81 | 0.071 | [-0.52, 0.02] | |
| Proportion of long fixations | 0.11 | 0.13 | 0.89 | 0.375 | [-0.13, 0.36] | |
| SM value | 0.11 | 0.11 | 0.99 | 0.322 | [-0.11, 0.33] | |
| Fixation coverage | -0.04 | 0.10 | -0.43 | 0.670 | [-0.24, 0.15] |
Table 3 Prediction of Choice Preference in Risky and Intertemporal Choice Tasks in Study 2 Based on Generalized Linear Models
| Dependent variable | Predictor | b | SE | z | p | 95% CI |
|---|---|---|---|---|---|---|
| Risky choice: LH option | Intercept | -1.57 | 0.61 | -2.55 | 0.011 | [-2.77, -0.36] |
| Decision time | -0.10 | 0.15 | -0.69 | 0.492 | [-0.40, 0.19] | |
| Mean fixation duration per fixation | -0.24 | 0.16 | -1.46 | 0.143 | [-0.56, 0.08] | |
| Proportion of long fixations | 0.05 | 0.15 | 0.33 | 0.740 | [-0.24, 0.34] | |
| SM value | -0.18 | 0.14 | -1.27 | 0.205 | [-0.45, 0.10] | |
| Fixation coverage | -0.28 | 0.13 | -2.16 | 0.031 | [-0.53, -0.03] | |
| Intertemporal choice: LL option | Intercept | 0.49 | 0.43 | 1.14 | 0.256 | [-0.36, 1.34] |
| Decision time | -0.16 | 0.13 | -1.25 | 0.212 | [-0.40, 0.09] | |
| Mean fixation duration per fixation | -0.25 | 0.14 | -1.81 | 0.071 | [-0.52, 0.02] | |
| Proportion of long fixations | 0.11 | 0.13 | 0.89 | 0.375 | [-0.13, 0.36] | |
| SM value | 0.11 | 0.11 | 0.99 | 0.322 | [-0.11, 0.33] | |
| Fixation coverage | -0.04 | 0.10 | -0.43 | 0.670 | [-0.24, 0.15] |
| Level of test | Decision outcome/process | Analysis indicator | Outcome | |
|---|---|---|---|---|
| Difference | Tested rule | |||
| Behavioral outcomes | Decision time | Decision time | R < I | — |
| R = I | ||||
| Choice preference | Proportion of choosing the LL/LH option | R > I | — | |
| R < I | ||||
| Hierarchical Bayesian model fitting (Study 1) | R = I | Attribute-based | ||
| Local processes | Processing complexity | Mean fixation duration per fixation | R < I | Noncompensatory |
| Proportion of long fixations | R = I | Noncompensatory | ||
| Processing depth | Fixation coverage | R = I | Noncompensatory | |
| R > I | Noncompensatory | |||
| Processing direction | SM value | R < I | No dominant rule | |
| R > I | Alternative-based | |||
| Holistic processes | Holistic dynamic eye-movement process | Scanpaths | R≠I | No dominant rule |
| Alternative-based (R) Attribute-based (I) | ||||
| All local-process indicators | Generalized linear mixed model | R≠I | — | |
Table 4 Summary of Research Findings
| Level of test | Decision outcome/process | Analysis indicator | Outcome | |
|---|---|---|---|---|
| Difference | Tested rule | |||
| Behavioral outcomes | Decision time | Decision time | R < I | — |
| R = I | ||||
| Choice preference | Proportion of choosing the LL/LH option | R > I | — | |
| R < I | ||||
| Hierarchical Bayesian model fitting (Study 1) | R = I | Attribute-based | ||
| Local processes | Processing complexity | Mean fixation duration per fixation | R < I | Noncompensatory |
| Proportion of long fixations | R = I | Noncompensatory | ||
| Processing depth | Fixation coverage | R = I | Noncompensatory | |
| R > I | Noncompensatory | |||
| Processing direction | SM value | R < I | No dominant rule | |
| R > I | Alternative-based | |||
| Holistic processes | Holistic dynamic eye-movement process | Scanpaths | R≠I | No dominant rule |
| Alternative-based (R) Attribute-based (I) | ||||
| All local-process indicators | Generalized linear mixed model | R≠I | — | |
| Decision rule | Choice type | Core assumption | Representative model | References |
|---|---|---|---|---|
| Compensatory / alternative-based | Risky choice | Based on mathematical expectation and following the rule of “weighting and summing,” this view assumes that people weight and sum outcomes by the probability of occurrence for each alternative to obtain the expected value, and then choose the alternative with the maximum expected value. | Expected value theory (EV); expected utility theory (EU); prospect theory (PT); cumulative prospect theory (CPT) | Pascal, Neumann & Morgenstern, |
| Intertemporal choice | Following the rule of “discounting and summing,” this view assumes that people discount and sum the utility of outcomes at different future time points according to a discounting rate, and then choose the alternative with the maximum total utility. | Discounted utility model (DU); hyperbolic discounting model | Samuelson, | |
| Noncompensatory / attribute-based | Risky choice | Decision-makers focus only on several key attributes, such as the “worst outcome,” “probability of the worst outcome,” or “best outcome,” and make decisions by comparing these attributes across alternatives. | Minimax heuristic model; equate-to-differentiate model (ETD); priority heuristic model | & Hertwig, |
| Intertemporal choice | Decision-makers compare differences in time intervals and outcome magnitudes, and make decisions based on the attribute with the larger difference. | Similarity judgments model; tradeoff model; intertemporal choice heuristics model (ITCH) | Leland, |
Table S1 Theoretical Models of Risky Choice and Intertemporal Choice
| Decision rule | Choice type | Core assumption | Representative model | References |
|---|---|---|---|---|
| Compensatory / alternative-based | Risky choice | Based on mathematical expectation and following the rule of “weighting and summing,” this view assumes that people weight and sum outcomes by the probability of occurrence for each alternative to obtain the expected value, and then choose the alternative with the maximum expected value. | Expected value theory (EV); expected utility theory (EU); prospect theory (PT); cumulative prospect theory (CPT) | Pascal, Neumann & Morgenstern, |
| Intertemporal choice | Following the rule of “discounting and summing,” this view assumes that people discount and sum the utility of outcomes at different future time points according to a discounting rate, and then choose the alternative with the maximum total utility. | Discounted utility model (DU); hyperbolic discounting model | Samuelson, | |
| Noncompensatory / attribute-based | Risky choice | Decision-makers focus only on several key attributes, such as the “worst outcome,” “probability of the worst outcome,” or “best outcome,” and make decisions by comparing these attributes across alternatives. | Minimax heuristic model; equate-to-differentiate model (ETD); priority heuristic model | & Hertwig, |
| Intertemporal choice | Decision-makers compare differences in time intervals and outcome magnitudes, and make decisions based on the attribute with the larger difference. | Similarity judgments model; tradeoff model; intertemporal choice heuristics model (ITCH) | Leland, |
| Dimension | Decision property | Analysis indicator | Research hypothesis | |
|---|---|---|---|---|
| H2: Similarity between the two types of choice processes | H4: The two types of choice processes are more consistent with noncompensatory/attribute-based rules | |||
| Behavioral features | Decision time | H2a: There is no difference in decision time. | ||
| Proportion of choosing the LL/LH option | H2b: There is no difference in choice preference. | |||
| Hierarchical Bayesian model fitting | H2c: The two types of choice can be fitted by the same type of decision model. | H4a: Compared with discounting models, the two types of choice can be better fitted by nondiscounting models. | ||
| Local process features | Processing complexity | Mean fixation duration per fixation | H2d: There is no difference in mean fixation duration per fixation. | |
| Proportion of long fixations | H2e: There is no difference in the proportion of long fixations. | H4b: The proportion of long fixations is significantly lower than 50%, consistent with noncompensatory rules. | ||
| Processing depth | Percentage of predecisional fixation amount | H2f: There is no difference between the two types of choice in the percentage of information fixated before the decision. | H4c: It is not necessary to fixate on all option features before making a decision, consistent with noncompensatory rules. | |
| Processing direction | SM value | H2g: There is no difference between the two types of choice in the frequency distribution of alternative-based and attribute-based saccades. | H4d: Decisions are made using attribute-based strategies; that is, the SM values reflecting the direction of information search are below zero in both types of choice, consistent with attribute-based processing rules. | |
| Holistic process features | Holistic dynamic eye-movement process | Scanpaths | H2h: There is no difference in scanpaths. | H4e: More attribute-based processing patterns are qualitatively observed in typical trials, consistent with attribute-based processing rules. |
Table S2 Operational Hypotheses for Each Test Indicator
| Dimension | Decision property | Analysis indicator | Research hypothesis | |
|---|---|---|---|---|
| H2: Similarity between the two types of choice processes | H4: The two types of choice processes are more consistent with noncompensatory/attribute-based rules | |||
| Behavioral features | Decision time | H2a: There is no difference in decision time. | ||
| Proportion of choosing the LL/LH option | H2b: There is no difference in choice preference. | |||
| Hierarchical Bayesian model fitting | H2c: The two types of choice can be fitted by the same type of decision model. | H4a: Compared with discounting models, the two types of choice can be better fitted by nondiscounting models. | ||
| Local process features | Processing complexity | Mean fixation duration per fixation | H2d: There is no difference in mean fixation duration per fixation. | |
| Proportion of long fixations | H2e: There is no difference in the proportion of long fixations. | H4b: The proportion of long fixations is significantly lower than 50%, consistent with noncompensatory rules. | ||
| Processing depth | Percentage of predecisional fixation amount | H2f: There is no difference between the two types of choice in the percentage of information fixated before the decision. | H4c: It is not necessary to fixate on all option features before making a decision, consistent with noncompensatory rules. | |
| Processing direction | SM value | H2g: There is no difference between the two types of choice in the frequency distribution of alternative-based and attribute-based saccades. | H4d: Decisions are made using attribute-based strategies; that is, the SM values reflecting the direction of information search are below zero in both types of choice, consistent with attribute-based processing rules. | |
| Holistic process features | Holistic dynamic eye-movement process | Scanpaths | H2h: There is no difference in scanpaths. | H4e: More attribute-based processing patterns are qualitatively observed in typical trials, consistent with attribute-based processing rules. |
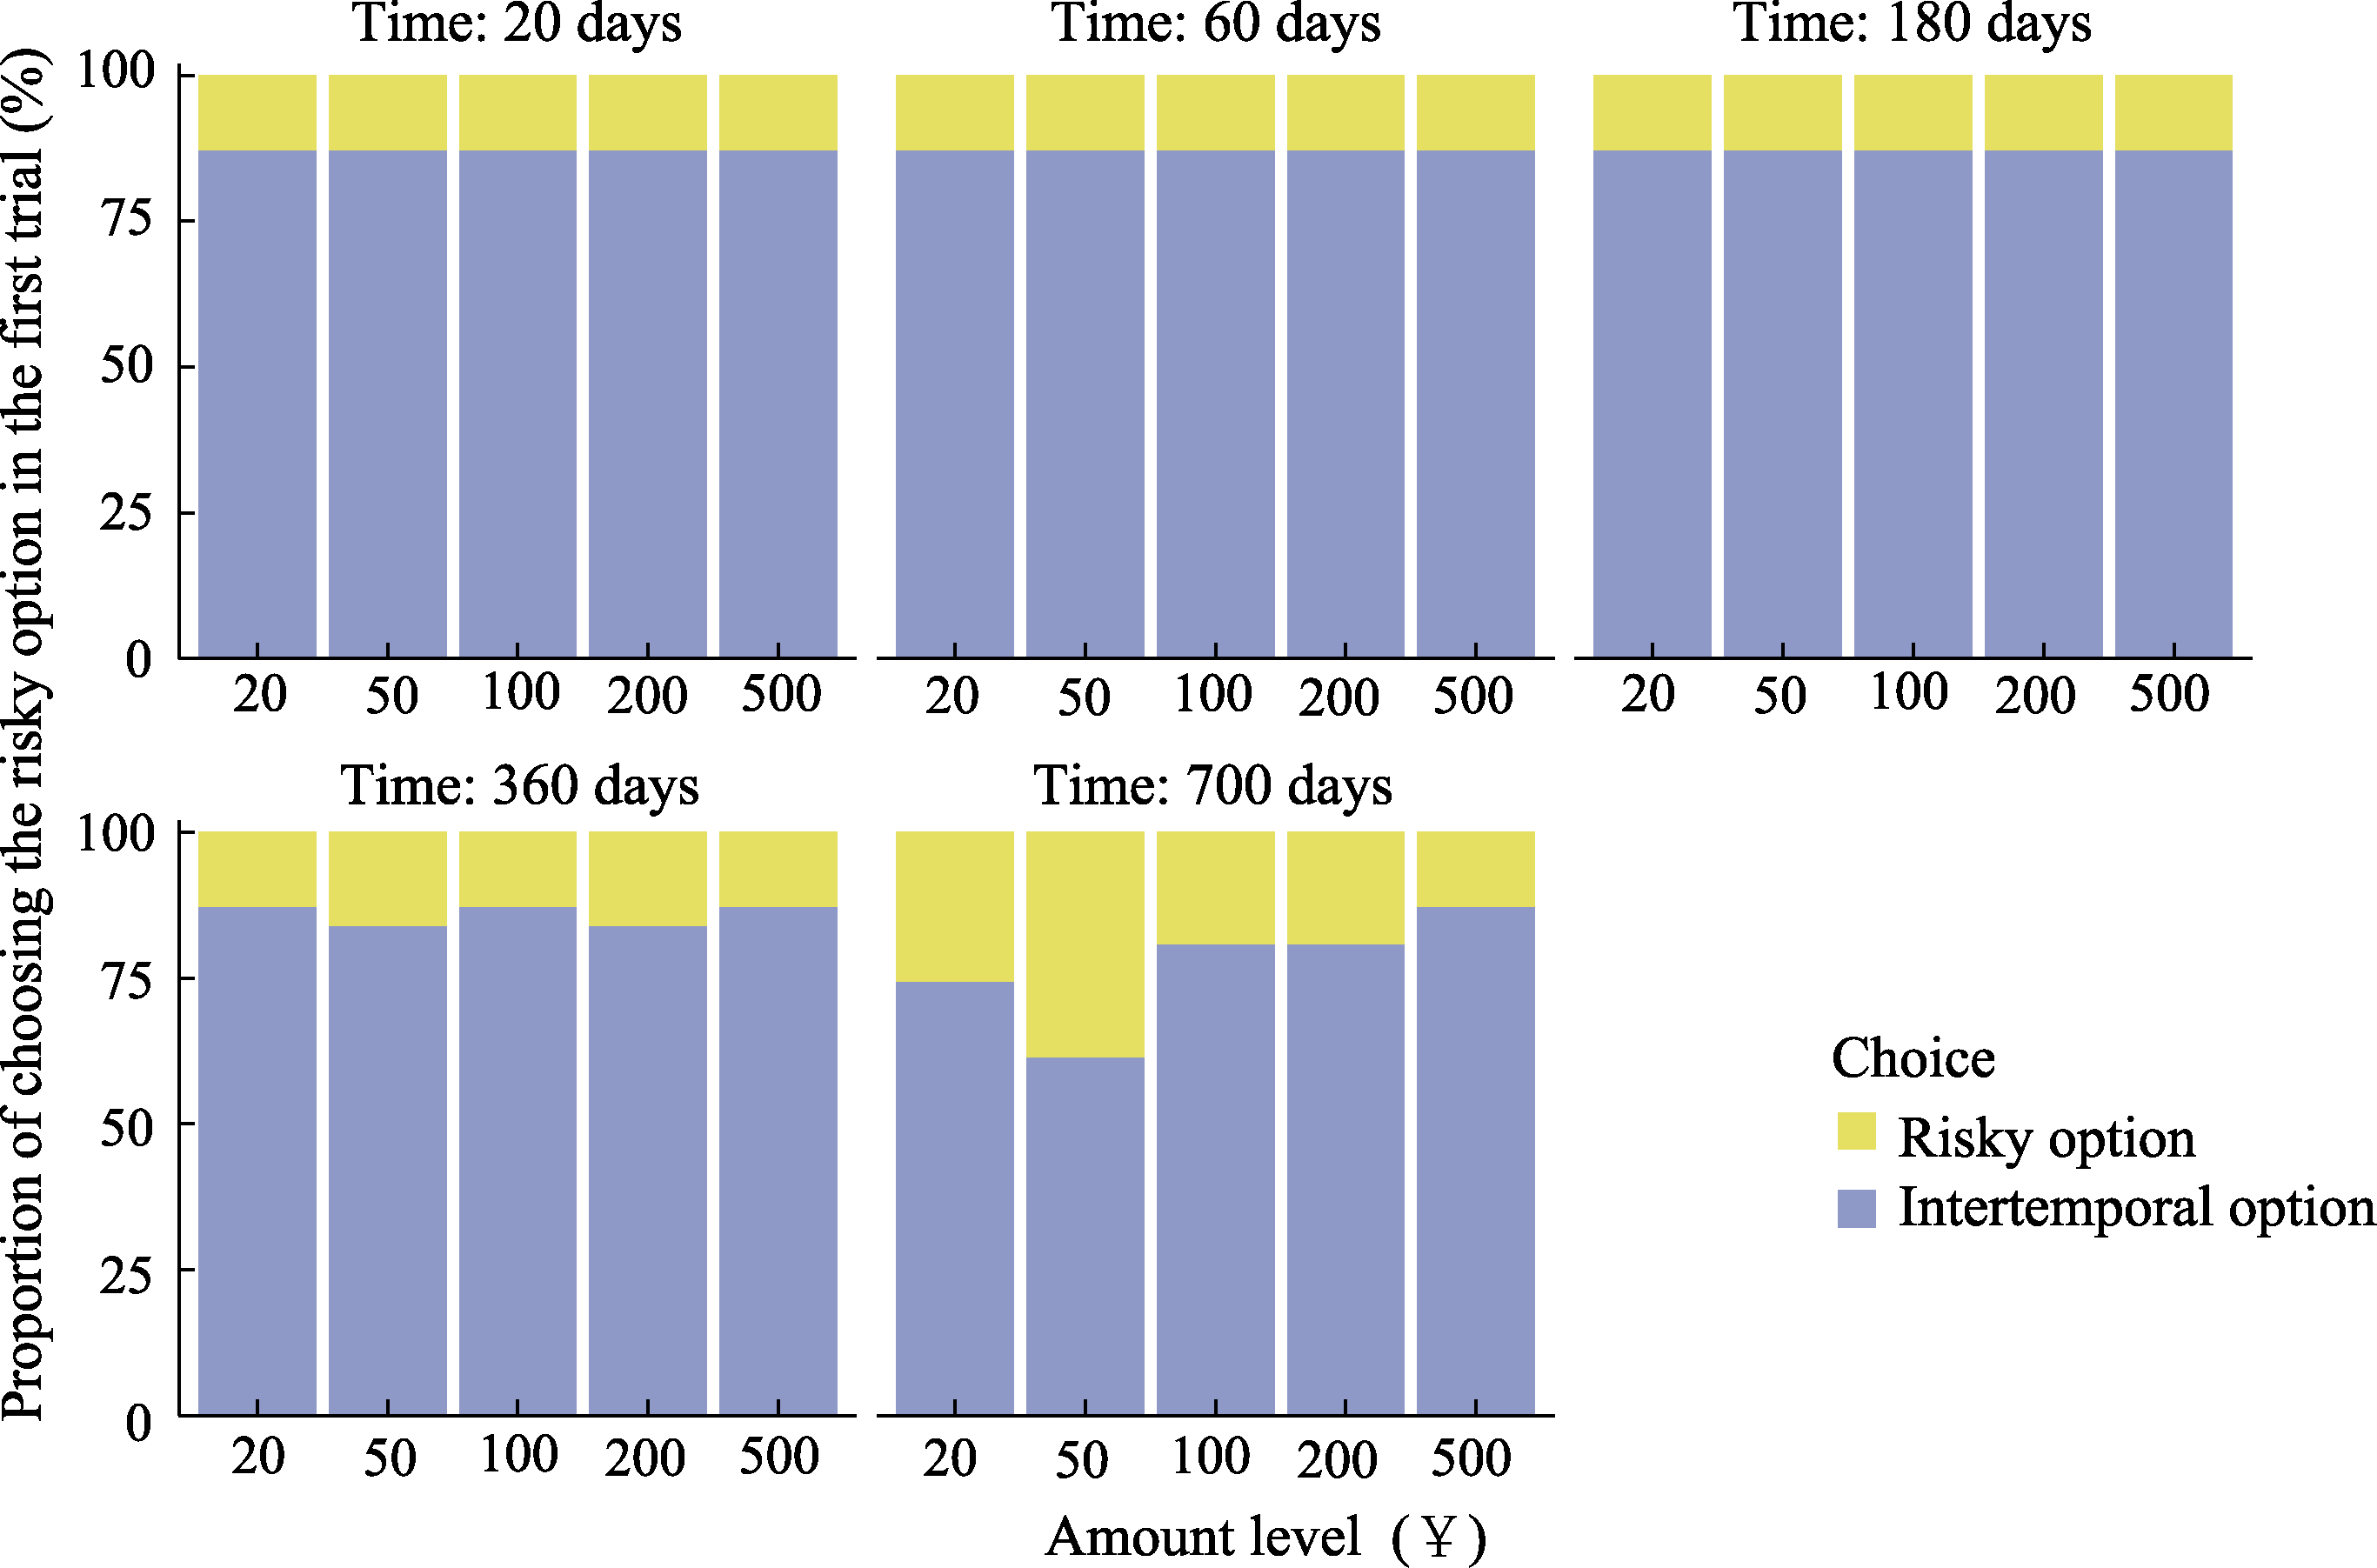
Figure S1 Proportion of Choosing the Risky Option in the First Trial of Stage 1 in Study 1 (%)
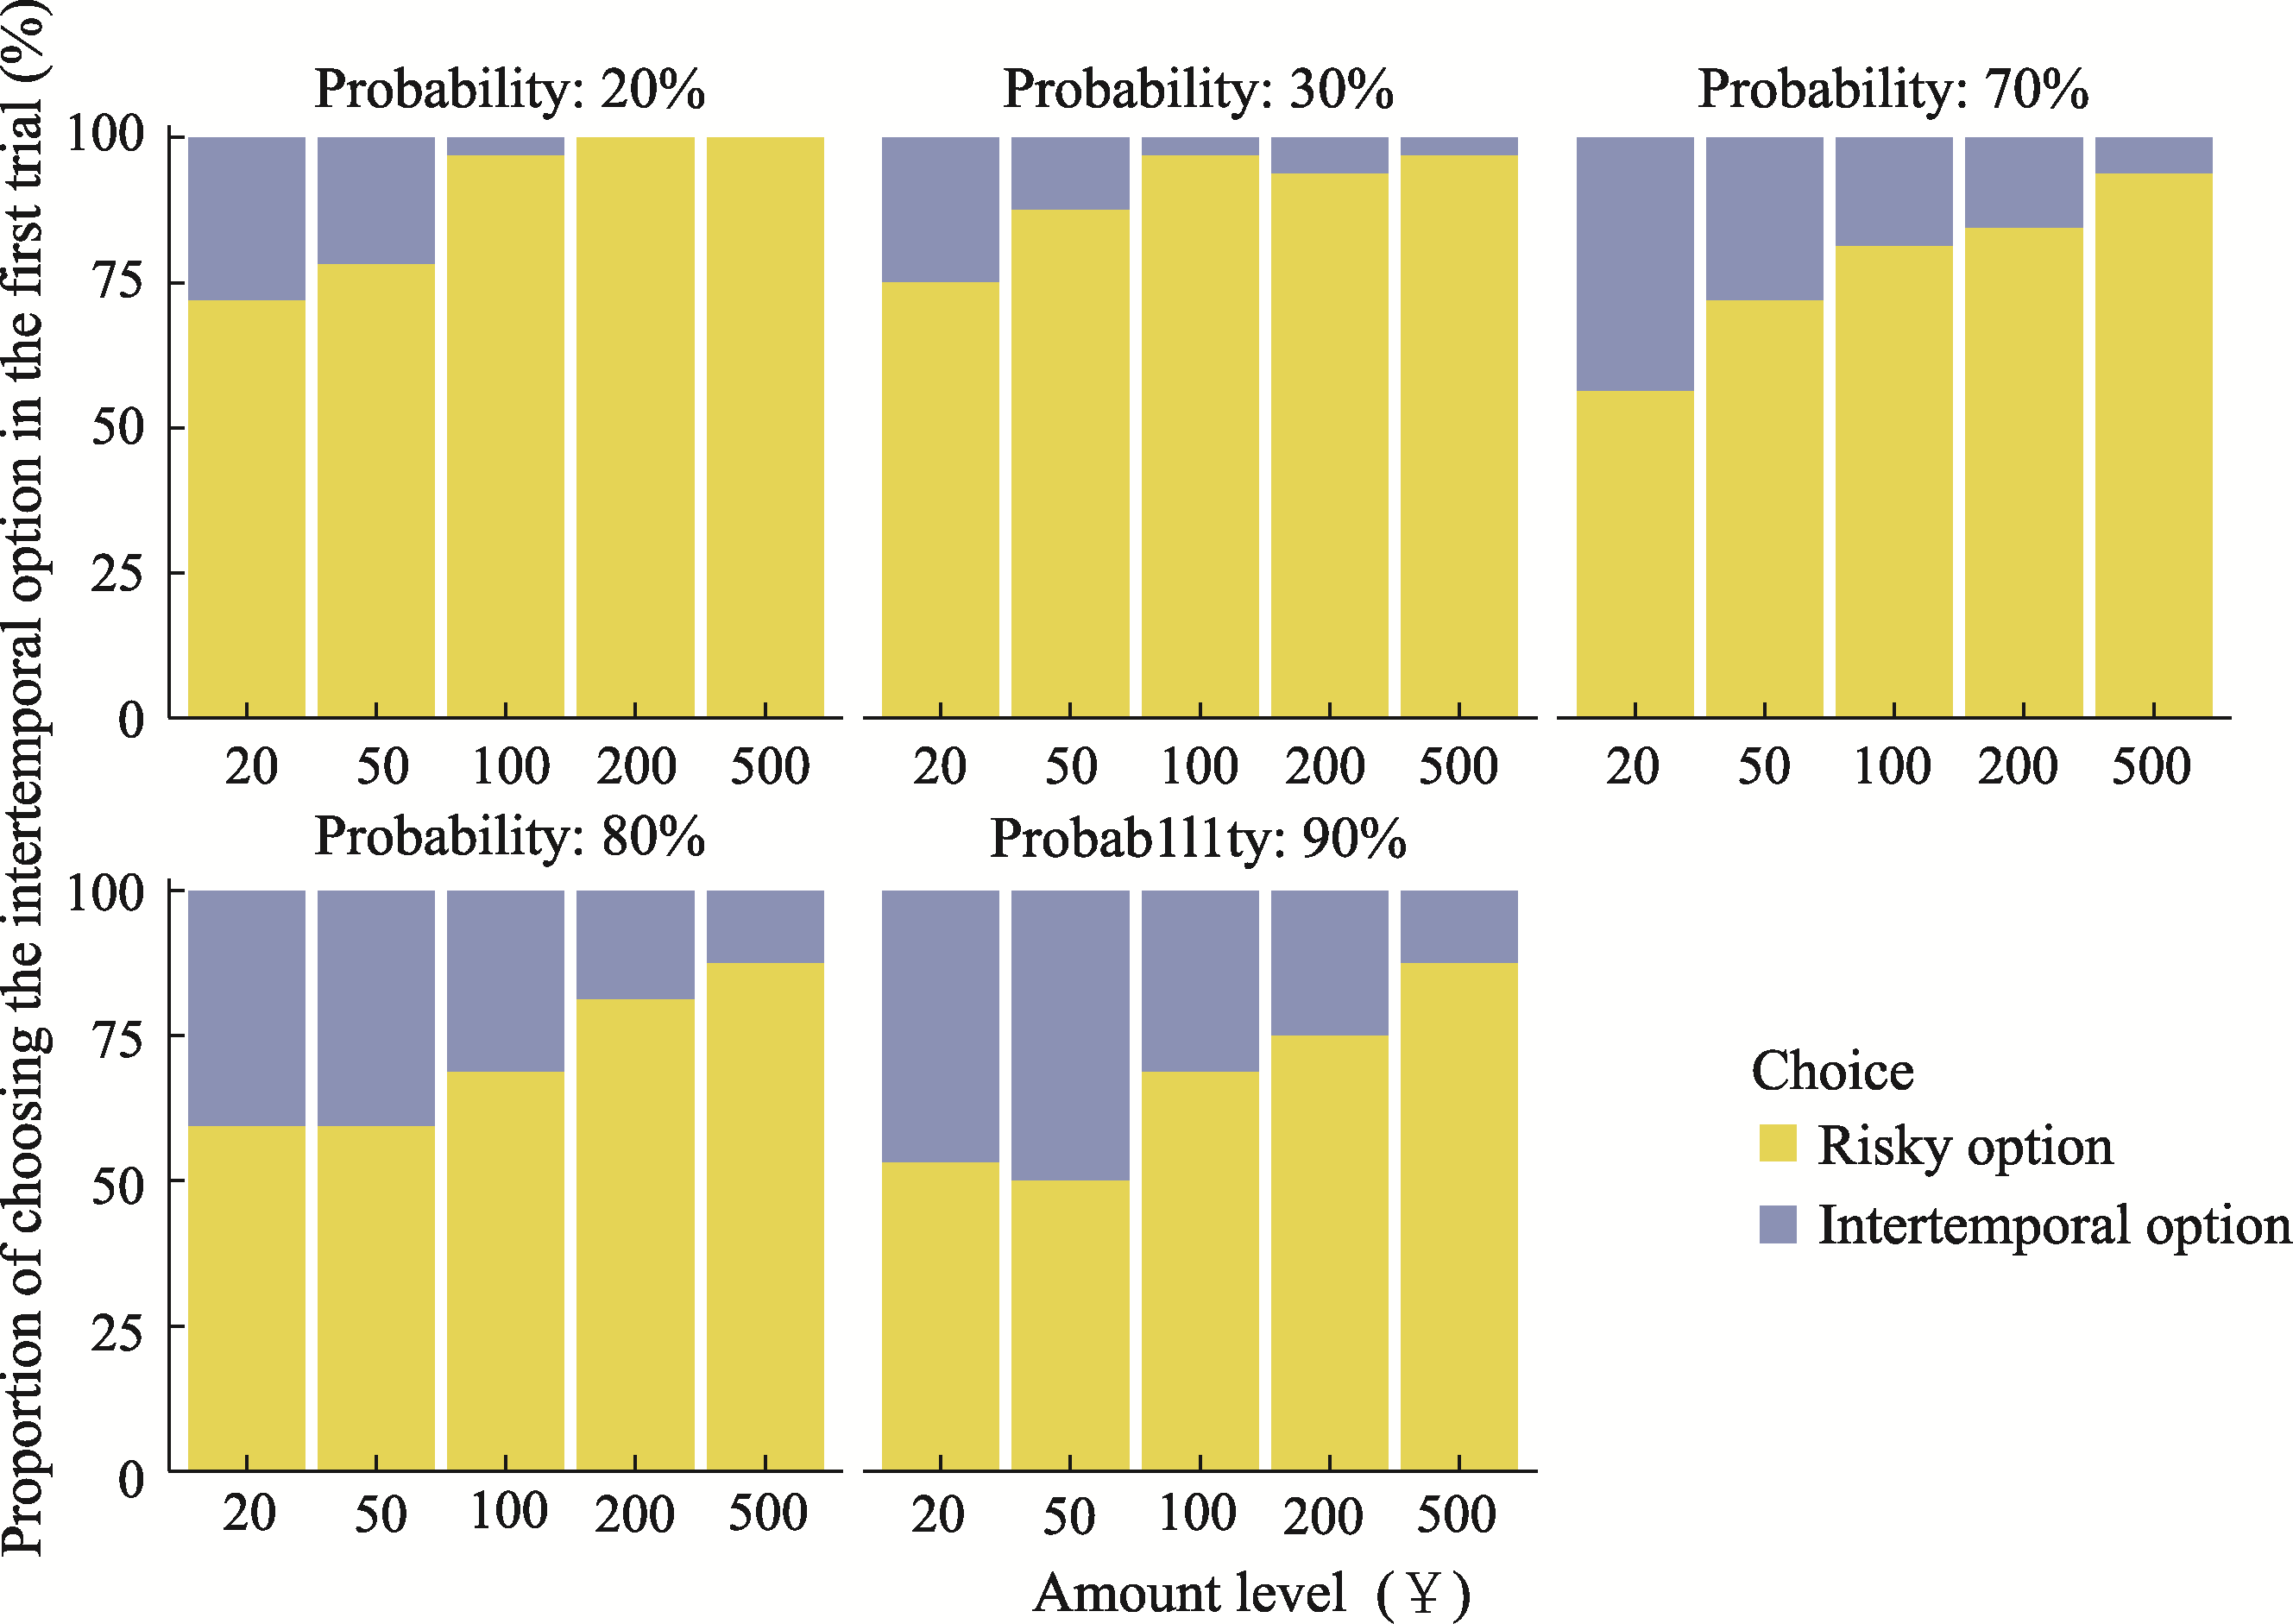
Figure S2 Proportion of Choosing the Intertemporal Option in the First Trial of Stage 1 in Study 2 (%)
| Risky choice task | Intertemporal choice task | ||||||
|---|---|---|---|---|---|---|---|
| Option A | Option B | Option A | Option B | ||||
| Probability (%) | Amount (¥) | Probability (%) | Amount (¥) | Time (days) | Amount (¥) | Time (days) | Amount (¥) |
| 78 | 500 | 90 | 200 | 180 | 200 | 60 | 100 |
| 24 | 100 | 74 | 50 | 700 | 500 | 20 | 20 |
| 60 | 500 | 90 | 200 | 700 | 50 | 20 | 20 |
| 78 | 500 | 82 | 50 | 700 | 500 | 20 | 200 |
| 82 | 500 | 90 | 200 | 700 | 50 | 360 | 20 |
| 53 | 100 | 82 | 50 | 360 | 100 | 20 | 50 |
| 10 | 50 | 30 | 20 | 360 | 500 | 20 | 50 |
| 60 | 50 | 76 | 20 | 700 | 50 | 60 | 20 |
| 53 | 100 | 76 | 20 | 360 | 100 | 60 | 50 |
| 60 | 500 | 76 | 20 | 700 | 500 | 20 | 100 |
| 26 | 200 | 82 | 50 | 180 | 200 | 20 | 50 |
| 26 | 200 | 82 | 100 | 700 | 500 | 20 | 50 |
| 60 | 500 | 84 | 200 | 360 | 200 | 180 | 100 |
| 26 | 50 | 60 | 20 | 360 | 500 | 20 | 100 |
| 10 | 50 | 49 | 20 | 700 | 200 | 20 | 50 |
| 53 | 100 | 60 | 20 | 700 | 500 | 60 | 100 |
| 60 | 50 | 60 | 20 | 180 | 100 | 20 | 20 |
| 80 | 200 | 82 | 50 | 700 | 100 | 20 | 20 |
| 76 | 20 | 10 | 50 | 700 | 200 | 60 | 100 |
| 82 | 100 | 82 | 200 | 700 | 500 | 60 | 200 |
| 82 | 100 | 60 | 500 | 700 | 200 | 20 | 20 |
| 76 | 20 | 80 | 200 | 360 | 100 | 60 | 20 |
| 82 | 100 | 82 | 500 | 700 | 100 | 20 | 50 |
| 53 | 100 | 26 | 200 | 700 | 200 | 20 | 100 |
| 84 | 200 | 78 | 500 | 180 | 50 | 60 | 20 |
| 69 | 100 | 80 | 200 | 20 | 100 | 180 | 200 |
| 74 | 50 | 26 | 200 | 20 | 100 | 180 | 500 |
| 60 | 20 | 10 | 50 | 360 | 100 | 700 | 200 |
| 74 | 50 | 53 | 100 | 20 | 20 | 360 | 200 |
| 69 | 100 | 82 | 200 | 20 | 20 | 360 | 100 |
| 58 | 100 | 26 | 200 | 20 | 100 | 360 | 200 |
| 82 | 100 | 80 | 200 | 60 | 50 | 700 | 100 |
| 69 | 100 | 26 | 200 | 60 | 50 | 700 | 200 |
| 76 | 20 | 26 | 50 | 60 | 200 | 360 | 500 |
| 82 | 50 | 24 | 100 | 20 | 200 | 360 | 500 |
| 82 | 50 | 58 | 100 | 60 | 100 | 360 | 200 |
| 82 | 100 | 78 | 500 | 180 | 100 | 700 | 200 |
| 74 | 50 | 80 | 200 | 20 | 200 | 180 | 500 |
| 58 | 100 | 80 | 200 | 20 | 20 | 180 | 50 |
| 69 | 100 | 60 | 500 | 60 | 50 | 360 | 200 |
| 60 | 20 | 24 | 100 | 60 | 20 | 700 | 200 |
| 76 | 20 | 58 | 100 | 60 | 20 | 700 | 100 |
| 82 | 50 | 82 | 200 | 60 | 20 | 360 | 50 |
| 76 | 20 | 26 | 200 | 180 | 20 | 700 | 50 |
| 76 | 20 | 24 | 100 | 20 | 50 | 360 | 200 |
| 82 | 50 | 60 | 500 | 20 | 50 | 180 | 100 |
| 30 | 20 | 26 | 200 | 20 | 20 | 360 | 50 |
Table S3 Experimental Materials in Stage 2 of Study 1 (Participant A)
| Risky choice task | Intertemporal choice task | ||||||
|---|---|---|---|---|---|---|---|
| Option A | Option B | Option A | Option B | ||||
| Probability (%) | Amount (¥) | Probability (%) | Amount (¥) | Time (days) | Amount (¥) | Time (days) | Amount (¥) |
| 78 | 500 | 90 | 200 | 180 | 200 | 60 | 100 |
| 24 | 100 | 74 | 50 | 700 | 500 | 20 | 20 |
| 60 | 500 | 90 | 200 | 700 | 50 | 20 | 20 |
| 78 | 500 | 82 | 50 | 700 | 500 | 20 | 200 |
| 82 | 500 | 90 | 200 | 700 | 50 | 360 | 20 |
| 53 | 100 | 82 | 50 | 360 | 100 | 20 | 50 |
| 10 | 50 | 30 | 20 | 360 | 500 | 20 | 50 |
| 60 | 50 | 76 | 20 | 700 | 50 | 60 | 20 |
| 53 | 100 | 76 | 20 | 360 | 100 | 60 | 50 |
| 60 | 500 | 76 | 20 | 700 | 500 | 20 | 100 |
| 26 | 200 | 82 | 50 | 180 | 200 | 20 | 50 |
| 26 | 200 | 82 | 100 | 700 | 500 | 20 | 50 |
| 60 | 500 | 84 | 200 | 360 | 200 | 180 | 100 |
| 26 | 50 | 60 | 20 | 360 | 500 | 20 | 100 |
| 10 | 50 | 49 | 20 | 700 | 200 | 20 | 50 |
| 53 | 100 | 60 | 20 | 700 | 500 | 60 | 100 |
| 60 | 50 | 60 | 20 | 180 | 100 | 20 | 20 |
| 80 | 200 | 82 | 50 | 700 | 100 | 20 | 20 |
| 76 | 20 | 10 | 50 | 700 | 200 | 60 | 100 |
| 82 | 100 | 82 | 200 | 700 | 500 | 60 | 200 |
| 82 | 100 | 60 | 500 | 700 | 200 | 20 | 20 |
| 76 | 20 | 80 | 200 | 360 | 100 | 60 | 20 |
| 82 | 100 | 82 | 500 | 700 | 100 | 20 | 50 |
| 53 | 100 | 26 | 200 | 700 | 200 | 20 | 100 |
| 84 | 200 | 78 | 500 | 180 | 50 | 60 | 20 |
| 69 | 100 | 80 | 200 | 20 | 100 | 180 | 200 |
| 74 | 50 | 26 | 200 | 20 | 100 | 180 | 500 |
| 60 | 20 | 10 | 50 | 360 | 100 | 700 | 200 |
| 74 | 50 | 53 | 100 | 20 | 20 | 360 | 200 |
| 69 | 100 | 82 | 200 | 20 | 20 | 360 | 100 |
| 58 | 100 | 26 | 200 | 20 | 100 | 360 | 200 |
| 82 | 100 | 80 | 200 | 60 | 50 | 700 | 100 |
| 69 | 100 | 26 | 200 | 60 | 50 | 700 | 200 |
| 76 | 20 | 26 | 50 | 60 | 200 | 360 | 500 |
| 82 | 50 | 24 | 100 | 20 | 200 | 360 | 500 |
| 82 | 50 | 58 | 100 | 60 | 100 | 360 | 200 |
| 82 | 100 | 78 | 500 | 180 | 100 | 700 | 200 |
| 74 | 50 | 80 | 200 | 20 | 200 | 180 | 500 |
| 58 | 100 | 80 | 200 | 20 | 20 | 180 | 50 |
| 69 | 100 | 60 | 500 | 60 | 50 | 360 | 200 |
| 60 | 20 | 24 | 100 | 60 | 20 | 700 | 200 |
| 76 | 20 | 58 | 100 | 60 | 20 | 700 | 100 |
| 82 | 50 | 82 | 200 | 60 | 20 | 360 | 50 |
| 76 | 20 | 26 | 200 | 180 | 20 | 700 | 50 |
| 76 | 20 | 24 | 100 | 20 | 50 | 360 | 200 |
| 82 | 50 | 60 | 500 | 20 | 50 | 180 | 100 |
| 30 | 20 | 26 | 200 | 20 | 20 | 360 | 50 |
| Risky choice task | Intertemporal choice task | ||||||||||||||
|---|---|---|---|---|---|---|---|---|---|---|---|---|---|---|---|
| Option A | Option B | Option A | Option B | ||||||||||||
| Outcome 1 | Outcome 2 | Outcome 1 | Outcome 2 | Outcome 1 | Outcome 2 | Outcome 1 | Outcome 2 | ||||||||
| Probability (%) | Amount (¥) | Probability (%) | Amount (¥) | Probability (%) | Amount (¥) | Probability (%) | Amount (¥) | Time (months) | Amount (¥) | Time (months) | Amount (¥) | Time (months) | Amount (¥) | Time (months) | Amount (¥) |
| 20 | 200 | 80 | 20 | 80 | 20 | 70 | 100 | 8.75 | 200 | 0.05 | 20 | 0.05 | 20 | 1.2 | 100 |
| 70 | 100 | 80 | 50 | 80 | 50 | 20 | 200 | 1.2 | 100 | 0.15 | 50 | 0.15 | 50 | 8.75 | 200 |
| 20 | 500 | 80 | 20 | 80 | 20 | 70 | 200 | 11.7 | 500 | 0.05 | 20 | 0.05 | 20 | 0.25 | 200 |
| 70 | 200 | 80 | 50 | 80 | 50 | 20 | 500 | 0.25 | 200 | 0.15 | 50 | 0.15 | 50 | 11.7 | 500 |
| 20 | 500 | 80 | 20 | 80 | 20 | 70 | 100 | 11.7 | 500 | 0.05 | 20 | 0.05 | 20 | 1.2 | 100 |
| 70 | 100 | 80 | 50 | 80 | 50 | 20 | 500 | 1.2 | 100 | 0.15 | 50 | 0.15 | 50 | 11.7 | 500 |
| 30 | 200 | 80 | 20 | 80 | 20 | 70 | 100 | 5 | 200 | 0.05 | 20 | 0.05 | 20 | 1.2 | 100 |
| 70 | 100 | 80 | 50 | 80 | 50 | 30 | 200 | 1.2 | 100 | 0.15 | 50 | 0.15 | 50 | 5 | 200 |
| 30 | 500 | 80 | 20 | 80 | 20 | 70 | 200 | 12.05 | 500 | 0.05 | 20 | 0.05 | 20 | 0.25 | 200 |
| 70 | 200 | 80 | 50 | 80 | 50 | 30 | 500 | 0.25 | 200 | 0.15 | 50 | 0.15 | 50 | 12.05 | 500 |
| 30 | 500 | 80 | 20 | 80 | 20 | 70 | 100 | 12.05 | 500 | 0.05 | 20 | 0.05 | 20 | 1.2 | 100 |
| 70 | 100 | 80 | 50 | 80 | 50 | 30 | 500 | 1.2 | 100 | 0.15 | 50 | 0.15 | 50 | 12.05 | 500 |
| 20 | 200 | 90 | 20 | 90 | 20 | 80 | 100 | 8.75 | 200 | 0.05 | 20 | 0.05 | 20 | 0.25 | 100 |
| 80 | 100 | 90 | 50 | 90 | 50 | 20 | 200 | 0.25 | 100 | 0.05 | 50 | 0.05 | 50 | 8.75 | 200 |
| 20 | 500 | 90 | 20 | 90 | 20 | 80 | 200 | 11.7 | 500 | 0.05 | 20 | 0.05 | 20 | 0.95 | 200 |
| 80 | 200 | 90 | 50 | 90 | 50 | 20 | 500 | 0.95 | 200 | 0.05 | 50 | 0.05 | 50 | 11.7 | 500 |
| 20 | 500 | 90 | 20 | 90 | 20 | 80 | 100 | 11.7 | 500 | 0.05 | 20 | 0.05 | 20 | 0.25 | 100 |
| 80 | 100 | 90 | 50 | 90 | 50 | 20 | 500 | 0.25 | 100 | 0.05 | 50 | 0.05 | 50 | 11.7 | 500 |
| 30 | 200 | 90 | 20 | 90 | 20 | 80 | 100 | 5 | 200 | 0.05 | 20 | 0.05 | 20 | 0.25 | 100 |
| 80 | 100 | 90 | 50 | 90 | 50 | 30 | 200 | 0.25 | 100 | 0.05 | 50 | 0.05 | 50 | 5 | 200 |
| 30 | 500 | 90 | 20 | 90 | 20 | 80 | 200 | 12.05 | 500 | 0.05 | 20 | 0.05 | 20 | 0.95 | 200 |
| 80 | 200 | 90 | 50 | 90 | 50 | 30 | 500 | 0.95 | 200 | 0.05 | 50 | 0.05 | 50 | 12.05 | 500 |
| 30 | 500 | 90 | 20 | 90 | 20 | 80 | 100 | 12.05 | 500 | 0.05 | 20 | 0.05 | 20 | 0.25 | 100 |
| 80 | 100 | 90 | 50 | 90 | 50 | 30 | 500 | 0.25 | 100 | 0.05 | 50 | 0.05 | 50 | 12.05 | 500 |
Table S4 Experimental Materials in Stage 2 of Study 2 (Participant B)
| Risky choice task | Intertemporal choice task | ||||||||||||||
|---|---|---|---|---|---|---|---|---|---|---|---|---|---|---|---|
| Option A | Option B | Option A | Option B | ||||||||||||
| Outcome 1 | Outcome 2 | Outcome 1 | Outcome 2 | Outcome 1 | Outcome 2 | Outcome 1 | Outcome 2 | ||||||||
| Probability (%) | Amount (¥) | Probability (%) | Amount (¥) | Probability (%) | Amount (¥) | Probability (%) | Amount (¥) | Time (months) | Amount (¥) | Time (months) | Amount (¥) | Time (months) | Amount (¥) | Time (months) | Amount (¥) |
| 20 | 200 | 80 | 20 | 80 | 20 | 70 | 100 | 8.75 | 200 | 0.05 | 20 | 0.05 | 20 | 1.2 | 100 |
| 70 | 100 | 80 | 50 | 80 | 50 | 20 | 200 | 1.2 | 100 | 0.15 | 50 | 0.15 | 50 | 8.75 | 200 |
| 20 | 500 | 80 | 20 | 80 | 20 | 70 | 200 | 11.7 | 500 | 0.05 | 20 | 0.05 | 20 | 0.25 | 200 |
| 70 | 200 | 80 | 50 | 80 | 50 | 20 | 500 | 0.25 | 200 | 0.15 | 50 | 0.15 | 50 | 11.7 | 500 |
| 20 | 500 | 80 | 20 | 80 | 20 | 70 | 100 | 11.7 | 500 | 0.05 | 20 | 0.05 | 20 | 1.2 | 100 |
| 70 | 100 | 80 | 50 | 80 | 50 | 20 | 500 | 1.2 | 100 | 0.15 | 50 | 0.15 | 50 | 11.7 | 500 |
| 30 | 200 | 80 | 20 | 80 | 20 | 70 | 100 | 5 | 200 | 0.05 | 20 | 0.05 | 20 | 1.2 | 100 |
| 70 | 100 | 80 | 50 | 80 | 50 | 30 | 200 | 1.2 | 100 | 0.15 | 50 | 0.15 | 50 | 5 | 200 |
| 30 | 500 | 80 | 20 | 80 | 20 | 70 | 200 | 12.05 | 500 | 0.05 | 20 | 0.05 | 20 | 0.25 | 200 |
| 70 | 200 | 80 | 50 | 80 | 50 | 30 | 500 | 0.25 | 200 | 0.15 | 50 | 0.15 | 50 | 12.05 | 500 |
| 30 | 500 | 80 | 20 | 80 | 20 | 70 | 100 | 12.05 | 500 | 0.05 | 20 | 0.05 | 20 | 1.2 | 100 |
| 70 | 100 | 80 | 50 | 80 | 50 | 30 | 500 | 1.2 | 100 | 0.15 | 50 | 0.15 | 50 | 12.05 | 500 |
| 20 | 200 | 90 | 20 | 90 | 20 | 80 | 100 | 8.75 | 200 | 0.05 | 20 | 0.05 | 20 | 0.25 | 100 |
| 80 | 100 | 90 | 50 | 90 | 50 | 20 | 200 | 0.25 | 100 | 0.05 | 50 | 0.05 | 50 | 8.75 | 200 |
| 20 | 500 | 90 | 20 | 90 | 20 | 80 | 200 | 11.7 | 500 | 0.05 | 20 | 0.05 | 20 | 0.95 | 200 |
| 80 | 200 | 90 | 50 | 90 | 50 | 20 | 500 | 0.95 | 200 | 0.05 | 50 | 0.05 | 50 | 11.7 | 500 |
| 20 | 500 | 90 | 20 | 90 | 20 | 80 | 100 | 11.7 | 500 | 0.05 | 20 | 0.05 | 20 | 0.25 | 100 |
| 80 | 100 | 90 | 50 | 90 | 50 | 20 | 500 | 0.25 | 100 | 0.05 | 50 | 0.05 | 50 | 11.7 | 500 |
| 30 | 200 | 90 | 20 | 90 | 20 | 80 | 100 | 5 | 200 | 0.05 | 20 | 0.05 | 20 | 0.25 | 100 |
| 80 | 100 | 90 | 50 | 90 | 50 | 30 | 200 | 0.25 | 100 | 0.05 | 50 | 0.05 | 50 | 5 | 200 |
| 30 | 500 | 90 | 20 | 90 | 20 | 80 | 200 | 12.05 | 500 | 0.05 | 20 | 0.05 | 20 | 0.95 | 200 |
| 80 | 200 | 90 | 50 | 90 | 50 | 30 | 500 | 0.95 | 200 | 0.05 | 50 | 0.05 | 50 | 12.05 | 500 |
| 30 | 500 | 90 | 20 | 90 | 20 | 80 | 100 | 12.05 | 500 | 0.05 | 20 | 0.05 | 20 | 0.25 | 100 |
| 80 | 100 | 90 | 50 | 90 | 50 | 30 | 500 | 0.25 | 100 | 0.05 | 50 | 0.05 | 50 | 12.05 | 500 |
| Source of variation | F(df1, df2) | p | ηp2 |
|---|---|---|---|
| Age | F(9, 13) = 0.48 | 0.863 | 0.25 |
| Amount | F(2.28, 29.61) = 12.67 | < 0.001 | 0.494 |
| Time | F(1.22, 15.88) = 41.01 | < 0.001 | 0.759 |
| Age × Amount | F(20.50, 29.61) = 0.69 | 0.806 | 0.324 |
| Age × Time | F(11.00, 15.88) = 0.52 | 0.863 | 0.264 |
| Amount × Time | F(16, 208) = 3.59 | < 0.001 | 0.216 |
| Age × Amount × Time | F(144, 208) = 1.05 | 0.371 | 0.421 |
| Gender | F(1, 21) = 3.25 | 0.086 | 0.134 |
| Amount | F(2.57, 54.04) = 23.00 | < 0.001 | 0.523 |
| Time | F(1.51, 31.61) = 86.05 | < 0.001 | 0.804 |
| Gender × Amount | F(2.57, 54.04) = 0.56 | 0.62 | 0.026 |
| Gender × Time | F(1.51, 31.61) = 4.24 | 0.033 | 0.168 |
| Amount × Time | F(5.76, 120.91) = 5.77 | < 0.001 | 0.216 |
| Gender × Amount × Time | F(5.76, 120.91) = 0.79 | 0.574 | 0.036 |
| Major | F(4, 18) = 1.09 | 0.392 | 0.195 |
| Amount | F(2.47, 44.41) = 11.99 | < 0.001 | 0.4 |
| Time | F(1.48, 26.61) = 27.31 | < 0.001 | 0.603 |
| Major × Amount | F(9.87, 44.41) = 1.19 | 0.325 | 0.209 |
| Major × Time | F(5.91, 26.61) = 0.74 | 0.623 | 0.141 |
| Amount × Time | F(5.33, 96.02) = 1.85 | 0.106 | 0.093 |
| Major × Amount × Time | F(21.34, 96.02) = 0.95 | 0.535 | 0.174 |
| Education level | F(2, 20) = 0.26 | 0.777 | 0.025 |
| Amount | F(2.51, 50.26) = 6.82 | < 0.001 | 0.254 |
| Time | F(1.41, 28.25) = 22.64 | < 0.001 | 0.531 |
| Education Level × Amount | F(5.03, 50.26) = 0.83 | 0.533 | 0.077 |
| Education Level × Time | F(2.82, 28.25) = 0.22 | 0.872 | 0.021 |
| Amount × Time | F(5.61, 112.27) = 2.88 | 0.014 | 0.126 |
| Education Level × Amount × Time | F(11.23, 112.27) = 1.01 | 0.443 | 0.092 |
| Income | F(3, 19) = 0.99 | 0.419 | 0.135 |
| Amount | F(2.40, 45.59) = 9.68 | < 0.001 | 0.337 |
| Time | F(1.37, 26.09) = 30.20 | < 0.001 | 0.614 |
| Income × Amount | F(7.20, 45.59) = 0.62 | 0.737 | 0.09 |
| Income × Time | F(4.12, 26.09) = 0.18 | 0.952 | 0.027 |
| Amount × Time | F(5.47, 103.94) = 2.59 | 0.026 | 0.12 |
| Income × Amount × Time | F(16.41, 103.94) = 0.81 | 0.669 | 0.114 |
Table S5 Repeated-Measures ANOVA Results for the Effects of Age, Gender, Major, Education Level, and Income on Equivalent Conversion Values in Study 1
| Source of variation | F(df1, df2) | p | ηp2 |
|---|---|---|---|
| Age | F(9, 13) = 0.48 | 0.863 | 0.25 |
| Amount | F(2.28, 29.61) = 12.67 | < 0.001 | 0.494 |
| Time | F(1.22, 15.88) = 41.01 | < 0.001 | 0.759 |
| Age × Amount | F(20.50, 29.61) = 0.69 | 0.806 | 0.324 |
| Age × Time | F(11.00, 15.88) = 0.52 | 0.863 | 0.264 |
| Amount × Time | F(16, 208) = 3.59 | < 0.001 | 0.216 |
| Age × Amount × Time | F(144, 208) = 1.05 | 0.371 | 0.421 |
| Gender | F(1, 21) = 3.25 | 0.086 | 0.134 |
| Amount | F(2.57, 54.04) = 23.00 | < 0.001 | 0.523 |
| Time | F(1.51, 31.61) = 86.05 | < 0.001 | 0.804 |
| Gender × Amount | F(2.57, 54.04) = 0.56 | 0.62 | 0.026 |
| Gender × Time | F(1.51, 31.61) = 4.24 | 0.033 | 0.168 |
| Amount × Time | F(5.76, 120.91) = 5.77 | < 0.001 | 0.216 |
| Gender × Amount × Time | F(5.76, 120.91) = 0.79 | 0.574 | 0.036 |
| Major | F(4, 18) = 1.09 | 0.392 | 0.195 |
| Amount | F(2.47, 44.41) = 11.99 | < 0.001 | 0.4 |
| Time | F(1.48, 26.61) = 27.31 | < 0.001 | 0.603 |
| Major × Amount | F(9.87, 44.41) = 1.19 | 0.325 | 0.209 |
| Major × Time | F(5.91, 26.61) = 0.74 | 0.623 | 0.141 |
| Amount × Time | F(5.33, 96.02) = 1.85 | 0.106 | 0.093 |
| Major × Amount × Time | F(21.34, 96.02) = 0.95 | 0.535 | 0.174 |
| Education level | F(2, 20) = 0.26 | 0.777 | 0.025 |
| Amount | F(2.51, 50.26) = 6.82 | < 0.001 | 0.254 |
| Time | F(1.41, 28.25) = 22.64 | < 0.001 | 0.531 |
| Education Level × Amount | F(5.03, 50.26) = 0.83 | 0.533 | 0.077 |
| Education Level × Time | F(2.82, 28.25) = 0.22 | 0.872 | 0.021 |
| Amount × Time | F(5.61, 112.27) = 2.88 | 0.014 | 0.126 |
| Education Level × Amount × Time | F(11.23, 112.27) = 1.01 | 0.443 | 0.092 |
| Income | F(3, 19) = 0.99 | 0.419 | 0.135 |
| Amount | F(2.40, 45.59) = 9.68 | < 0.001 | 0.337 |
| Time | F(1.37, 26.09) = 30.20 | < 0.001 | 0.614 |
| Income × Amount | F(7.20, 45.59) = 0.62 | 0.737 | 0.09 |
| Income × Time | F(4.12, 26.09) = 0.18 | 0.952 | 0.027 |
| Amount × Time | F(5.47, 103.94) = 2.59 | 0.026 | 0.12 |
| Income × Amount × Time | F(16.41, 103.94) = 0.81 | 0.669 | 0.114 |
| Source of variation | F(df1, df2) | p | ηp2 |
|---|---|---|---|
| RP | F(1, 21) = 0.60 | 0.445 | 0.028 |
| Amount | F(2.70, 56.66) = 9.50 | < 0.001 | 0.311 |
| Time | F(1.43, 30.09) = 44.96 | < 0.001 | 0.682 |
| RP × Amount | F(2.70, 56.66) = 1.19 | 0.32 | 0.054 |
| RP × Time | F(1.43, 30.09) = 0.39 | 0.613 | 0.018 |
| Amount × Time | F(5.71, 119.82) = 2.48 | 0.029 | 0.106 |
| RP × Amount × Time | F(5.71, 119.82) = 1.67 | 0.137 | 0.074 |
| BIS | F(1, 21) = 0.11 | 0.742 | 0.005 |
| Amount | F(2.35, 49.36) = 24.18 | < 0.001 | 0.535 |
| Time | F(1.46, 30.64) = 71.74 | < 0.001 | 0.774 |
| BIS × Amount | F(2.35, 49.36) = 2.17 | 0.117 | 0.094 |
| BIS × Time | F(1.46, 30.64) = 0.70 | 0.462 | 0.032 |
| Amount × Time | F(5.83, 122.37) = 5.47 | < 0.001 | 0.207 |
| BIS × Amount × Time | F(5.83, 122.37) = 0.68 | 0.665 | 0.031 |
| NS | F(1, 21) = 0.60 | 0.445 | 0.028 |
| Amount | F(2.70, 56.66) = 9.50 | < 0.001 | 0.311 |
| Time | F(1.43, 30.09) = 44.96 | < 0.001 | 0.682 |
| NS × Amount | F(2.70, 56.66) = 1.19 | 0.32 | 0.054 |
| NS × Time | F(1.43, 30.09) = 0.39 | 0.613 | 0.018 |
| Amount × Time | F(5.71, 119.82) = 2.48 | 0.029 | 0.106 |
| NS × Amount × Time | F(5.71, 119.82) = 1.67 | 0.137 | 0.074 |
| CRT | F(1, 21) = 0.24 | 0.629 | 0.011 |
| Amount | F(2.74, 57.47) = 19.11 | < 0.001 | 0.476 |
| Time | F(1.43, 30.08) = 63.11 | < 0.001 | 0.75 |
| CRT × Amount | F(2.74, 57.47) = 1.34 | 0.271 | 0.06 |
| CRT × Time | F(1.43, 30.08) = 0.09 | 0.853 | 0.004 |
| Amount × Time | F(5.89, 123.74) = 4.60 | < 0.001 | 0.18 |
| CRT × Amount × Time | F(5.89, 123.74) = 0.56 | 0.755 | 0.026 |
Table S6 Repeated-Measures ANOVA Results for the Effects of Risk Propensity (RP), Impulsivity (BIS), Numeracy (NS), and Cognitive Reflection (CRT) on Equivalent Conversion Values in Study 1
| Source of variation | F(df1, df2) | p | ηp2 |
|---|---|---|---|
| RP | F(1, 21) = 0.60 | 0.445 | 0.028 |
| Amount | F(2.70, 56.66) = 9.50 | < 0.001 | 0.311 |
| Time | F(1.43, 30.09) = 44.96 | < 0.001 | 0.682 |
| RP × Amount | F(2.70, 56.66) = 1.19 | 0.32 | 0.054 |
| RP × Time | F(1.43, 30.09) = 0.39 | 0.613 | 0.018 |
| Amount × Time | F(5.71, 119.82) = 2.48 | 0.029 | 0.106 |
| RP × Amount × Time | F(5.71, 119.82) = 1.67 | 0.137 | 0.074 |
| BIS | F(1, 21) = 0.11 | 0.742 | 0.005 |
| Amount | F(2.35, 49.36) = 24.18 | < 0.001 | 0.535 |
| Time | F(1.46, 30.64) = 71.74 | < 0.001 | 0.774 |
| BIS × Amount | F(2.35, 49.36) = 2.17 | 0.117 | 0.094 |
| BIS × Time | F(1.46, 30.64) = 0.70 | 0.462 | 0.032 |
| Amount × Time | F(5.83, 122.37) = 5.47 | < 0.001 | 0.207 |
| BIS × Amount × Time | F(5.83, 122.37) = 0.68 | 0.665 | 0.031 |
| NS | F(1, 21) = 0.60 | 0.445 | 0.028 |
| Amount | F(2.70, 56.66) = 9.50 | < 0.001 | 0.311 |
| Time | F(1.43, 30.09) = 44.96 | < 0.001 | 0.682 |
| NS × Amount | F(2.70, 56.66) = 1.19 | 0.32 | 0.054 |
| NS × Time | F(1.43, 30.09) = 0.39 | 0.613 | 0.018 |
| Amount × Time | F(5.71, 119.82) = 2.48 | 0.029 | 0.106 |
| NS × Amount × Time | F(5.71, 119.82) = 1.67 | 0.137 | 0.074 |
| CRT | F(1, 21) = 0.24 | 0.629 | 0.011 |
| Amount | F(2.74, 57.47) = 19.11 | < 0.001 | 0.476 |
| Time | F(1.43, 30.08) = 63.11 | < 0.001 | 0.75 |
| CRT × Amount | F(2.74, 57.47) = 1.34 | 0.271 | 0.06 |
| CRT × Time | F(1.43, 30.08) = 0.09 | 0.853 | 0.004 |
| Amount × Time | F(5.89, 123.74) = 4.60 | < 0.001 | 0.18 |
| CRT × Amount × Time | F(5.89, 123.74) = 0.56 | 0.755 | 0.026 |
| Source of variation | F(df1, df2) | p | ηp2 |
|---|---|---|---|
| RP | F(1, 30) = 0.04 | 0.846 | 0.001 |
| Amount | F(1.61, 48.43) = 47.52 | < 0.001 | 0.613 |
| Probability | F(1.60, 48.08) = 28.48 | < 0.001 | 0.487 |
| RP × Amount | F(1.61, 48.43) = 0.49 | 0.573 | 0.016 |
| RP × Probability | F(1.60, 48.08) = 0.15 | 0.819 | 0.005 |
| Amount × Probability | F(6.97, 209.19) = 3.86 | < 0.001 | 0.114 |
| RP × Amount × Probability | F(6.97, 209.19) = 0.87 | 0.532 | 0.028 |
| BIS | F(1, 30) = 4.85 | 0.036 | 0.139 |
| Amount | F(1.79, 53.63) = 58.14 | < 0.001 | 0.660 |
| Probability | F(1.58, 47.48) = 28.74 | < 0.001 | 0.489 |
| BIS × Amount | F(1.79, 53.63) = 7.31 | 0.002 | 0.196 |
| BIS × Probability | F(1.58, 47.48) = 0.42 | 0.611 | 0.014 |
| Amount × Probability | F(7.12, 213.59) = 3.97 | < 0.001 | 0.117 |
| BIS × Amount × Probability | F(7.12, 213.59) = 1.78 | 0.092 | 0.056 |
| NS | F(1, 30) = 1.86 | 0.182 | 0.058 |
| Amount | F(1.60, 48.07) = 11.62 | < 0.001 | 0.279 |
| Probability | F(1.60, 48.06) = 9.69 | < 0.001 | 0.244 |
| NS × Amount | F(1.60, 48.07) = 1.14 | 0.318 | 0.037 |
| NS × Probability | F(1.60, 48.06) = 0.11 | 0.849 | 0.004 |
| Amount × Probability | F(7.09, 212.67) = 3.54 | 0.001 | 0.106 |
| NS × Amount × Probability | F(7.09, 212.67) = 1.33 | 0.236 | 0.043 |
| CRT | F(1, 30) = 0.50 | 0.485 | 0.016 |
| Amount | F(1.59, 47.79) = 45.76 | < 0.001 | 0.593 |
| Probability | F(1.64, 49.24) = 23.30 | < 0.001 | 0.437 |
| CRT × Amount | F(1.59, 47.79) = 0.30 | 0.694 | 0.01 |
| CRT × Probability | F(1.64, 49.24) = 1.76 | 0.188 | 0.055 |
| Amount × Probability | F(6.96, 208.72) = 3.29 | 0.002 | 0.099 |
| CRT × Amount × Probability | F(6.96, 208.72) = 0.85 | 0.543 | 0.028 |
Table S7 Repeated-Measures ANOVA Results for the Effects of Risk Propensity (RP), Impulsivity (BIS), Numeracy (NS), and Cognitive Reflection (CRT) on Equivalent Conversion Values in Study 2
| Source of variation | F(df1, df2) | p | ηp2 |
|---|---|---|---|
| RP | F(1, 30) = 0.04 | 0.846 | 0.001 |
| Amount | F(1.61, 48.43) = 47.52 | < 0.001 | 0.613 |
| Probability | F(1.60, 48.08) = 28.48 | < 0.001 | 0.487 |
| RP × Amount | F(1.61, 48.43) = 0.49 | 0.573 | 0.016 |
| RP × Probability | F(1.60, 48.08) = 0.15 | 0.819 | 0.005 |
| Amount × Probability | F(6.97, 209.19) = 3.86 | < 0.001 | 0.114 |
| RP × Amount × Probability | F(6.97, 209.19) = 0.87 | 0.532 | 0.028 |
| BIS | F(1, 30) = 4.85 | 0.036 | 0.139 |
| Amount | F(1.79, 53.63) = 58.14 | < 0.001 | 0.660 |
| Probability | F(1.58, 47.48) = 28.74 | < 0.001 | 0.489 |
| BIS × Amount | F(1.79, 53.63) = 7.31 | 0.002 | 0.196 |
| BIS × Probability | F(1.58, 47.48) = 0.42 | 0.611 | 0.014 |
| Amount × Probability | F(7.12, 213.59) = 3.97 | < 0.001 | 0.117 |
| BIS × Amount × Probability | F(7.12, 213.59) = 1.78 | 0.092 | 0.056 |
| NS | F(1, 30) = 1.86 | 0.182 | 0.058 |
| Amount | F(1.60, 48.07) = 11.62 | < 0.001 | 0.279 |
| Probability | F(1.60, 48.06) = 9.69 | < 0.001 | 0.244 |
| NS × Amount | F(1.60, 48.07) = 1.14 | 0.318 | 0.037 |
| NS × Probability | F(1.60, 48.06) = 0.11 | 0.849 | 0.004 |
| Amount × Probability | F(7.09, 212.67) = 3.54 | 0.001 | 0.106 |
| NS × Amount × Probability | F(7.09, 212.67) = 1.33 | 0.236 | 0.043 |
| CRT | F(1, 30) = 0.50 | 0.485 | 0.016 |
| Amount | F(1.59, 47.79) = 45.76 | < 0.001 | 0.593 |
| Probability | F(1.64, 49.24) = 23.30 | < 0.001 | 0.437 |
| CRT × Amount | F(1.59, 47.79) = 0.30 | 0.694 | 0.01 |
| CRT × Probability | F(1.64, 49.24) = 1.76 | 0.188 | 0.055 |
| Amount × Probability | F(6.96, 208.72) = 3.29 | 0.002 | 0.099 |
| CRT × Amount × Probability | F(6.96, 208.72) = 0.85 | 0.543 | 0.028 |
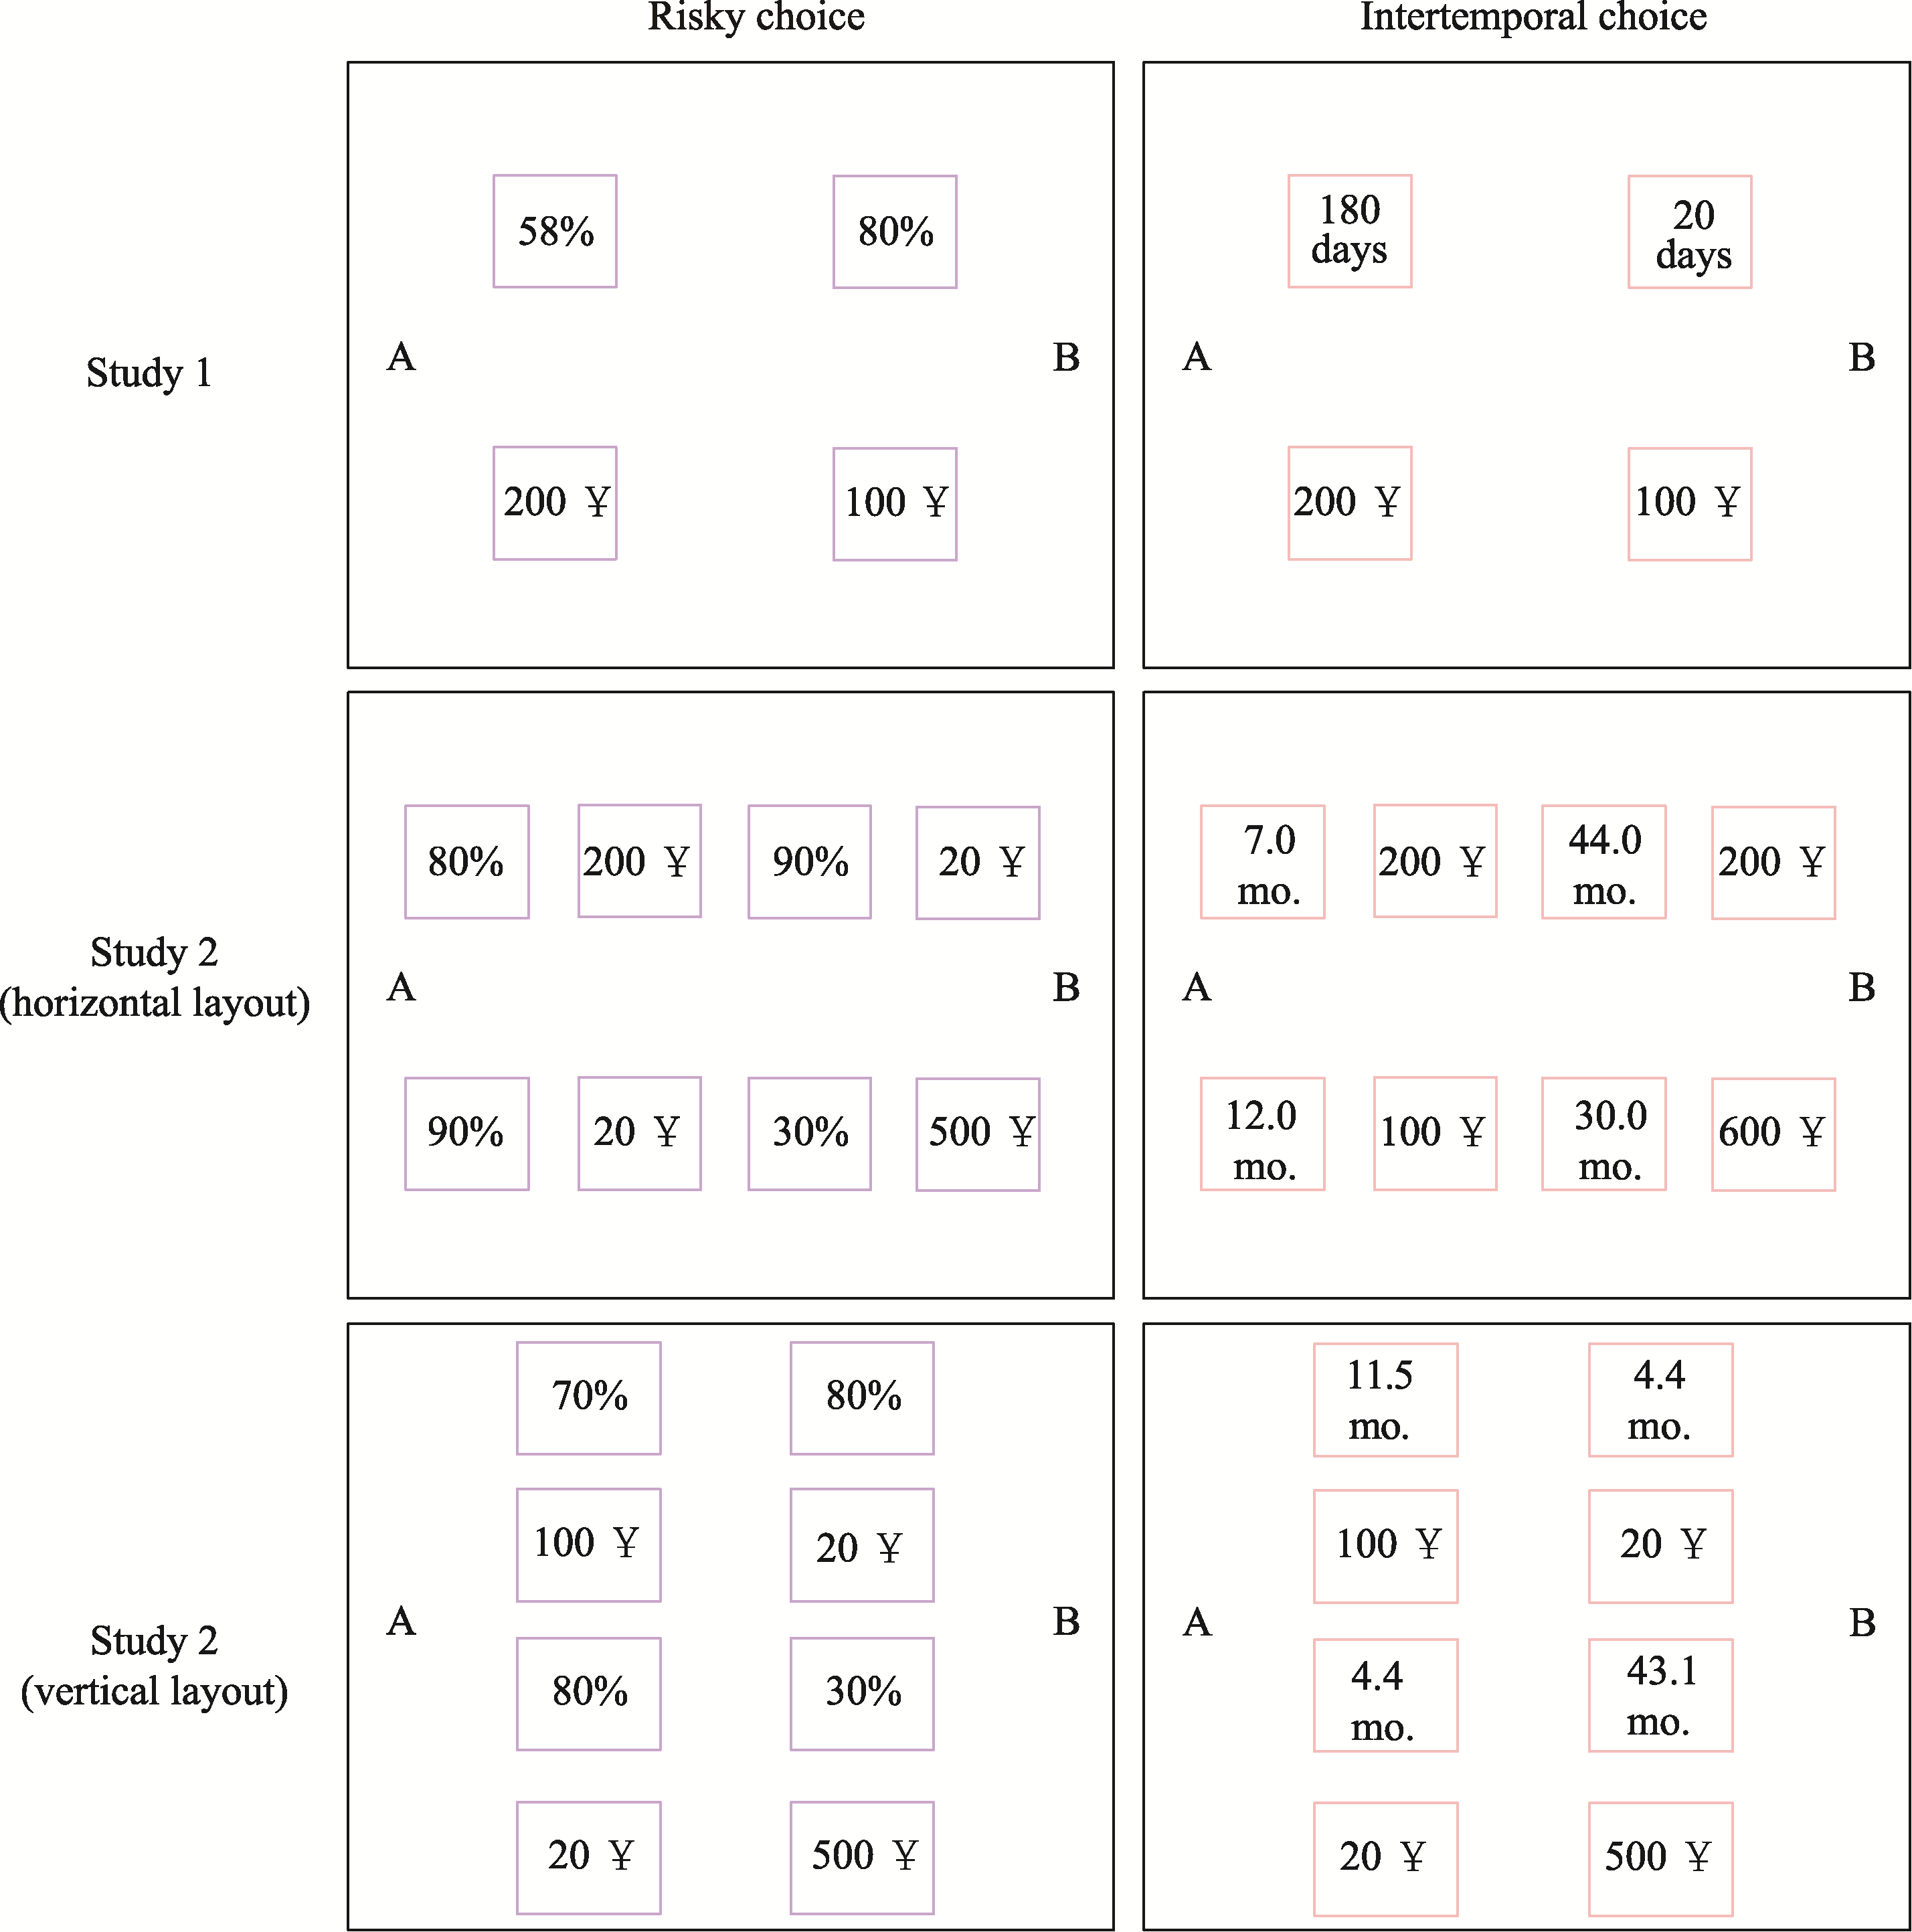
Figure S3. Schematic Illustration of the Eye-Tracking Experimental Materials in Studies 1 and 2 Note. The rectangles in the figure represent the areas of interest (AOIs), which covered all attributes of the options. These rectangles were used only for eye-tracking data analysis and were not visible to participants during the experiment.
| Decision outcome/process | Analysis indicator | Choice type | M | SE | t(30) | p | ||||
|---|---|---|---|---|---|---|---|---|---|---|
| Excluded | Not excluded | Excluded | Not excluded | Excluded | Not excluded | Excluded | Not excluded | |||
| Decision time | Decision time | RC | 2.56 | 2.68 | 0.12 | 0.15 | -2.80 | -1.99 | 0.01 | 0.06 |
| IC | 2.85 | 2.93 | 0.16 | 0.18 | ||||||
| Choice preference | Proportion of choosing the LL/LH option | RC | 67.68% | 67.16% | 3.66% | 3.61% | 8.97 | 9.08 | < 0.001 | < 0.001 |
| IC | 28.32% | 28.64% | 4.46% | 4.44% | ||||||
| Processing complexity | Mean fixation duration per fixation | RC | 208.64 | 210 | 5.39 | 5.44 | -2.56 | -2.20 | 0.02 | 0.04 |
| IC | 216.53 | 216.93 | 6.35 | 6.33 | ||||||
| Proportion of long fixations | RC | 14.67% | 14.98% | 1.44% | 1.46% | -2.42 | -2.06 | 0.02 | 0.05 | |
| IC | 16.94% | 17.00% | 1.75% | 1.75% | ||||||
| RC: one-tailed t- test against 0.5 | / | / | / | / | -24.53 | -24.03 | < 0.001 | < 0.001 | ||
| IC: one-tailed t- test against 0.5 | / | / | / | / | -18.84 | -18.87 | < 0.001 | < 0.001 | ||
| Processing depth | Proportion of pre-decisional fixation amount | RC | 98.91% | 99.29% | 0.47% | 0.33% | 1.08 | 1.06 | 0.29 | 0.3 |
| IC | 97.92% | 98.67% | 0.92% | 0.59% | ||||||
| RC: one-tailed t- test against 1 | / | / | / | / | -2.33 | -2.17 | 0.01 | 0.02 | ||
| IC: one-tailed t- test against 1 | / | / | / | / | -2.25 | -2.26 | 0.02 | 0.02 | ||
| Processing direction | SM value | RC | -0.04 | -0.04 | 0.06 | 0.06 | -2.48 | -2.48 | 0.02 | 0.02 |
| IC | 0.19 | 0.19 | 0.11 | 0.11 | ||||||
| RC: one-tailed t- test against 0 | / | / | / | / | -0.69 | -0.69 | 0.25 | 0.25 | ||
| IC: one-tailed t- test against 0 | / | / | / | / | 1.68 | 1.66 | 0.10 | 0.05 | ||
Table S8 Comparison of Decision-Process and Eye-Tracking Indicators in Study 1 Under Conditions With and Without Excluded Trials
| Decision outcome/process | Analysis indicator | Choice type | M | SE | t(30) | p | ||||
|---|---|---|---|---|---|---|---|---|---|---|
| Excluded | Not excluded | Excluded | Not excluded | Excluded | Not excluded | Excluded | Not excluded | |||
| Decision time | Decision time | RC | 2.56 | 2.68 | 0.12 | 0.15 | -2.80 | -1.99 | 0.01 | 0.06 |
| IC | 2.85 | 2.93 | 0.16 | 0.18 | ||||||
| Choice preference | Proportion of choosing the LL/LH option | RC | 67.68% | 67.16% | 3.66% | 3.61% | 8.97 | 9.08 | < 0.001 | < 0.001 |
| IC | 28.32% | 28.64% | 4.46% | 4.44% | ||||||
| Processing complexity | Mean fixation duration per fixation | RC | 208.64 | 210 | 5.39 | 5.44 | -2.56 | -2.20 | 0.02 | 0.04 |
| IC | 216.53 | 216.93 | 6.35 | 6.33 | ||||||
| Proportion of long fixations | RC | 14.67% | 14.98% | 1.44% | 1.46% | -2.42 | -2.06 | 0.02 | 0.05 | |
| IC | 16.94% | 17.00% | 1.75% | 1.75% | ||||||
| RC: one-tailed t- test against 0.5 | / | / | / | / | -24.53 | -24.03 | < 0.001 | < 0.001 | ||
| IC: one-tailed t- test against 0.5 | / | / | / | / | -18.84 | -18.87 | < 0.001 | < 0.001 | ||
| Processing depth | Proportion of pre-decisional fixation amount | RC | 98.91% | 99.29% | 0.47% | 0.33% | 1.08 | 1.06 | 0.29 | 0.3 |
| IC | 97.92% | 98.67% | 0.92% | 0.59% | ||||||
| RC: one-tailed t- test against 1 | / | / | / | / | -2.33 | -2.17 | 0.01 | 0.02 | ||
| IC: one-tailed t- test against 1 | / | / | / | / | -2.25 | -2.26 | 0.02 | 0.02 | ||
| Processing direction | SM value | RC | -0.04 | -0.04 | 0.06 | 0.06 | -2.48 | -2.48 | 0.02 | 0.02 |
| IC | 0.19 | 0.19 | 0.11 | 0.11 | ||||||
| RC: one-tailed t- test against 0 | / | / | / | / | -0.69 | -0.69 | 0.25 | 0.25 | ||
| IC: one-tailed t- test against 0 | / | / | / | / | 1.68 | 1.66 | 0.10 | 0.05 | ||
| Decision outcome/process | Analysis indicator | Choice type | M | SE | t(31) | p | ||||
|---|---|---|---|---|---|---|---|---|---|---|
| Excluded | Not excluded | Excluded | Not excluded | Excluded | Not excluded | Excluded | Not excluded | |||
| Decision time | Decision time | RC | 4.47 | 4.59 | 0.23 | 0.24 | 0.34 | 0.37 | 0.74 | 0.71 |
| IC | 4.40 | 4.50 | 0.26 | 0.29 | ||||||
| Choice preference | Proportion of choosing the LL/LH option | RC | 35.81% | 36.00% | 4.82% | 4.84% | -3.19 | -3.12 | 0.003 | 0.004 |
| IC | 56.26% | 56.18% | 4.88% | 4.88% | ||||||
| Processing complexity | Mean fixation duration per fixation | RC | 198.84 | 199.25 | 3.55 | 3.52 | -0.61 | -0.54 | 0.54 | 0.60 |
| IC | 200.60 | 200.84 | 4.08 | 4.13 | ||||||
| Proportion of long fixations | RC | 10.72% | 10.83% | 0.83% | 0.81% | -0.40 | -0.30 | 0.69 | 0.77 | |
| IC | 11.01% | 11.06% | 1.03% | 1.04% | ||||||
| RC: one-tailed t- test against 0.5 | / | / | / | / | -47.58 | -48.35 | < 0.001 | < 0.001 | ||
| IC: one-tailed t- test against 0.5 | / | / | / | / | -37.79 | -37.45 | < 0.001 | < 0.001 | ||
| Processing depth | Proportion of pre-decisional fixation amount | RC | 88.17% | 88.48% | 1.39% | 1.35% | 3.15 | 3.41 | 0.004 | 0.002 |
| IC | 84.20% | 84.23% | 1.52% | 1.52% | ||||||
| RC: one-tailed t-test against 1 | / | / | / | / | -8.53 | -8.53 | < 0.001 | < 0.001 | ||
| IC: one-tailed t- test against 1 | / | / | / | / | -10.41 | -10.38 | < 0.001 | < 0.001 | ||
| Processing direction | SM value | RC | 3.72 | 3.77 | 0.17 | 0.17 | 4.28 | 4.40 | < 0.001 | < 0.001 |
| IC | 3.07 | 3.08 | 0.18 | 0.19 | ||||||
| RC: one-tailed t- test against 0 | / | / | / | / | 18.39 | 22.23 | < 0.001 | < 0.001 | ||
| IC: one-tailed t- test against 0 | / | / | / | / | 16.69 | 16.46 | < 0.001 | < 0.001 | ||
Table S9 Comparison of Decision-Process and Eye-Tracking Indicators in Study 2 Under Conditions With and Without Excluded Trials
| Decision outcome/process | Analysis indicator | Choice type | M | SE | t(31) | p | ||||
|---|---|---|---|---|---|---|---|---|---|---|
| Excluded | Not excluded | Excluded | Not excluded | Excluded | Not excluded | Excluded | Not excluded | |||
| Decision time | Decision time | RC | 4.47 | 4.59 | 0.23 | 0.24 | 0.34 | 0.37 | 0.74 | 0.71 |
| IC | 4.40 | 4.50 | 0.26 | 0.29 | ||||||
| Choice preference | Proportion of choosing the LL/LH option | RC | 35.81% | 36.00% | 4.82% | 4.84% | -3.19 | -3.12 | 0.003 | 0.004 |
| IC | 56.26% | 56.18% | 4.88% | 4.88% | ||||||
| Processing complexity | Mean fixation duration per fixation | RC | 198.84 | 199.25 | 3.55 | 3.52 | -0.61 | -0.54 | 0.54 | 0.60 |
| IC | 200.60 | 200.84 | 4.08 | 4.13 | ||||||
| Proportion of long fixations | RC | 10.72% | 10.83% | 0.83% | 0.81% | -0.40 | -0.30 | 0.69 | 0.77 | |
| IC | 11.01% | 11.06% | 1.03% | 1.04% | ||||||
| RC: one-tailed t- test against 0.5 | / | / | / | / | -47.58 | -48.35 | < 0.001 | < 0.001 | ||
| IC: one-tailed t- test against 0.5 | / | / | / | / | -37.79 | -37.45 | < 0.001 | < 0.001 | ||
| Processing depth | Proportion of pre-decisional fixation amount | RC | 88.17% | 88.48% | 1.39% | 1.35% | 3.15 | 3.41 | 0.004 | 0.002 |
| IC | 84.20% | 84.23% | 1.52% | 1.52% | ||||||
| RC: one-tailed t-test against 1 | / | / | / | / | -8.53 | -8.53 | < 0.001 | < 0.001 | ||
| IC: one-tailed t- test against 1 | / | / | / | / | -10.41 | -10.38 | < 0.001 | < 0.001 | ||
| Processing direction | SM value | RC | 3.72 | 3.77 | 0.17 | 0.17 | 4.28 | 4.40 | < 0.001 | < 0.001 |
| IC | 3.07 | 3.08 | 0.18 | 0.19 | ||||||
| RC: one-tailed t- test against 0 | / | / | / | / | 18.39 | 22.23 | < 0.001 | < 0.001 | ||
| IC: one-tailed t- test against 0 | / | / | / | / | 16.69 | 16.46 | < 0.001 | < 0.001 | ||
| Decision outcome/ process | Analysis indicator | Analysis type | Cauchy (r = 0.707) | Normal (0, 0.5) | Normal (0, 1) |
|---|---|---|---|---|---|
| Decision time | Decision time | RC vs. IC | 4.96 | 5.48 | 4.16 |
| Choice preference | Proportion of choosing the LL/LH option | RC vs. IC | > 100 | > 100 | > 100 |
| Processing complexity | Mean fixation duration per fixation | RC vs. IC | 3.03 | 3.43 | 2.49 |
| RC outcome dimension vs. IC outcome dimension | 20.15 | 20.84 | 17.79 | ||
| RC probability dimension vs. IC time dimension | 0.45 | 0.57 | 0.34 | ||
| Proportion of long fixations | RC vs. IC | 2.31 | 2.66 | 1.88 | |
| RC vs. 0.5 | > 100 | > 100 | > 100 | ||
| IC vs. 0.5 | > 100 | > 100 | > 100 | ||
| Processing depth | Proportion of pre-decisional fixation amount | RC vs. IC | 0.33 | 0.41 | 0.23 |
| RC vs. 1 | 1.98 | 1.67 | 1.12 | ||
| IC vs. 1 | 1.69 | 1.93 | 1.32 | ||
| Processing direction | SM value | RC vs. IC | 2.58 | 2.95 | 2.1 |
| RC vs. 0 | 0.24 | 0.32 | 0.18 | ||
| IC vs. 0 | 0.67 | 0.83 | 0.52 |
Table S10 Bayes Factor Sensitivity Analysis of the Main Decision Indicators in Study 1
| Decision outcome/ process | Analysis indicator | Analysis type | Cauchy (r = 0.707) | Normal (0, 0.5) | Normal (0, 1) |
|---|---|---|---|---|---|
| Decision time | Decision time | RC vs. IC | 4.96 | 5.48 | 4.16 |
| Choice preference | Proportion of choosing the LL/LH option | RC vs. IC | > 100 | > 100 | > 100 |
| Processing complexity | Mean fixation duration per fixation | RC vs. IC | 3.03 | 3.43 | 2.49 |
| RC outcome dimension vs. IC outcome dimension | 20.15 | 20.84 | 17.79 | ||
| RC probability dimension vs. IC time dimension | 0.45 | 0.57 | 0.34 | ||
| Proportion of long fixations | RC vs. IC | 2.31 | 2.66 | 1.88 | |
| RC vs. 0.5 | > 100 | > 100 | > 100 | ||
| IC vs. 0.5 | > 100 | > 100 | > 100 | ||
| Processing depth | Proportion of pre-decisional fixation amount | RC vs. IC | 0.33 | 0.41 | 0.23 |
| RC vs. 1 | 1.98 | 1.67 | 1.12 | ||
| IC vs. 1 | 1.69 | 1.93 | 1.32 | ||
| Processing direction | SM value | RC vs. IC | 2.58 | 2.95 | 2.1 |
| RC vs. 0 | 0.24 | 0.32 | 0.18 | ||
| IC vs. 0 | 0.67 | 0.83 | 0.52 |
| Decision outcome/ process | Analysis indicator | Analysis type | Cauchy (r = 0.707) | Normal (0, 0.5) | Normal (0, 1) |
|---|---|---|---|---|---|
| Decision time | Decision time | RC vs. IC | 0.20 | 0.27 | 0.14 |
| Choice preference | Proportion of choosing the LL/LH option | RC vs. IC | 11.59 | 12.34 | 9.99 |
| Processing complexity | Mean fixation duration per fixation | RC vs. IC | 0.22 | 0.3 | 0.16 |
| RC outcome dimension vs. IC outcome dimension | 0.37 | 0.48 | 0.28 | ||
| RC probability dimension vs. IC time dimension | 0.80 | 0.98 | 0.62 | ||
| Proportion of long fixations | RC vs. IC | 0.20 | 0.27 | 0.15 | |
| RC vs. 0.5 | > 100 | > 100 | > 100 | ||
| IC vs. 0.5 | > 100 | > 100 | > 100 | ||
| Processing depth | Proportion of predecisional fixation amount | RC vs. IC | 10.63 | 11.37 | 9.14 |
| RC vs. 1 | > 100 | > 100 | > 100 | ||
| IC vs. 1 | > 100 | > 100 | > 100 | ||
| Processing direction | SM value | RC vs. IC | > 100 | > 100 | > 100 |
| RC vs. 0 | > 100 | > 100 | > 100 | ||
| IC vs. 0 | > 100 | > 100 | > 100 |
Table S11 Bayes Factor Sensitivity Analysis of the Main Decision Indicators in Study 2
| Decision outcome/ process | Analysis indicator | Analysis type | Cauchy (r = 0.707) | Normal (0, 0.5) | Normal (0, 1) |
|---|---|---|---|---|---|
| Decision time | Decision time | RC vs. IC | 0.20 | 0.27 | 0.14 |
| Choice preference | Proportion of choosing the LL/LH option | RC vs. IC | 11.59 | 12.34 | 9.99 |
| Processing complexity | Mean fixation duration per fixation | RC vs. IC | 0.22 | 0.3 | 0.16 |
| RC outcome dimension vs. IC outcome dimension | 0.37 | 0.48 | 0.28 | ||
| RC probability dimension vs. IC time dimension | 0.80 | 0.98 | 0.62 | ||
| Proportion of long fixations | RC vs. IC | 0.20 | 0.27 | 0.15 | |
| RC vs. 0.5 | > 100 | > 100 | > 100 | ||
| IC vs. 0.5 | > 100 | > 100 | > 100 | ||
| Processing depth | Proportion of predecisional fixation amount | RC vs. IC | 10.63 | 11.37 | 9.14 |
| RC vs. 1 | > 100 | > 100 | > 100 | ||
| IC vs. 1 | > 100 | > 100 | > 100 | ||
| Processing direction | SM value | RC vs. IC | > 100 | > 100 | > 100 |
| RC vs. 0 | > 100 | > 100 | > 100 | ||
| IC vs. 0 | > 100 | > 100 | > 100 |
| [1] |
Ahn, W. Y., Haines, N., & Zhang, L. (2017). Revealing neurocomputational mechanisms of reinforcement learning and decision-making with the hBayesDM package. Computational Psychiatry, 1, 24-57. https://doi.org/10.1162/CPSY_a_00002
doi: 10.1162/CPSY_a_00002 URL |
| [2] |
Ainslie, G. (1975). Specious reward: A behavioral theory of impulsiveness and impulse control. Psychological Bulletin, 82(4), 463-496. https://doi.org/10.1037/h0076860
doi: 10.1037/h0076860 URL pmid: 1099599 |
| [3] |
Allais, M. (1953). Le comportement de l’homme rationnel devant le risque: Critique des postulats et axiomes de l’école américaine. Econometrica, 21(4), 503-546. https://doi.org/10.2307/1907921
doi: 10.2307/1907921 URL |
| [4] |
Amasino, D. R., Sullivan, N. J., Kranton, R. E., & Huettel, S. A. (2019). Amount and time exert independent influences on intertemporal choice. Nature Human Behaviour, 3(4), 383-392. https://doi.org/10.1038/s41562-019-0537-2
doi: 10.1038/s41562-019-0537-2 URL pmid: 30971787 |
| [5] |
Anderson, C. J. (2003). The psychology of doing nothing: Forms of decision avoidance result from reason and emotion. Psychological Bulletin, 129(1), 139-167. https://doi.org/10.1037/0033-2909.129.1.139
URL pmid: 12555797 |
| [6] |
Anderson, M. A. B., Cox, D. J., & Dallery, J. (2023). Effects of economic context and reward amount on delay and probability discounting. Journal of the Experimental Analysis of Behavior, 120(2), 204-213. https://doi.org/10.1002/jeab.868
doi: 10.1002/jeab.868 URL pmid: 37311053 |
| [7] |
Anderson, N. H., & Shanteau, J. C. (1970). Information integration in risky decision making. Journal of Experimental Psychology, 84(3), 441-451. https://doi.org/10.1037/h0029300
doi: 10.1037/h0029300 URL |
| [8] | Bates, D., Mächler, M., Bolker, B., & Walker, S. (2015). Fitting linear mixed-effects models using lme4. Journal of Statistical Software, 67(1), 1-48. https://doi.org/10.18637/jss.v067.i01 |
| [9] |
Benzion, U., Rapoport, A., & Yagil, J. (1989). Discount rates inferred from decisions: An experimental study. Management Science, 35(3), 270-284. https://doi.org/10.1287/mnsc.35.3.270
doi: 10.1287/mnsc.35.3.270 URL |
| [10] |
Bhatnagar, R., & Orquin, J. L. (2022). A meta-analysis on the effect of visual attention on choice. Journal of Experimental Psychology: General, 151(10), 2265-2283. https://doi.org/10.1037/xge0001204
doi: 10.1037/xge0001204 URL |
| [11] |
Białaszek, W., Ostaszewski, P., Green, L., & Myerson, J. (2019). On four types of devaluation of outcomes due to their costs: Delay, probability, effort, and social discounting. The Psychological Record, 69(3), 415-424. https://doi.org/10.1007/s40732-019-00340-x
doi: 10.1007/s40732-019-00340-x URL |
| [12] |
Böckenholt, U., & Hynan, L. S. (1994). Caveats on a process‐tracing measure and a remedy. Journal of Behavioral Decision Making, 7(2), 103-117. https://doi.org/10.1002/bdm.3960070203
doi: 10.1002/bdm.v7:2 URL |
| [13] |
Brandstätter, E., Gigerenzer, G., & Hertwig, R. (2006). The priority heuristic: Making choices without trade-offs. Psychological Review, 113(2), 409-432. https://doi.org/10.1037/0033-295X.113.2.409
doi: 10.1037/0033-295X.113.2.409 URL pmid: 16637767 |
| [14] |
Brysbaert, M., & Stevens, M. (2018). Power analysis and effect size in mixed effects models: A tutorial. Journal of Cognition, 1(1), 9. https://doi.org/10.5334/joc.10
doi: 10.5334/joc.10 URL pmid: 31517183 |
| [15] |
Chen, F., Zheng, J., Wang, L., & Krajbich, I. (2024). Attribute latencies causally shape intertemporal decisions. Nature Communications, 15(1), 2948. https://doi.org/10.1038/s41467-024-46657-2
doi: 10.1038/s41467-024-46657-2 URL pmid: 38580626 |
| [16] |
Cheng, J., & González-Vallejo, C. (2016). Attribute-wise vs. alternative-wise mechanism in intertemporal choice: Testing the proportional difference, trade-off, and hyperbolic models. Decision, 3(3), 190-215. https://doi.org/10.1037/dec0000046
doi: 10.1037/dec0000046 URL |
| [17] |
Coronel, J. C., Bullock, O. M., Shulman, H. C., Sweitzer, M. D., Bond, R. M., & Poulsen, S. (2021). Eye movements predict large-scale voting decisions. Psychological Science, 32(6), 836-848. https://doi.org/10.1177/0956797621991142
doi: 10.1177/0956797621991142 URL |
| [18] |
Cristino, F., Mathôt, S., Theeuwes, J., & Gilchrist, I. D. (2010). ScanMatch: A novel method for comparing fixation sequences. Behavior Research Methods, 42, 692-700. https://doi.org/10.3758/BRM.42.3.692
doi: 10.3758/BRM.42.3.692 URL pmid: 20805591 |
| [19] |
Dai, J., & Busemeyer, J. R. (2014). A probabilistic, dynamic, and attribute-wise model of intertemporal choice. Journal of Experimental Psychology: General, 143(4), 1489-1514. https://doi.org/10.1037/a0035976
doi: 10.1037/a0035976 URL |
| [20] |
Dai, J., Pleskac, T. J., & Pachur, T. (2018). Dynamic cognitive models of intertemporal choice. Cognitive Psychology, 104, 29-56. https://doi.org/10.1016/j.cogpsych.2018.03.001
doi: S0010-0285(17)30211-6 URL pmid: 29587183 |
| [21] |
DeKay, M. L., & Dou, S. (2024). Risky-choice framing effects result partly from mismatched option descriptions in gains and losses. Psychological Science, 35(8), 918-932. https://doi.org/10.1177/09567976241249183
doi: 10.1177/09567976241249183 URL |
| [22] |
Diederich, A., & Zhao, W. J. (2019). A dynamic dual process model of intertemporal choice. The Spanish Journal of Psychology, 22, E54. https://doi.org/10.1017/sjp.2019.53
doi: 10.1017/sjp.2019.53 URL |
| [23] |
Escobar, G. G., Morales-Chainé, S., Haynes, J. M., Santoyo, C., & Mitchell, S. H. (2023). Moderate stability among delay, probability, and effort discounting in humans. The Psychological Record, 73(2), 149-162. https://doi.org/10.1007/s40732-023-00537-1
doi: 10.1007/s40732-023-00537-1 URL |
| [24] | Fidanoski, F., Dixit, V., & Ortmann, A. (2023). Can a single model account for both risky choices and inter-temporal choices? Testing the assumptions underlying models of risky-intertemporal choice: A conceptual replication[Preprint]. SSRN. https://doi.org/10.2139/ssrn.4393036 |
| [25] |
Fisher, G. (2021). Intertemporal choices are causally influenced by fluctuations in visual attention. Management Science, 67(8), 4961-4981. https://doi.org/10.1287/mnsc.2020.3732
doi: 10.1287/mnsc.2020.3732 URL |
| [26] |
Franco‐Watkins, A. M., Mattson, R. E., & Jackson, M. D. (2016). Now or later? Attentional processing and intertemporal choice. Journal of Behavioral Decision Making, 29(2-3), 206-217. https://doi.org/10.1002/bdm.1895
doi: 10.1002/bdm.v29.2-3 URL |
| [27] |
Frederick, S. (2005). Cognitive reflection and decision making. Journal of Economic Perspectives, 19(4), 25-42. https://doi.org/10.1257/089533005775196732
doi: 10.1257/089533005775196732 URL |
| [28] |
Frederick, S., & Loewenstein, G. (2002). Time discounting and time preference: A critical review. Journal of Economic Literature, 40(2), 351-401. https://doi.org/10.1257/002205102320161311
doi: 10.1257/jel.40.2.351 URL |
| [29] |
Freeman, J. B., & Ambady, N. (2010). MouseTracker: Software for studying real-time mental processing using a computer mouse- tracking method. Behavior Research Methods, 42(1), 226-241. https://doi.org/10.3758/BRM.42.1.226
doi: 10.3758/BRM.42.1.226 URL |
| [30] |
Gerretsen, P., Kim, J., Caravaggio, F., Quilty, L., Sanches, M., Wells, S., ... Graff-Guerrero, A. (2021). Individual determinants of COVID-19 vaccine hesitancy. PLoS One, 16(11), e0258462. https://doi.org/10.1371/journal.pone.0258462
doi: 10.1371/journal.pone.0258462 URL |
| [31] |
Glöckner, A., & Herbold, A. K. (2011). An eye-tracking study on information processing in risky decisions: Evidence for compensatory strategies based on automatic processes. Journal of Behavioral Decision Making, 24(1), 71-98. https://doi.org/10.1002/bdm.684
doi: 10.1002/bdm.v24.1 URL |
| [32] |
Goldstein, D. G., & Gigerenzer, G. (2002). Models of ecological rationality: The recognition heuristic. Psychological Review, 109(1), 75-90. https://doi.org/10.1037/0033-295X.109.1.75
URL pmid: 11863042 |
| [33] |
Green, L., & Myerson, J. (2004). A discounting framework for choice with delayed and probabilistic rewards. Psychological Bulletin, 130(5), 769-792. https://psycnet.apa.org/doi/10.1037/0033-2909.130.5.769
pmid: 15367080 |
| [34] |
Green, L., & Myerson, J. (2013). How many impulsivities? A discounting perspective. Journal of the Experimental Analysis of Behavior, 99(1), 3-13. https://doi.org/10.1002/jeab.1
doi: 10.1002/jeab.1 URL pmid: 23344985 |
| [35] | Green, L., Myerson, J., & Ostaszewski, P. (1999). Amount of reward has opposite effects on the discounting of delayed and probabilistic outcomes. Journal of Experimental Psychology: Learning, Memory, and Cognition, 25(2), 418-427. https://psycnet.apa.org/doi/10.1037/0278-7393.25.2.418 |
| [36] | Green,, L., Myerson, J., & Vanderveldt, A. (2014). Delay and probability discounting. In F. K. McSweeney & E. S. Murphy (Eds.), The Wiley-Blackwell handbook of operant and classical conditioning (pp. 307-337). Wiley-Blackwell. https://doi.org/10.1002/9781118468135.ch13 |
| [37] |
Guo, M., Ikink, I., Roelofs, K., & Figner, B. (2025). Ambiguity preferences in intertemporal and risky choice: A large-scale study using drift-diffusion modelling. Psychonomic Bulletin & Review, 32(6), 2939-2956. https://doi.org/10.3758/s13423-025-02709-2
doi: 10.3758/s13423-025-02709-2 URL |
| [38] |
Han, X., Wang, Y. T., Feng, J. L., Deng, C., Chen, Z. H., Huang, Y. A., ... Hu, P. W. (2023). A survey of transformer-based multimodal pre-trained modals. Neurocomputing, 515, 89-106. https://doi.org/10.1016/j.neucom.2022.09.136
doi: 10.1016/j.neucom.2022.09.136 URL |
| [39] |
Hardisty, D. J., & Weber, E. U. (2009). Discounting future green: Money versus the environment. Journal of Experimental Psychology: General, 138(3), 329-340. https://doi.org/10.1037/a0016433
doi: 10.1037/a0016433 URL |
| [40] |
He, L., Analytis, P. P., & Bhatia, S. (2022). The wisdom of model crowds. Management Science, 68(5), 3635-3659. https://doi.org/10.1287/mnsc.2021.4090
doi: 10.1287/mnsc.2021.4090 URL |
| [41] |
He, L., Wall, D., Reeck, C., & Bhatia, S. (2023). Information acquisition and decision strategies in intertemporal choice. Cognitive Psychology, 142, 101562. https://doi.org/10.1016/j.cogpsych.2023.101562
doi: 10.1016/j.cogpsych.2023.101562 URL |
| [42] |
He, L., Zhao, W. J., & Bhatia, S. (2022). An ontology of decision models. Psychological Review, 129(1), 49-72. https://doi.org/10.1037/rev0000231
doi: 10.1037/rev0000231 URL |
| [43] |
Hertwig, R., Barron, G., Weber, E. U., & Erev, I. (2004). Decisions from experience and the effect of rare events in risky choice. Psychological Science, 15(8), 534-539. https://doi.org/10.1111/j.0956-7976.2004.00715.x
doi: 10.1111/j.0956-7976.2004.00715.x URL pmid: 15270998 |
| [44] |
Hertwig, R., & Erev, I. (2009). The description-experience gap in risky choice. Trends in Cognitive Sciences, 13(12), 517-523. https://doi.org/10.1016/j.tics.2009.09.004
doi: 10.1016/j.tics.2009.09.004 URL pmid: 19836292 |
| [45] |
Hinvest, N. S., & Anderson, I. M. (2010). The effects of real versus hypothetical reward on delay and probability discounting. Quarterly Journal of Experimental Psychology, 63(6), 1072-1084. https://doi.org/10.1080/17470210903276350
doi: 10.1080/17470210903276350 URL |
| [46] |
Hoffmann, T., Hofman, A., & Wagenmakers, E. J. (2022). Bayesian tests of two proportions: A tutorial with R and JASP. Methodology, 18(4), 239-277. https://doi.org/10.5964/meth.9263
doi: 10.5964/meth.v18i4 URL |
| [47] |
Horstmann, N., Ahlgrimm, A., & Glöckner, A. (2009). How distinct are intuition and deliberation? An eye-tracking analysis of instruction- induced decision modes. Judgment and Decision Making, 4(5), 335-354. https://doi.org/10.1017/S1930297500001182
doi: 10.1017/S1930297500001182 URL |
| [48] |
Hsiao, J. H. (2024). Understanding human cognition through computational modeling. Topics in Cognitive Science, 16(3), 349-376. https://doi.org/10.1111/tops.12737
doi: 10.1111/tops.v16.3 URL |
| [49] |
Hu, M., Chang, R., Sui, X., & Gao, M. (2024). Attention biases the process of risky decision-making: Evidence from eye-tracking. PsyCh Journal, 13(2), 157-165. https://doi.org/10.1002/pchj.724
doi: 10.1002/pchj.724 URL |
| [50] |
Huang, Y., Luan, S., Wu, B., Li, Y., Wu, J., Chen, W., & Hertwig, R. (2024). Impulsivity is a stable, measurable, and predictive psychological trait. Proceedings of the National Academy of Sciences, 121(24), e2321758121. https://doi.org/10.1073/pnas.2321758121
doi: 10.1073/pnas.2321758121 URL |
| [51] |
Huang, Y. N., Jiang, C. M., Liu, H. Z., & Li, S. (2023). Toward a coherent understanding of risky, intertemporal, and spatial choices: Evidence from eye-tracking and subjective evaluation. Acta Psychologica Sinica, 55(6), 994-1015. https://doi.org/10.3724/SP.J.1041.2023.00994
doi: 10.3724/SP.J.1041.2023.00994 URL |
| [52] |
Jenke, L., Bansak, K., Hainmueller, J., & Hangartner, D. (2021). Using eye-tracking to understand decision-making in conjoint experiments. Political Analysis, 29(1), 75-101. https://doi.org/10.1017/pan.2020.11
doi: 10.1017/pan.2020.11 URL |
| [53] |
Jiang, J., & Dai, J. (2021). Time and risk perceptions mediate the causal impact of objective delay on delay discounting: An experimental examination of the implicit-risk hypothesis. Psychonomic Bulletin & Review, 28(4), 1399-1412. https://doi.org/10.3758/s13423-021-01890-4
doi: 10.3758/s13423-021-01890-4 URL |
| [54] | Johnson, K. L., Bixter, M. T., & Luhmann, C. C. (2020). Delay discounting and risky choice: Meta-analytic evidence regarding single-process theories. Judgment and Decision Making, 15(3), 381-400. https://doi.org/10.1017/S193029750000718X |
| [55] |
Kahneman, D., & Tversky, A. (1979). Prospect theory: An analysis of decision under risk. Econometrica, 47(2), 263. https://doi.org/10.1142/9789814417358_0006
doi: 10.2307/1914185 URL |
| [56] |
Kahneman, D., & Tversky, A. (1984). Choices, values, and frames. American Psychologist, 39(4), 341-350. https://doi.org/10.1037/0003-066X.39.4.341
doi: 10.1037/0003-066X.39.4.341 URL |
| [57] |
Kalenscher, T., Ohmann, T., & Güntürkün, O. (2006). The neuroscience of impulsive and self-controlled decisions. International Journal of Psychophysiology, 62(2), 203-211. https://doi.org/10.1016/j.ijpsycho.2006.05.010
URL pmid: 16828187 |
| [58] |
Kaplan, B. A., Amlung, M., Reed, D. D., Jarmolowicz, D. P., McKerchar, T. L., & Lemley, S. M. (2016). Automating scoring of delay discounting for the 21- and 27-item Monetary Choice Questionnaires. The Behavior Analyst, 39(2), 293-304. https://doi.org/10.1007/s40614-016-0070-9
doi: 10.1007/s40614-016-0070-9 URL |
| [59] |
Killeen, P. R. (2023). Variations on a theme by Rachlin: Probability discounting. Journal of the Experimental Analysis of Behavior, 119(1), 140-155. https://doi.org/10.1002/jeab.817
doi: 10.1002/jeab.v119.1 URL |
| [60] |
Kirby, K. N., & Maraković, N. N. (1996). Delay-discounting probabilistic rewards: Rates decrease as amounts increase. Psychonomic Bulletin & Review, 3(1), 100-104. https://doi.org/10.3758/BF03210748
doi: 10.3758/BF03210748 URL |
| [61] |
Kirby, K. N. (1997). Bidding on the future: Evidence against normative discounting of delayed rewards. Journal of Experimental Psychology: General, 126(1), 54-70. https://doi.org/10.1037/0096-3445.126.1.54
doi: 10.1037/0096-3445.126.1.54 URL |
| [62] |
Kirby, K. N., & Herrnstein, R. J. (1995). Preference reversals due to myopic discounting of delayed reward. Psychological Science, 6(2), 83-89. https://doi.org/10.1111/j.1467-9280.1995.tb00311.x
doi: 10.1111/j.1467-9280.1995.tb00311.x URL |
| [63] |
Konovalov, A., & Krajbich, I. (2020). Mouse tracking reveals structure knowledge in the absence of model-based choice. Nature Communications, 11(1), 1893. https://doi.org/10.1038/s41467-020-15696-w
doi: 10.1038/s41467-020-15696-w URL pmid: 32312966 |
| [64] |
Konstantinidis, E., Van Ravenzwaaij, D., Güney, Ş., & Newell, B. R. (2020). Now for sure or later with a risk? Modeling risky intertemporal choice as accumulated preference. Decision, 7(2), 91-120. https://doi.org/10.1037/dec0000103
doi: 10.1037/dec0000103 URL |
| [65] |
Krajbich, I., & Rangel, A. (2011). Multialternative drift-diffusion model predicts the relationship between visual fixations and choice in value-based decisions. Proceedings of the National Academy of Sciences, 108(33), 13852-13857. https://doi.org/10.1073/pnas.1101328108
doi: 10.1073/pnas.1101328108 URL |
| [66] |
Leland, J. W. (2002). Similarity judgments and anomalies in intertemporal choice. Economic Inquiry, 40(4), 574-581. https://doi.org/10.1093/ei/40.4.574
doi: 10.1093/ei/40.4.574 URL |
| [67] |
Li, S. (2004). A behavioral choice model when computational ability matters. Applied Intelligence, 20(2), 147-163. https://doi.org/10.1023/b:apin.0000013337.01711.c7
doi: 10.1023/B:APIN.0000013337.01711.c7 URL |
| [68] |
Li, S., Su, Y., & Sun, Y. (2010). The effect of pseudo‐immediacy on intertemporal choices. Journal of Risk Research, 13(6), 781-787. https://doi.org/10.1080/13669870903551704
doi: 10.1080/13669870903551704 URL |
| [69] | Liang, Z. Y., Xu, L. J., Rao, L. L., Jiang, T. Z., & Li, S. (2012). “20% probability to gain a cake” = “gain 20% of the cake”?: Testing the expectation rule of risky decision making. Chinese Science Bulletin, 57(35), 3421-3433. http://doi.org/10.1360/972012-691 |
| [70] |
Lin, J. M., Li, A. M., Zhou, Y. R., He, J. H., & Zhou, L. (2022). The prospect of gaze manipulation technology in decision- making research: Altering decision-making. Advances in Psychological Science, 30(8), 1794-1803. https://doi.org/10.3724/SP.J.1042.2022.01794
doi: 10.3724/SP.J.1042.2022.01794 URL |
| [71] |
Liu, H. Z., Lyu, X. K., Wei, Z. H., Mo, W. L., Luo, J. R., & Su, X. Y. (2021). Exploiting the dynamics of eye gaze to bias intertemporal choice. Journal of Behavioral Decision Making, 34(3), 419-431. https://doi.org/10.1002/bdm.2219
doi: 10.1002/bdm.v34.3 URL |
| [72] |
Luckman, A., Donkin, C., & Newell, B. R. (2018). Can a single model account for both risky choices and inter-temporal choices? Testing the assumptions underlying models of risky inter-temporal choice. Psychonomic Bulletin & Review, 25(2), 785-792. https://doi.org/10.3758/s13423-017-1330-8
doi: 10.3758/s13423-017-1330-8 URL |
| [73] |
Luckman, A., Donkin, C., & Newell, B. R. (2020). An evaluation and comparison of models of risky intertemporal choice. Psychological Review, 127(6), 1097-1138. https://doi.org/10.1037/rev0000223
doi: 10.1037/rev0000223 URL |
| [74] |
Ludwig, J., Jaudas, A., & Achtziger, A. (2024). The zero effect: An eye-tracking study of affect and motivation in risky choices. Journal of Behavioral Decision Making, 37(3), e2400. https://doi.org/10.1002/bdm.2400
doi: 10.1002/bdm.v37.3 URL |
| [75] |
Marzilli Ericson, K. M., White, J. M., Laibson, D., & Cohen, J. D. (2015). Money earlier or later? Simple heuristics explain intertemporal choices better than delay discounting does. Psychological Science, 26(6), 826-833. https://doi.org/10.1177/0956797615572232
doi: 10.1177/0956797615572232 URL pmid: 25911124 |
| [76] | Mazur, J. E. (1987). An adjusting procedure for studying delayed reinforcement. In M. L. Commons, J. E. Mazur, J. A. Nevin, & H. Rachlin (Eds.), The effect of delay and of intervening events on reinforcement value (pp. 55-73). Erlbaum. |
| [77] |
Meertens, R. M., & Lion, R. (2008). Measuring an individual’s tendency to take risks: The Risk Propensity Scale. Journal of Applied Social Psychology, 38(6), 1506-1520. https://doi.org/10.1111/j.1559-1816.2008.00357.x
doi: 10.1111/jasp.2008.38.issue-6 URL |
| [78] |
Meissner, T., Gassmann, X., Faure, C., & Schleich, J. (2023). Individual characteristics associated with risk and time preferences: A multi-country representative survey. Journal of Risk and Uncertainty, 66, 77-107. https://doi.org/10.1007/s11166-022-09383-y
doi: 10.1007/s11166-022-09383-y URL |
| [79] |
Mok, J. N. Y., Kwan, D., Green, L., Myerson, J., Craver, C. F., & Rosenbaum, R. S. (2020). Is it time? Episodic imagining and the discounting of delayed and probabilistic rewards in young and older adults. Cognition, 199, 104222. https://doi.org/10.1016/j.cognition.2020.104222
doi: 10.1016/j.cognition.2020.104222 URL |
| [80] |
Noton, D., & Stark, L. (1971). Scanpaths in eye movements during pattern perception. Science, 171(3968), 308-311. https://doi.org/10.1126/science.171.3968.308
URL pmid: 5538847 |
| [81] | Ohmura,, Y., Takahashi, T., & Kitamura, N. (2016). Discounting delayed and probabilistic monetary gains and losses by smokers of cigarettes. In S. Ikeda, H. K. Kato, F. Ohtake, & Y. Tsutsui (Eds.), Behavioral economics of preferences, choices, and happiness (pp. 179-196). Springer. |
| [82] |
Orquin, J. L., Ashby, N. J. S., & Clarke, A. D. F. (2016). Areas of interest as a signal detection problem in behavioral eye-tracking research. Journal of Behavioral Decision Making, 29(2-3), 103-115. https://doi.org/10.1002/bdm.1867
doi: 10.1002/bdm.v29.2-3 URL |
| [83] |
Orquin, J. L., & Holmqvist, K. (2018). Threats to the validity of eye- movement research in psychology. Behavior Research Methods, 50(4), 1645-1656. https://doi.org/10.3758/s13428-017-0998-z
doi: 10.3758/s13428-017-0998-z URL pmid: 29218588 |
| [84] |
Orquin, J. L., Lahm, E. S., & Stojić, H. (2021). The visual environment and attention in decision making. Psychological Bulletin, 147(6), 597-617. https://doi.org/10.1037/bul0000328
doi: 10.1037/bul0000328 URL pmid: 34843300 |
| [85] | Pascal, B. (1670/ 2018). Pensées (W. F. Trotter, Trans.). Fordham University Sourcebooks. https://sourcebooks.fordham.edu/mod/1660pascal-pensees.asp |
| [86] | Patton, J. H., Stanford, M. S., & Barratt, E. S. (1995). Factor structure of the Barratt Impulsiveness Scale. Journal of Clinical Psychology, 51(6), 768-774. https://doi.org/10.1002/1097-4679(199511)51:6<768::AID-JCLP2270510607>3.0.CO;2-1 |
| [87] | Payne, J. W., Bettman, J. R., & Johnson, E. J. (1993). The adaptive decision maker. Cambridge University Press. https://doi.org/10.1017/cbo9781139173933.002 |
| [88] |
Payne, J. W., Braunstein, M. L., & Carroll, J. S. (1978). Exploring predecisional behavior: An alternative approach to decision research. Organizational Behavior and Human Performance, 22(1), 17-44. https://doi.org/10.1016/0030-5073(78)90003-X
doi: 10.1016/0030-5073(78)90003-X URL |
| [89] |
Peters, E., Västfjäll, D., Slovic, P., Mertz, C. K., Mazzocco, K., & Dickert, S. (2006). Numeracy and decision making. Psychological Science, 17(5), 407-413. https://doi.org/10.1111/j.1467-9280.2006.01720.x
URL pmid: 16683928 |
| [90] |
Peters, J., & Büchel, C. (2009). Overlapping and distinct neural systems code for subjective value during intertemporal and risky decision making. The Journal of Neuroscience, 29(50), 15727-15734. https://doi.org/10.1523/JNEUROSCI.3489-09.2009
doi: 10.1523/JNEUROSCI.3489-09.2009 URL |
| [91] |
Peters, J., & Büchel, C. (2011). The neural mechanisms of inter- temporal decision-making: Understanding variability. Trends in Cognitive Sciences, 15(5), 227-239. https://doi.org/10.1016/j.tics.2011.03.002
doi: 10.1016/j.tics.2011.03.002 URL pmid: 21497544 |
| [92] |
Rachlin, H., Logue, A. W., Gibbon, J., & Frankel, M. (1986). Cognition and behavior in studies of choice. Psychological Review, 93(1), 33-45. https://doi.org/10.1037/0033-295x.93.1.33
doi: 10.1037/0033-295X.93.1.33 URL |
| [93] |
Rao, L. L., & Li, S. (2011). New paradoxes in intertemporal choice. Judgment and Decision Making, 6(2), 122-129. https://doi.org/10.1017/s193029750000406x
doi: 10.1017/S193029750000406X URL |
| [94] | Rayner, K. (Ed.).(2012). Eye movements and visual cognition: Scene perception and reading. Springer Science & Business Media. https://doi.org/10.1007/978-1-4612-2852-3 |
| [95] |
Read, D., & Scholten, M. (2012). Tradeoffs between sequences: Weighing accumulated outcomes against outcome-adjusted delays. Journal of Experimental Psychology: Learning, Memory, and Cognition, 38(6), 1675-1688. https://doi.org/10.1037/a0028216
doi: 10.1037/a0028216 URL |
| [96] |
Reyna, V. F., Nelson, W. L., Han, P. K., & Dieckmann, N. F. (2009). How numeracy influences risk comprehension and medical decision making. Psychological Bulletin, 135(6), 943-973. https://doi.org/10.1037/a0017327
doi: 10.1037/a0017327 URL pmid: 19883143 |
| [97] | Reyna, V. F., Müller, S. M., & Edelson, S. M. (2023). Critical tests of fuzzy trace theory in brain and behavior: Uncertainty across time, probability, and development. Cognitive, Affective, & Behavioral Neuroscience, 23(3), 746-772. https://doi.org/10.3758/s13415-022-01058-0 |
| [98] |
Samuelson, P. A. (1937). A note on measurement of utility. The Review of Economic Studies, 4(2), 155-161. https://doi.org/10.2307/2967612
doi: 10.2307/2967612 URL |
| [99] |
Scholten, M., & Read, D. (2010). The psychology of intertemporal tradeoffs. Psychological Review, 117(3), 925-944. https://doi.org/10.1037/a0019619
doi: 10.1037/a0019619 URL pmid: 20658858 |
| [100] |
Scholten, M., Read, D., & Sanborn, A. (2014). Weighing outcomes by time or against time? Evaluation rules in intertemporal choice. Cognitive Science, 38(3), 399-438. https://doi.org/10.1111/cogs.12104
doi: 10.1111/cogs.12104 URL pmid: 24404941 |
| [101] |
Scholten, M., Walters, D. J., Fox, C. R., & Read, D. (2024). The unified tradeoff model. Psychological Review, 131(4), 1007-1044. https://doi.org/10.1037/rev0000458
doi: 10.1037/rev0000458 URL pmid: 38512175 |
| [102] |
Schulte-Mecklenbeck, M., Johnson, J. G., Böckenholt, U., Goldstein, D. G., Russo, J. E., Sullivan, N. J., & Willemsen, M. C. (2017). Process-tracing methods in decision making: On growing up in the 70s. Current Directions in Psychological Science, 26(5), 442-450. https://doi.org/10.1177/0963721417708229
doi: 10.1177/0963721417708229 URL |
| [103] | Sivula, T., Magnusson, M., Matamoros, A. A., & Vehtari, A. (2020). Uncertainty in Bayesian leave-one-out cross-validation based model comparison. arXiv. https://doi.org/10.1214/25-ba1569 |
| [104] |
Smith, E., & Peters, J. (2022). Motor response vigour and visual fixation patterns reflect subjective valuation during intertemporal choice. PLoS Computational Biology, 18(6), e1010096. https://doi.org/10.1371/journal.pcbi.1010096
doi: 10.1371/journal.pcbi.1010096 URL |
| [105] | Stevenson, M., K., Busemeyer, J. R., & Naylor, J. C. (1990). Judgment and decision-making theory. In M. D. Dunnette & L. M. Hough (Eds.), Handbook of industrial and organizational psychology (2nd ed., pp. 283-374). Consulting Psychologists Press. |
| [106] |
Stewart, N., Hermens, F., & Matthews, W. J. (2016). Eye movements in risky choice. Journal of Behavioral Decision Making, 29(2-3), 116-136. https://doi.org/10.1002/bdm.1854
URL pmid: 27522985 |
| [107] |
Stillman, P. E., Shen, X., & Ferguson, M. J. (2018). How mouse- tracking can advance social cognitive theory. Trends in Cognitive Sciences, 22(6), 531-543. https://doi.org/10.1016/j.tics.2018.03.012
doi: S1364-6613(18)30073-1 URL pmid: 29731415 |
| [108] |
Su, Y., Rao, L. L., Sun, H. Y., Du, X. L., Li, X., & Li, S. (2013). Is making a risky choice based on a weighting and adding process? An eye-tracking investigation. Journal of Experimental Psychology: Learning, Memory, and Cognition, 39(6), 1765-1780. https://doi.org/10.1037/a0032861
doi: 10.1037/a0032861 URL |
| [109] |
Sui, X. Y., Liu, H. Z., & Rao, L. L. (2020). The timing of gaze- contingent decision prompts influences risky choice. Cognition, 195, 104077. https://doi.org/10.1016/j.cognition.2019.104077
doi: 10.1016/j.cognition.2019.104077 URL |
| [110] |
Thorngate, W. (1980). Efficient decision heuristics. Behavioral Science, 25(3), 219-225. https://doi.org/10.1002/bs.3830250306
doi: 10.1002/(ISSN)1099-1743 URL |
| [111] |
Ting, C. C., & Gluth, S. (2024). Unraveling information processes of decision-making with eye-tracking data. Frontiers in Behavioral Economics, 3, 1384713. https:// doi.org/10.3389/frbhe.2024.1384713
doi: 10.3389/frbhe.2024.1384713 URL |
| [112] | Trinh, K. A. (2025). Big Five personality traits, poverty, and environmental shocks in shaping farmers’ risk and time preferences: Experimental evidence from Vietnam. Economics, 19(1), 1-21. https://doi.org/10.1515/econ-2025-0172 |
| [113] |
Tversky, A., & Kahneman, D. (1992). Advances in prospect theory: Cumulative representation of uncertainty. Journal of Risk and Uncertainty, 5(4), 297-323. https://doi.org/10.1007/BF00122574
doi: 10.1007/BF00122574 URL |
| [114] |
Vanderveldt, A., Green, L., & Myerson, J. (2015). Discounting of monetary rewards that are both delayed and probabilistic: Delay and probability combine multiplicatively, not additively. Journal of Experimental Psychology: Learning, Memory, and Cognition, 41(1), 148-162. https://doi.org/10.1037/xlm0000029
doi: 10.1037/xlm0000029 URL |
| [115] |
Vehtari, A., Gelman, A., & Gabry, J. (2017). Practical Bayesian model evaluation using leave-one-out cross-validation and WAIC. Statistics and Computing, 27(5), 1413-1432. https://doi.org/10.1007/s11222-016-9696-4
doi: 10.1007/s11222-016-9696-4 URL |
| [116] | von Neumann, J., & Morgenstern, O. (1944). Theory of games and economic behavior. Princeton University Press. |
| [117] |
Wang, P., Wang, X. T., Gao, J., Li, X., & Xu, J. (2019). Adaptive time management: The effects of death awareness on time perception and intertemporal choice. Acta Psychologica Sinica, 51(12), 1341-1350. https://doi.org/10.3724/SP.J.1041.2019.01341
doi: 10.3724/SP.J.1041.2019.01341 URL |
| [118] |
Wang, S., Jiang, Z., Noland, R. B., & Mondschein, A. S. (2020). Attitudes towards privately-owned and shared autonomous vehicles. Transportation Research Part F: Traffic Psychology and Behaviour, 72, 297-306. https://doi.org/10.1016/j.trf.2020.05.014
doi: 10.1016/j.trf.2020.05.014 URL |
| [119] | Wang, Z. J., & Li, S. (2012). Tests of the integrative model and priority heuristic model from the point of view of choice process: Evidence from an eye-tracking study. Acta Psychologica Sinica, 44(2), 179-198. https://doi.org/10.3724/sp.j.1041.2012.00179 |
| [120] |
Weber, B. J., & Huettel, S. A. (2008). The neural substrates of probabilistic and intertemporal decision making. Brain Research, 1234, 104-115. https://doi.org/10.1016/j.brainres.2008.07.105
doi: 10.1016/j.brainres.2008.07.105 URL pmid: 18710652 |
| [121] |
Wei, Z. H., & Li, X. S. (2015). Decision process tracing: Evidence from eye-movement data. Advances in Psychological Science, 23(12), 2029-2041. https://doi.org/10.3724/SP.J.1042.2015.02029
doi: 10.3724/SP.J.1042.2015.02029 URL |
| [122] |
Wismans, A., Thurik, R., Baptista, R., Dejardin, M., Janssen, F., & Franken, I. (2021). Psychological characteristics and the mediating role of the 5C model in explaining students’ COVID-19 vaccination intention. PLoS One, 16(8), e0255382. https://doi.org/10.1371/journal.pone.0255382
doi: 10.1371/journal.pone.0255382 URL |
| [123] |
Yang, X., & Krajbich, I. (2023). A dynamic computational model of gaze and choice in multi-attribute decisions. Psychological Review, 130(1), 52-70. https://doi.org/10.1037/rev0000350
doi: 10.1037/rev0000350 URL |
| [124] |
Yang, X. L., Chen, S. T., & Liu, H. Z. (2022). The effect of incentives on intertemporal choice: Choice, confidence, and eye movements. Frontiers in Psychology, 13, 989511. https://doi.org/10.3389/fpsyg.2022.989511
doi: 10.3389/fpsyg.2022.989511 URL |
| [125] |
Zhang, X., Aimone, J. A., Alsharawy, A., Li, F., Ball, S., & Smith, A. (2024). The effects of task difficulty and presentation format on eye movements in risky choice. Frontiers in Behavioral Economics, 3, 1321301. https://doi.org/10.3389/frbhe.2024.1321301
doi: 10.3389/frbhe.2024.1321301 URL |
| [126] |
Zhang, Y. Y., Rao, L. L., Liang, Z. Y., Zhou, Y., & Li, S. (2014). Process test of risky decision making: New understanding, new evidence pitting non-compensatory against compensatory models. Advances in Psychological Science, 22(2), 205-219. https://doi.org/10.3724/SP.J.1042.2014.00205
doi: 10.3724/SP.J.1042.2014.00205 URL |
| [127] |
Zhang, Y. Y., Zhou, L., Li, S., & Liang, Z. Y. (2022). Computation of subjective value does not always elicit alternative-based information searching in intertemporal choice. Journal of Behavioral Decision Making, 35(4), Article e2274. https://doi.org/10.1002/bdm.2274
doi: 10.1002/bdm.v35.4 URL |
| [128] |
Zhou, L., Li, A. M., Zhang, L., Li, S., & Liang, Z. Y. (2019). Similarity in processes of risky choice and intertemporal choice: The case of certainty effect and immediacy effect. Acta Psychologica Sinica, 51(3), 337-352. https://doi.org/10.3724/SP.J.1041.2019.00337
doi: 10.3724/SP.J.1041.2019.00337 URL |
| [129] | Zhou, L., Xiao, S. Y., He, X. Y., Li, J., & Liu, H. M. (2006). Reliability and validity of Chinese version of Barratt Impulsiveness Scale-11. Chinese Journal of Clinical Psychology, 14(4), 343-344. https://doi.org/10.3969/j.issn.1005-3611.2006.04.005 |
| [130] |
Zhou, L., Zhang, Y. Y., Li, S., & Liang, Z. Y. (2018). New paradigms for the old question: Challenging the expectation rule held by risky decision-making theories. Journal of Pacific Rim Psychology, 12, e17. https://doi.org/10.1017/prp.2018.4
doi: 10.1017/prp.2018.4 URL |
| [131] | Zhou, L., Zhang, Y. Y., Wang, Z. J., Rao, L. L., Wang, W., Li, S., Li, X. S., & Liang, Z. Y. (2016). A scanpath analysis of the risky decision-making process. Journal of Behavioral Decision Making, 29(2-3), 169-182. https://doi.org/10.1002/bdm.1943 |
| [132] |
Zhou, Y. B., Li, Q., & Liu, H. Z. (2021). Visual attention and time preference reversals. Judgment and Decision Making, 16(4), 1010-1038. https://doi.org/10.1017/S1930297500008068
doi: 10.1017/S1930297500008068 URL |
| [133] |
Zhou, Y. B., Ruan, S. J., Zhang, K., Bao, Q., & Liu, H. Z. (2024). Time pressure effects on decision-making in intertemporal loss scenarios: An eye-tracking study. Frontiers in Psychology, 15, 1451674. https://doi.org/10.3389/fpsyg.2024.1451674
doi: 10.3389/fpsyg.2024.1451674 URL |
| [134] |
Zilker, V., & Pachur, T. (2022). Nonlinear probability weighting can reflect attentional biases in sequential sampling. Psychological Review, 129(5), 949-975. https://doi.org/10.31234/osf.io/dqexn
doi: 10.1037/rev0000304 URL |
| [135] |
Zilker, V., & Pachur, T. (2023). Attribute attention and option attention in risky choice. Cognition, 236, 105441. https://doi.org/10.1016/j.cognition.2023.105441
doi: 10.1016/j.cognition.2023.105441 URL |
| [1] | HU Xiaoyong, DU Tangyan, JI Yuexin, GONG Wenzhuo, WANG Dixin, GUO Yongyu. Myopic decision-making in lower-class under threats of scarcity [J]. Acta Psychologica Sinica, 2026, 58(2): 198-220. |
| [2] | HUANG Yuanna, JIANG Chengming, LIU Hongzhi, LI Shu. Toward a coherent understanding of risky, intertemporal, and spatial choices: Evidence from eye-tracking and subjective evaluation [J]. Acta Psychologica Sinica, 2023, 55(6): 994-1015. |
| [3] | LIU Hong-Zhi, YANG Xing-Lan, LI Qiu-Yue, WEI Zi-Han. Preference of dimension-based difference in intertemporal choice: Eye-tracking evidence [J]. Acta Psychologica Sinica, 2023, 55(4): 612-625. |
| [4] | SHEN Si-Chu, Khishignyam BAZARVAANI, DING Yang, MA Jia-Tao, YANG Shu-Wen, KUANG Yi, XU Ming-Xing, John E. TAPLIN, LI Shu. Changes in the intertemporal choices of people in or close to Chinese culture can predict their self-rated survival achievement in the fight against COVID-19: A cross-national study in 18 Asian, African, European, American, and Oceanian countries [J]. Acta Psychologica Sinica, 2023, 55(3): 435-454. |
| [5] | LIU Hong-Zhi, LI Xingshan, LI Shu, RAO Li-Lin. When expectation-maximization-based theories work or do not work: An eye-tracking study of the discrepancy between everyone and every one [J]. Acta Psychologica Sinica, 2022, 54(12): 1517-1531. |
| [6] | ZHAN Peida. Joint-cross-loading multimodal cognitive diagnostic modeling incorporating visual fixation counts [J]. Acta Psychologica Sinica, 2022, 54(11): 1416-1432. |
| [7] | SONG Xiyan, CHENG Yahua, XIE Zhouxiutian, GONG Nanyan, LIU Lei. The influence of anger on delay discounting: The mediating role of certainty and control [J]. Acta Psychologica Sinica, 2021, 53(5): 456-468. |
| [8] | ZHOU Lei, LI Ai-Mei, ZHANG Lei, LI Shu, LIANG Zhu-Yuan. Similarity in processes of risky choice and intertemporal choice: The case of certainty effect and immediacy effect [J]. Acta Psychologica Sinica, 2019, 51(3): 337-352. |
| [9] | WANG Peng, WANG Xiaotian, GAO Juan, LI Xialan, XU Jing. Adaptive time management: The effects of death awareness on time perception and intertemporal choice [J]. Acta Psychologica Sinica, 2019, 51(12): 1341-1350. |
| [10] | XU Lan,CHEN Quan,CUI Nan,LU Kaili. Enjoy the present or wait for the future? Effects of individuals’ view of time on intertemporal choice [J]. Acta Psychologica Sinica, 2019, 51(1): 96-105. |
| [11] | LI Aimei, WANG Haixia, SUN Hailong, XIONG Guanxing, YANG Shaoli . The nudge effect of “foresight for the future of our children”: Pregnancy and environmental intertemporal choice [J]. Acta Psychologica Sinica, 2018, 50(8): 858-867. |
| [12] | JIANG Cheng-Ming, LIU Hong-Zhi, CAI Xiao-Hong, LI Shu. A process test of priority models of intertemporal choice [J]. Acta Psychologica Sinica, 2016, 48(1): 59-72. |
| [13] | LIU Hong-Zhi, JIANG Cheng-Ming, RAO Li-Lin, LI Shu. Discounting or Priority: Which Rule Dominates the Intertemporal Choice Process? [J]. Acta Psychologica Sinica, 2015, 47(4): 522-532. |
| [14] | LI Aimei, PENG Yuan, XIONG Guanxing. Are Pregnant Women More Foresighted? #br# The Effect of Pregnancy on Intertemporal Choice [J]. Acta Psychologica Sinica, 2015, 47(11): 1360-1370. |
| [15] | CHEN Haixian;HE Guibing. The Effect of Psychological Distance on Intertemporal Choice and Risky Choice [J]. Acta Psychologica Sinica, 2014, 46(5): 677-690. |
| Viewed | ||||||
|
Full text |
|
|||||
|
Abstract |
|
|||||