ISSN 0439-755X
CN 11-1911/B
CN 11-1911/B
Acta Psychologica Sinica ›› 2025, Vol. 57 ›› Issue (12): 2149-2164.doi: 10.3724/SP.J.1041.2025.2149
• Reports of Empirical Studies • Previous Articles Next Articles
PENG Wang1,2,3, YAN Ping1,2,3, ZHOU Yaping1,2,3,4, Xiang Yanhui1,2,3( )
)
Received:2024-10-08
Published:2025-12-25
Online:2025-09-28
Contact:
Xiang Yanhui
E-mail:xiangyh@hunnu.edu.cn
Supported by:PENG Wang, YAN Ping, ZHOU Yaping, Xiang Yanhui. (2025). The impact of marriage on life satisfaction trajectories during emerging adulthood: A ten-year longitudinal study based on China Family Panel Studies. Acta Psychologica Sinica, 57(12), 2149-2164.
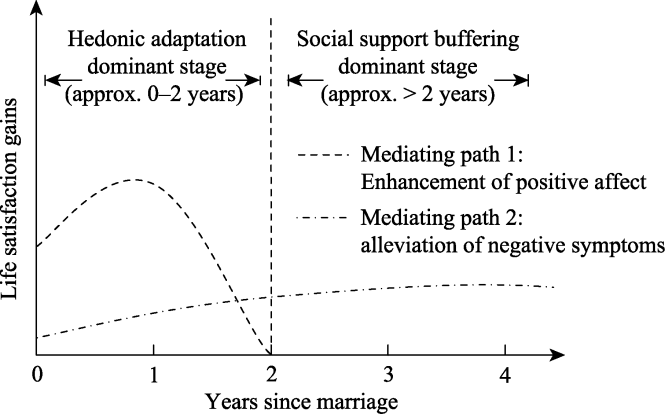
Figure 1 A hypothetical dual-stage and dual-pathway theoretical model of marriage effects on life satisfaction
| Age Stage | Sample Type | Control Group | Event Group | |
|---|---|---|---|---|
| Before matching | ||||
| 18~29 years | Overall sample | 5778 | 1603 | |
| After matching | ||||
| 18~29 years | Matched sample | 658 | 658 | |
| 18~21 years | Matched sample | 133 | 133 | |
| 22~25 years | Matched sample | 406 | 406 | |
| 26~29 years | Matched sample | 146 | 146 |
Table 1 Sample Sizes of Event Group and Control Group Before and After Propensity Score Matching
| Age Stage | Sample Type | Control Group | Event Group | |
|---|---|---|---|---|
| Before matching | ||||
| 18~29 years | Overall sample | 5778 | 1603 | |
| After matching | ||||
| 18~29 years | Matched sample | 658 | 658 | |
| 18~21 years | Matched sample | 133 | 133 | |
| 22~25 years | Matched sample | 406 | 406 | |
| 26~29 years | Matched sample | 146 | 146 |
| Variable | Before matching | After matching | ||||
|---|---|---|---|---|---|---|
| Event Group | Control Group | Standardized Mean Difference | Event Group | Control Group | Standardized Mean Difference | |
| Distance | 0.47 | 0.15 | 1.36 | 0.41 | 0.40 | 0.02 |
| Number of females, N (%) | 812(51)% | 2445(42%) | 0.17 | 303(46%) | 303(46%) | 0.00 |
| Age (years) | 20.28 | 19.97 | 0.10 | 18.74 | 18.74 | 0.00 |
| Years of education | 10.91 | 9.88 | 0.32 | 10.59 | 10.57 | 0.01 |
| Health status | 1.60 | 1.99 | ?0.46 | 1.59 | 1.72 | ?0.15 |
| Employment status | 0.42 | 0.24 | 0.37 | 0.22 | 0.22 | 0.00 |
| Personal income (RMB) | 8926.62 | 5884.50 | 0.13 | 5503.62 | 4109.30 | 0.06 |
| Number of measurements | 4.55 | 2.78 | 1.47 | 4.52 | 4.52 | 0.00 |
| First survey year | 2010.83 | 2013.29 | ?1.82 | 2010.88 | 2010.88 | 0.00 |
| Last survey year | 2018.79 | 2017.34 | 0.78 | 2018.70 | 2018.70 | 0.00 |
Table 2 Balance Improvement of Variables After Propensity Score Matching in Emerging Adulthood (18~29 Years)
| Variable | Before matching | After matching | ||||
|---|---|---|---|---|---|---|
| Event Group | Control Group | Standardized Mean Difference | Event Group | Control Group | Standardized Mean Difference | |
| Distance | 0.47 | 0.15 | 1.36 | 0.41 | 0.40 | 0.02 |
| Number of females, N (%) | 812(51)% | 2445(42%) | 0.17 | 303(46%) | 303(46%) | 0.00 |
| Age (years) | 20.28 | 19.97 | 0.10 | 18.74 | 18.74 | 0.00 |
| Years of education | 10.91 | 9.88 | 0.32 | 10.59 | 10.57 | 0.01 |
| Health status | 1.60 | 1.99 | ?0.46 | 1.59 | 1.72 | ?0.15 |
| Employment status | 0.42 | 0.24 | 0.37 | 0.22 | 0.22 | 0.00 |
| Personal income (RMB) | 8926.62 | 5884.50 | 0.13 | 5503.62 | 4109.30 | 0.06 |
| Number of measurements | 4.55 | 2.78 | 1.47 | 4.52 | 4.52 | 0.00 |
| First survey year | 2010.83 | 2013.29 | ?1.82 | 2010.88 | 2010.88 | 0.00 |
| Last survey year | 2018.79 | 2017.34 | 0.78 | 2018.70 | 2018.70 | 0.00 |
| Variable | Model A | Model B | Model C | ||||||
|---|---|---|---|---|---|---|---|---|---|
| Overall | Male | Female | Overall | Male | Female | Overall | Male | Female | |
| Intercept (b0) | 3.450* | 3.265* | 3.585* | 3.513* | 3.271* | 3.561* | 3.089* | 2.801* | 3.330* |
| Test effect(b1) | 0.039* | 0.069* | 0.010 | 0.032* | 0.065* | 0.014 | 0.122* | 0.152* | 0.075* |
| Baseline change×Group(b12) | 0.249* | 0.280* | 0.213* | ||||||
| Event year×Group(b13) | 0.225* | 0.301* | 0.157 | ||||||
| Linear anticipation×Group(b14) | 0.092* | 0.095* | 0.014 | ||||||
| Quadratic anticipation×Group(b15) | 0.010* | 0.008 | |||||||
| Linear reaction×Group(b16) | 0.059 | 0.050 | 0.051* | ||||||
| Quadratic reaction×Group(b17) | ?0.007 | ?0.007 | |||||||
Table 3 Changes in Life Satisfaction Before and After Marriage Among Emerging Adults (18~29 Years)
| Variable | Model A | Model B | Model C | ||||||
|---|---|---|---|---|---|---|---|---|---|
| Overall | Male | Female | Overall | Male | Female | Overall | Male | Female | |
| Intercept (b0) | 3.450* | 3.265* | 3.585* | 3.513* | 3.271* | 3.561* | 3.089* | 2.801* | 3.330* |
| Test effect(b1) | 0.039* | 0.069* | 0.010 | 0.032* | 0.065* | 0.014 | 0.122* | 0.152* | 0.075* |
| Baseline change×Group(b12) | 0.249* | 0.280* | 0.213* | ||||||
| Event year×Group(b13) | 0.225* | 0.301* | 0.157 | ||||||
| Linear anticipation×Group(b14) | 0.092* | 0.095* | 0.014 | ||||||
| Quadratic anticipation×Group(b15) | 0.010* | 0.008 | |||||||
| Linear reaction×Group(b16) | 0.059 | 0.050 | 0.051* | ||||||
| Quadratic reaction×Group(b17) | ?0.007 | ?0.007 | |||||||
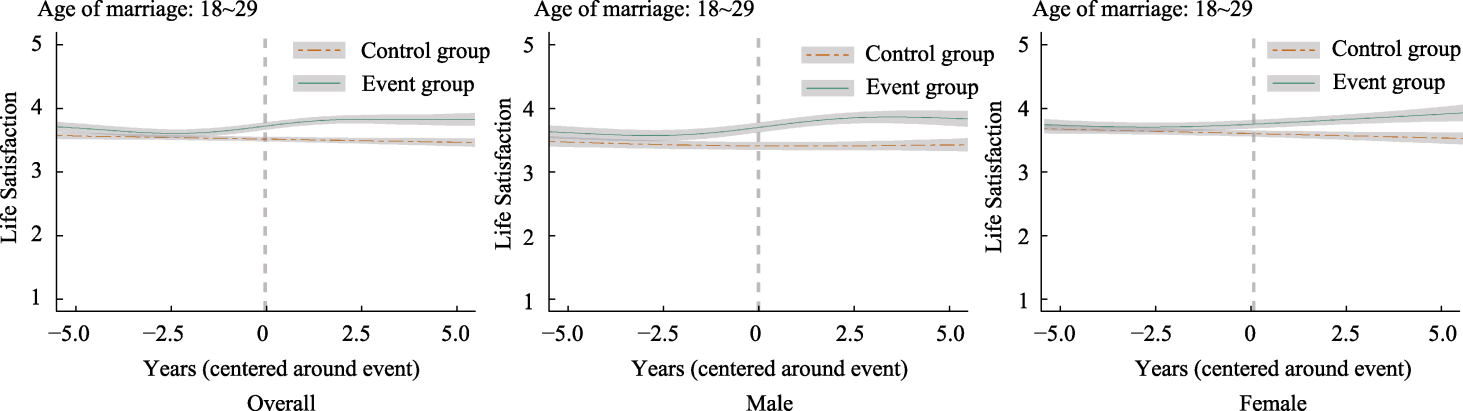
Figure 2 Trends in life satisfaction before and after marriage among individuals aged 18~29. From left to right: overall sample (regardless of gender), males, and females. The green solid bold line represents the model-estimated mean trajectory for the event group, and the red dashed bold line represents the model-estimated mean trajectory for the control group. Shaded areas around the bold lines indicate the 95% confidence intervals of the mean trajectories. Color version available in the online article (same below).
| Variable | 18~29 years | 18~21 years | 22~25 years | 26~29 years |
|---|---|---|---|---|
| Intercept(b0) | 3.553* | 3.511* | 3.561* | 3.528* |
| Testing(b1) | 0.039* | 0.096* | 0.041* | 0.041* |
| Gender×Group(b9) | 0.113 | 0.049 | 0.225* | 0.092 |
| Baseline change×Group×Gender(b10) | 0.016 | 0.242 | ?0.141 | 0.006 |
Table 4 Gender Differences in Baseline Changes Under Non-Gender- Specific Matching
| Variable | 18~29 years | 18~21 years | 22~25 years | 26~29 years |
|---|---|---|---|---|
| Intercept(b0) | 3.553* | 3.511* | 3.561* | 3.528* |
| Testing(b1) | 0.039* | 0.096* | 0.041* | 0.041* |
| Gender×Group(b9) | 0.113 | 0.049 | 0.225* | 0.092 |
| Baseline change×Group×Gender(b10) | 0.016 | 0.242 | ?0.141 | 0.006 |
| Variable | Model A | Model B | Model C | ||||||
|---|---|---|---|---|---|---|---|---|---|
| Overall | Male | Female | Overall | Male | Female | Overall | Male | Female | |
| Intercept (b0) | 3.466* | 3.242* | 3.523* | 3.545* | 3.247* | 3.496* | 2.889* | 2.812* | 3.084* |
| Test effect(b1) | 0.099* | 0.160* | 0.057 | 0.075 | 0.187+ | 0.034 | 0.264* | 0.238* | 0.174* |
| Baseline change×Group(b12) | ?0.020 | 0.018 | ?0.058 | ||||||
| Event year×Group(b13) | 0.059 | 0.150 | 0.180 | ||||||
| Linear anticipation×Group(b14) | 0.121 | 0.029 | 0.093 | ||||||
| Quadratic anticipation×Group(b15) | 0.015 | 0.006 | |||||||
| Linear reaction×Group(b16) | ?0.162+ | ?0.037 | ?0.152 | ||||||
| Quadratic reaction×Group(b17) | 0.023* | 0.014 | |||||||
Table 5 Changes in Life Satisfaction Before and After Marriage Among Emerging Adults (18~21 Years)
| Variable | Model A | Model B | Model C | ||||||
|---|---|---|---|---|---|---|---|---|---|
| Overall | Male | Female | Overall | Male | Female | Overall | Male | Female | |
| Intercept (b0) | 3.466* | 3.242* | 3.523* | 3.545* | 3.247* | 3.496* | 2.889* | 2.812* | 3.084* |
| Test effect(b1) | 0.099* | 0.160* | 0.057 | 0.075 | 0.187+ | 0.034 | 0.264* | 0.238* | 0.174* |
| Baseline change×Group(b12) | ?0.020 | 0.018 | ?0.058 | ||||||
| Event year×Group(b13) | 0.059 | 0.150 | 0.180 | ||||||
| Linear anticipation×Group(b14) | 0.121 | 0.029 | 0.093 | ||||||
| Quadratic anticipation×Group(b15) | 0.015 | 0.006 | |||||||
| Linear reaction×Group(b16) | ?0.162+ | ?0.037 | ?0.152 | ||||||
| Quadratic reaction×Group(b17) | 0.023* | 0.014 | |||||||
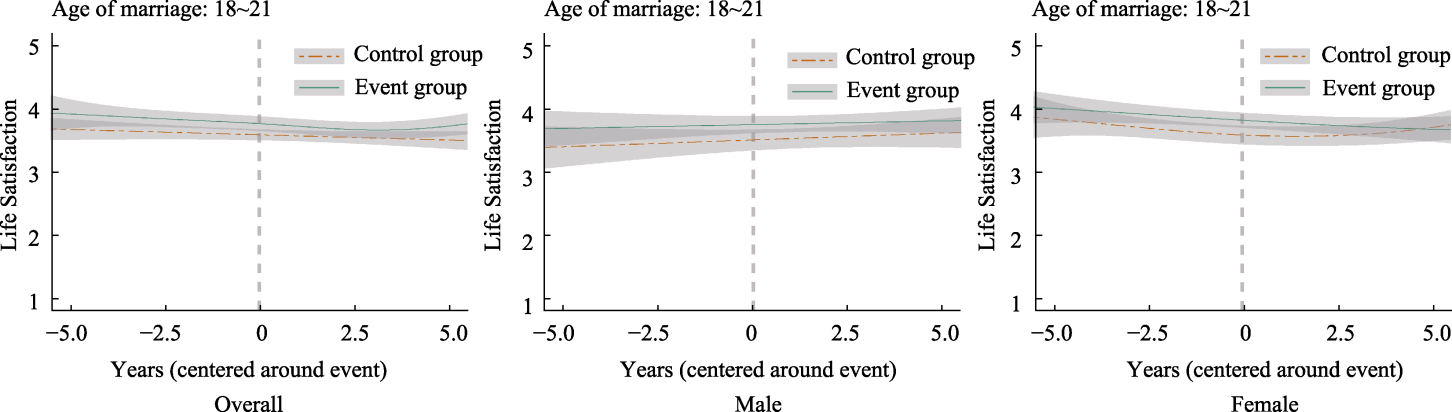
Figure 3 Trends in life satisfaction before and after marriage among individuals aged 18~21. From left to right: overall sample (regardless of gender), males, and females. The green solid bold line represents the model-estimated mean trajectory for the event group, and the red dashed bold line represents the model-estimated mean trajectory for the control group. Shaded areas around the bold lines indicate the 95% confidence intervals of the mean trajectories.
| Variable | Model A | Model B | Model C | ||||||
|---|---|---|---|---|---|---|---|---|---|
| Overall | Male | Female | Overall | Male | Female | Overall | Male | Female | |
| Intercept (b0) | 3.490* | 3.314* | 3.602* | 3.519* | 3.316* | 3.624* | 3.031* | 2.764* | 3.330* |
| Test effect(b1) | 0.040* | 0.064* | 0.006 | 0.036* | 0.072* | 0.002 | 0.131* | 0.192* | 0.067* |
| Baseline change×Group(b12) | 0.317* | 0.260* | 0.331* | ||||||
| Event year×Group(b13) | 0.292* | 0.290* | 0.207 | ||||||
| Linear anticipation×Group(b14) | 0.071 | 0.052 | 0.045 | ||||||
| Quadratic anticipation×Group(b15) | 0.008 | 0.004 | 0.005 | ||||||
| Linear reaction×Group(b16) | 0.105* | 0.091 | 0.164* | ||||||
| Quadratic reaction×Group(b17) | ?0.014* | ?0.015+ | ?0.020* | ||||||
Table 6 Changes in Life Satisfaction Before and After Marriage Among Emerging Adults (22~25 Years)
| Variable | Model A | Model B | Model C | ||||||
|---|---|---|---|---|---|---|---|---|---|
| Overall | Male | Female | Overall | Male | Female | Overall | Male | Female | |
| Intercept (b0) | 3.490* | 3.314* | 3.602* | 3.519* | 3.316* | 3.624* | 3.031* | 2.764* | 3.330* |
| Test effect(b1) | 0.040* | 0.064* | 0.006 | 0.036* | 0.072* | 0.002 | 0.131* | 0.192* | 0.067* |
| Baseline change×Group(b12) | 0.317* | 0.260* | 0.331* | ||||||
| Event year×Group(b13) | 0.292* | 0.290* | 0.207 | ||||||
| Linear anticipation×Group(b14) | 0.071 | 0.052 | 0.045 | ||||||
| Quadratic anticipation×Group(b15) | 0.008 | 0.004 | 0.005 | ||||||
| Linear reaction×Group(b16) | 0.105* | 0.091 | 0.164* | ||||||
| Quadratic reaction×Group(b17) | ?0.014* | ?0.015+ | ?0.020* | ||||||
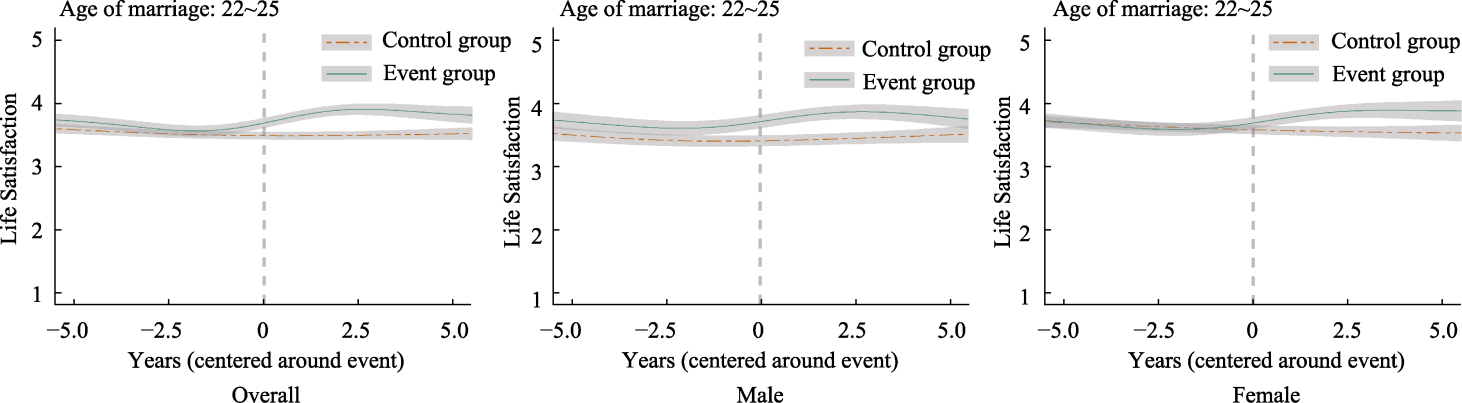
Figure 4 Trends in life satisfaction before and after marriage among individuals aged 22~25. From left to right: overall sample (regardless of gender), males, and females. The green solid bold line represents the model-estimated mean trajectory for the event group, and the red dashed bold line represents the model-estimated mean trajectory for the control group. Shaded areas around the bold lines indicate the 95% confidence intervals of the mean trajectories.
| Variable | Model A | Model B | Model C | ||||||
|---|---|---|---|---|---|---|---|---|---|
| Overall | Male | Female | Overall | Male | Female | Overall | Male | Female | |
| Intercept (b0) | 3.439* | 3.228* | 3.499* | 3.469* | 3.251* | 3.406* | 3.034* | 2.933* | 3.198* |
| Test effect(b1) | 0.058* | 0.084* | 0.007 | 0.054* | 0.076* | 0.012 | 0.134* | 0.139* | 0.078+ |
| Baseline change×Group(b12) | 0.235* | 0.171 | 0.335* | ||||||
| Event year×Group(b13) | 0.321* | 0.242 | 0.438+ | ||||||
| Linear anticipation×Group(b14) | 0.179* | ?0.000 | 0.165+ | ||||||
| Quadratic anticipation×Group(b15) | 0.020* | 0.018+ | |||||||
| Linear reaction×Group(b16) | ?0.044 | 0.015 | 0.022 | ||||||
| Quadratic reaction×Group(b17) | 0.006 | 0.002 | |||||||
Table 7 Changes in Life Satisfaction Before and After Marriage Among Emerging Adults (26~29 Years)
| Variable | Model A | Model B | Model C | ||||||
|---|---|---|---|---|---|---|---|---|---|
| Overall | Male | Female | Overall | Male | Female | Overall | Male | Female | |
| Intercept (b0) | 3.439* | 3.228* | 3.499* | 3.469* | 3.251* | 3.406* | 3.034* | 2.933* | 3.198* |
| Test effect(b1) | 0.058* | 0.084* | 0.007 | 0.054* | 0.076* | 0.012 | 0.134* | 0.139* | 0.078+ |
| Baseline change×Group(b12) | 0.235* | 0.171 | 0.335* | ||||||
| Event year×Group(b13) | 0.321* | 0.242 | 0.438+ | ||||||
| Linear anticipation×Group(b14) | 0.179* | ?0.000 | 0.165+ | ||||||
| Quadratic anticipation×Group(b15) | 0.020* | 0.018+ | |||||||
| Linear reaction×Group(b16) | ?0.044 | 0.015 | 0.022 | ||||||
| Quadratic reaction×Group(b17) | 0.006 | 0.002 | |||||||
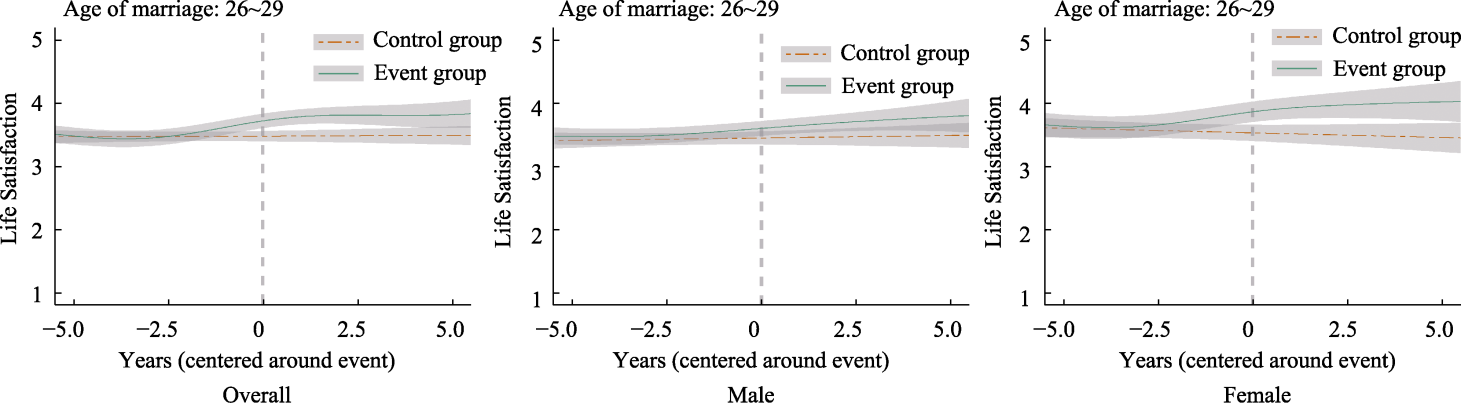
Figure 5 Trends in life satisfaction before and after marriage among individuals aged 22~25. From left to right: overall sample (regardless of gender), males, and females. The green solid bold line represents the model-estimated mean trajectory for the event group, and the red dashed bold line represents the model-estimated mean trajectory for the control group. Shaded areas around the bold lines indicate the 95% confidence intervals of the mean trajectories.
| Stage | Mediating Path | Whole Period | Within Two Years After Marriage | Beyond Two Years After Marriage | Mechanism Summary | |||
|---|---|---|---|---|---|---|---|---|
| β | CI | β | CI | β | CI | |||
| 18~29 years | Positive affect+ | 0.016** | [0.005, 0.027] | 0.017* | [0.000, 0.038] | 0.024*** | [0.008, 0.044] | Dual pathway, long-term stability |
| Negative symptoms? | 0.020** | [0.006, 0.034] | 0.023* | [0.004, 0.048] | 0.036** | [0.013, 0.064] | ||
| 18~21 years | Positive affect+ | 0.010 | [?0.014, 0.041] | 0.009 | [?0.058, 0.077] | 0.008 | [?0.013, 0.046] | ? |
| Negative symptoms? | 0.004 | [?0.032, 0.044] | 0.076 | [?0.022, 0.195] | ?0.025 | [?0.078, 0.029] | ||
| 22~25 years | Positive affect+ | 0.018* | [0.003, 0.035] | 0.038* | [0.008, 0.076] | 0.014 | [?0.005, 0.036] | Dual pathway, mechanism shift |
| Negative symptoms? | 0.021* | [0.004, 0.041] | 0.014 | [?0.005, 0.040] | 0.045** | [0.015, 0.082] | ||
| 26~29 years | Positive affect+ | 0.006 | [?0.012, 0.028] | 0.010 | [?0.019, 0.047] | 0.004 | [?0.026, 0.035] | Single pathway, long-term stability |
| Negative symptoms? | 0.043** | [0.010, 0.081] | 0.040+ | [?0.005, 0.114] | 0.076* | [0.011, 0.159] | ||
Table 8 Mediating Effects of Positive Affect and Negative Symptoms Before and After Marriage Across Stages of Emerging Adulthood
| Stage | Mediating Path | Whole Period | Within Two Years After Marriage | Beyond Two Years After Marriage | Mechanism Summary | |||
|---|---|---|---|---|---|---|---|---|
| β | CI | β | CI | β | CI | |||
| 18~29 years | Positive affect+ | 0.016** | [0.005, 0.027] | 0.017* | [0.000, 0.038] | 0.024*** | [0.008, 0.044] | Dual pathway, long-term stability |
| Negative symptoms? | 0.020** | [0.006, 0.034] | 0.023* | [0.004, 0.048] | 0.036** | [0.013, 0.064] | ||
| 18~21 years | Positive affect+ | 0.010 | [?0.014, 0.041] | 0.009 | [?0.058, 0.077] | 0.008 | [?0.013, 0.046] | ? |
| Negative symptoms? | 0.004 | [?0.032, 0.044] | 0.076 | [?0.022, 0.195] | ?0.025 | [?0.078, 0.029] | ||
| 22~25 years | Positive affect+ | 0.018* | [0.003, 0.035] | 0.038* | [0.008, 0.076] | 0.014 | [?0.005, 0.036] | Dual pathway, mechanism shift |
| Negative symptoms? | 0.021* | [0.004, 0.041] | 0.014 | [?0.005, 0.040] | 0.045** | [0.015, 0.082] | ||
| 26~29 years | Positive affect+ | 0.006 | [?0.012, 0.028] | 0.010 | [?0.019, 0.047] | 0.004 | [?0.026, 0.035] | Single pathway, long-term stability |
| Negative symptoms? | 0.043** | [0.010, 0.081] | 0.040+ | [?0.005, 0.114] | 0.076* | [0.011, 0.159] | ||
| Year | Event Group | Control Group | ||||
|---|---|---|---|---|---|---|
| M | SD | N | M | SD | N | |
| 2010 | 3.52 | 1.00 | 434 | 3.64 | 0.98 | 434 |
| 2011 | 5.00 | NA | 1 | 4.00 | NA | 1 |
| 2012 | 3.32 | 0.90 | 521 | 3.48 | 0.92 | 536 |
| 2013 | 3.20 | 0.63 | 19 | 3.00 | 1.41 | 9 |
| 2014 | 3.74 | 0.91 | 493 | 3.90 | 0.90 | 506 |
| 2015 | 3.88 | 0.81 | 63 | 3.23 | 0.73 | 54 |
| 2016 | 3.48 | 0.95 | 393 | 3.59 | 0.91 | 399 |
| 2017 | 3.30 | 0.96 | 158 | 3.39 | 1.04 | 148 |
| 2018 | 3.58 | 0.90 | 475 | 3.88 | 0.81 | 463 |
| 2019 | 3.83 | 0.58 | 12 | 3.33 | 1.24 | 19 |
| 2020 | 3.50 | 0.82 | 406 | 4.02 | 0.79 | 406 |
Table S1 Means (M), Standard Deviations (SD), and Sample Sizes (N) of Life Satisfaction (LS) for the Event Group and Control Group by Survey Year
| Year | Event Group | Control Group | ||||
|---|---|---|---|---|---|---|
| M | SD | N | M | SD | N | |
| 2010 | 3.52 | 1.00 | 434 | 3.64 | 0.98 | 434 |
| 2011 | 5.00 | NA | 1 | 4.00 | NA | 1 |
| 2012 | 3.32 | 0.90 | 521 | 3.48 | 0.92 | 536 |
| 2013 | 3.20 | 0.63 | 19 | 3.00 | 1.41 | 9 |
| 2014 | 3.74 | 0.91 | 493 | 3.90 | 0.90 | 506 |
| 2015 | 3.88 | 0.81 | 63 | 3.23 | 0.73 | 54 |
| 2016 | 3.48 | 0.95 | 393 | 3.59 | 0.91 | 399 |
| 2017 | 3.30 | 0.96 | 158 | 3.39 | 1.04 | 148 |
| 2018 | 3.58 | 0.90 | 475 | 3.88 | 0.81 | 463 |
| 2019 | 3.83 | 0.58 | 12 | 3.33 | 1.24 | 19 |
| 2020 | 3.50 | 0.82 | 406 | 4.02 | 0.79 | 406 |
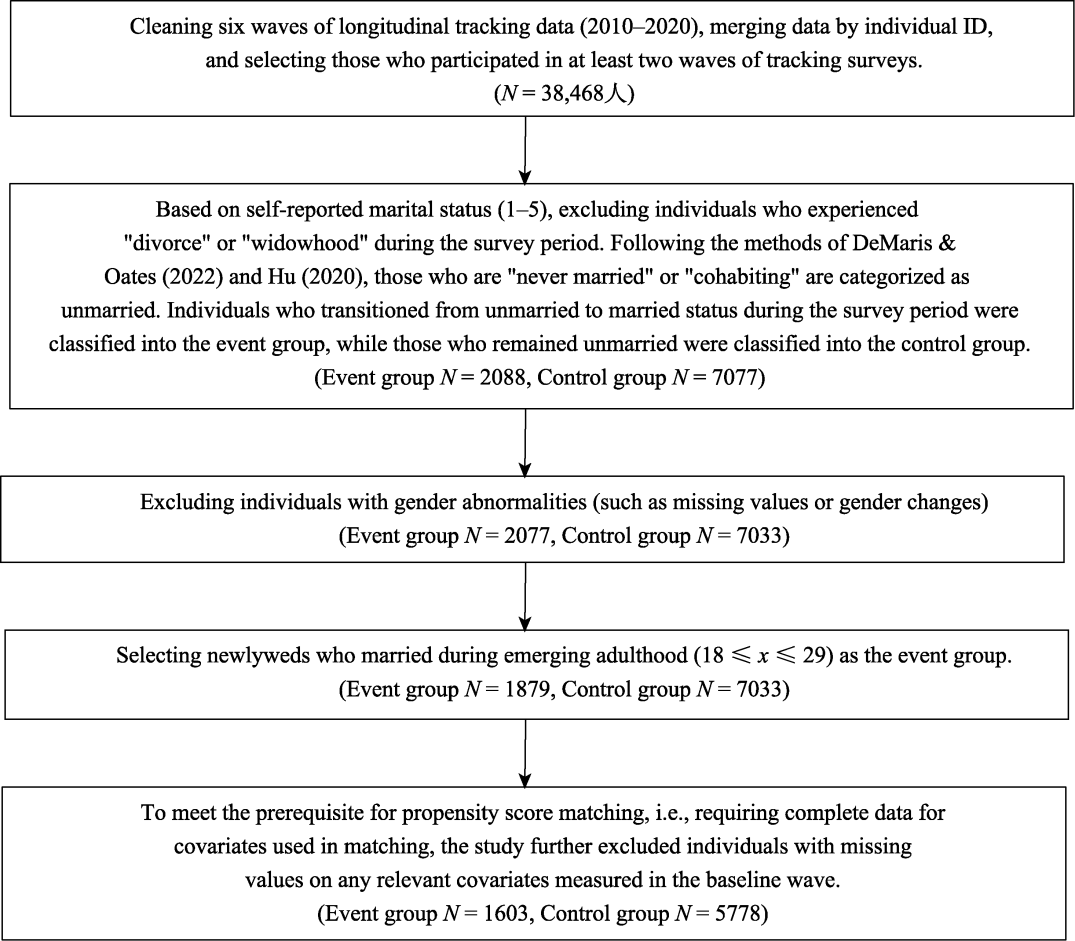
Figure S1 Sample Data Cleaning Flowchart
| Variable | Before matching | After matching | ||||
|---|---|---|---|---|---|---|
| Event Group | Control Group | Standardized Mean Difference | Event Group | Control Group | Standardized Mean Difference | |
| 0.02 | 0.47 | 0.15 | 1.36 | 0.41 | 0.40 | |
| 0.00 | 812(51)% | 2445(42%) | 0.17 | 303(46%) | 303(46%) | |
| 0.00 | 20.28 | 19.97 | 0.10 | 18.74 | 18.74 | |
| 0.01 | 10.91 | 9.88 | 0.32 | 10.59 | 10.57 | |
| ?0.15 | 1.60 | 1.99 | ?0.46 | 1.59 | 1.72 | |
| 0.00 | 0.42 | 0.24 | 0.37 | 0.22 | 0.22 | |
| 0.06 | 8926.62 | 5884.50 | 0.13 | 5503.62 | 4109.30 | |
| 0.00 | 4.55 | 2.78 | 1.47 | 4.52 | 4.52 | |
| 0.00 | 2010.83 | 2013.29 | ?1.82 | 2010.88 | 2010.88 | |
| 0.00 | 2018.79 | 2017.34 | 0.78 | 2018.70 | 2018.70 | |
Table S2 Balance Improvement of Variables Before and After Propensity Score Matching: Emerging Adulthood (Ages 18~29)
| Variable | Before matching | After matching | ||||
|---|---|---|---|---|---|---|
| Event Group | Control Group | Standardized Mean Difference | Event Group | Control Group | Standardized Mean Difference | |
| 0.02 | 0.47 | 0.15 | 1.36 | 0.41 | 0.40 | |
| 0.00 | 812(51)% | 2445(42%) | 0.17 | 303(46%) | 303(46%) | |
| 0.00 | 20.28 | 19.97 | 0.10 | 18.74 | 18.74 | |
| 0.01 | 10.91 | 9.88 | 0.32 | 10.59 | 10.57 | |
| ?0.15 | 1.60 | 1.99 | ?0.46 | 1.59 | 1.72 | |
| 0.00 | 0.42 | 0.24 | 0.37 | 0.22 | 0.22 | |
| 0.06 | 8926.62 | 5884.50 | 0.13 | 5503.62 | 4109.30 | |
| 0.00 | 4.55 | 2.78 | 1.47 | 4.52 | 4.52 | |
| 0.00 | 2010.83 | 2013.29 | ?1.82 | 2010.88 | 2010.88 | |
| 0.00 | 2018.79 | 2017.34 | 0.78 | 2018.70 | 2018.70 | |
| ControlGroup | Event Group | |
|---|---|---|
| Total sample | 5778 | 1603 |
| Matched sample | 658 | 658 |
| Unmatched sample | 5120 | 945 |
| Discarded sample | 0 | 0 |
Table S3 Sample Sizes of Event and Control Groups After Propensity Score Matching: Emerging Adulthood (Ages 18~29)
| ControlGroup | Event Group | |
|---|---|---|
| Total sample | 5778 | 1603 |
| Matched sample | 658 | 658 |
| Unmatched sample | 5120 | 945 |
| Discarded sample | 0 | 0 |
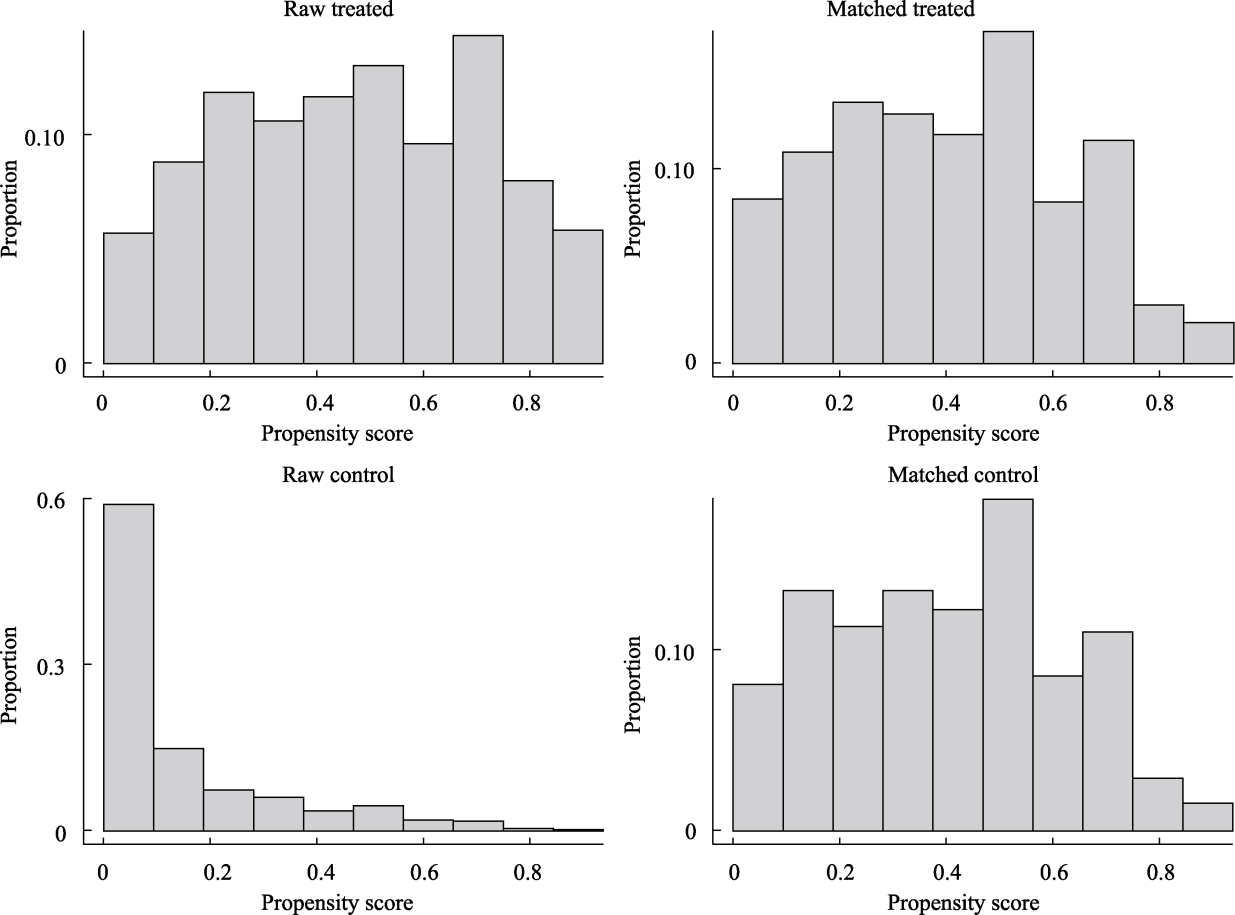
Figure S2 Propensity score distribution histograms of event and control groups before and after matching: Emerging adulthood (ages 18~29).
| Variable | Before matching | After matching | ||||
|---|---|---|---|---|---|---|
| Event Group | Control Group | Standardized Mean Difference | Event Group | Control Group | Standardized Mean Difference | |
| Distance | 0.43 | 0.14 | 1.28 | 0.39 | 0.39 | 0.02 |
| Number of males, N (%) | 791(100%) | 3333(100%) | 0.00 | 334(100%) | 334(100%) | 0.00 |
| Age (years) | 20.75 | 21.18 | ?0.14 | 19.22 | 19.22 | 0.00 |
| Years of education | 10.84 | 9.56 | 0.39 | 10.54 | 10.59 | ?0.02 |
| Health status | 1.57 | 1.96 | ?0.46 | 1.54 | 1.66 | ?0.13 |
| Employment status | 0.47 | 0.27 | 0.39 | 0.28 | 0.27 | 0.02 |
| Personal income (RMB) | 11435.18 | 7091.17 | 0.14 | 7050.60 | 4987.62 | 0.07 |
| Number of measurements | 4.64 | 2.90 | 1.52 | 4.68 | 4.68 | 0.00 |
| First survey year | 2010.79 | 2013.08 | ?1.80 | 2010.75 | 2010.75 | 0.00 |
| Last survey year | 2018.90 | 2017.44 | 0.85 | 2018.92 | 2018.92 | 0.00 |
Table S4 Balance Improvement of Variables Before and After Propensity Score Matching: Emerging Adulthood (Ages 18~29), Male
| Variable | Before matching | After matching | ||||
|---|---|---|---|---|---|---|
| Event Group | Control Group | Standardized Mean Difference | Event Group | Control Group | Standardized Mean Difference | |
| Distance | 0.43 | 0.14 | 1.28 | 0.39 | 0.39 | 0.02 |
| Number of males, N (%) | 791(100%) | 3333(100%) | 0.00 | 334(100%) | 334(100%) | 0.00 |
| Age (years) | 20.75 | 21.18 | ?0.14 | 19.22 | 19.22 | 0.00 |
| Years of education | 10.84 | 9.56 | 0.39 | 10.54 | 10.59 | ?0.02 |
| Health status | 1.57 | 1.96 | ?0.46 | 1.54 | 1.66 | ?0.13 |
| Employment status | 0.47 | 0.27 | 0.39 | 0.28 | 0.27 | 0.02 |
| Personal income (RMB) | 11435.18 | 7091.17 | 0.14 | 7050.60 | 4987.62 | 0.07 |
| Number of measurements | 4.64 | 2.90 | 1.52 | 4.68 | 4.68 | 0.00 |
| First survey year | 2010.79 | 2013.08 | ?1.80 | 2010.75 | 2010.75 | 0.00 |
| Last survey year | 2018.90 | 2017.44 | 0.85 | 2018.92 | 2018.92 | 0.00 |
| ControlGroup | Event Group | |
|---|---|---|
| Total sample | 3333 | 791 |
| Matched sample | 334 | 334 |
| Unmatched sample | 2999 | 457 |
| Discarded sample | 0 | 0 |
Table S5 Sample Sizes of Event and Control Groups After Propensity Score Matching: Emerging Adulthood (Ages 18~29), Male
| ControlGroup | Event Group | |
|---|---|---|
| Total sample | 3333 | 791 |
| Matched sample | 334 | 334 |
| Unmatched sample | 2999 | 457 |
| Discarded sample | 0 | 0 |
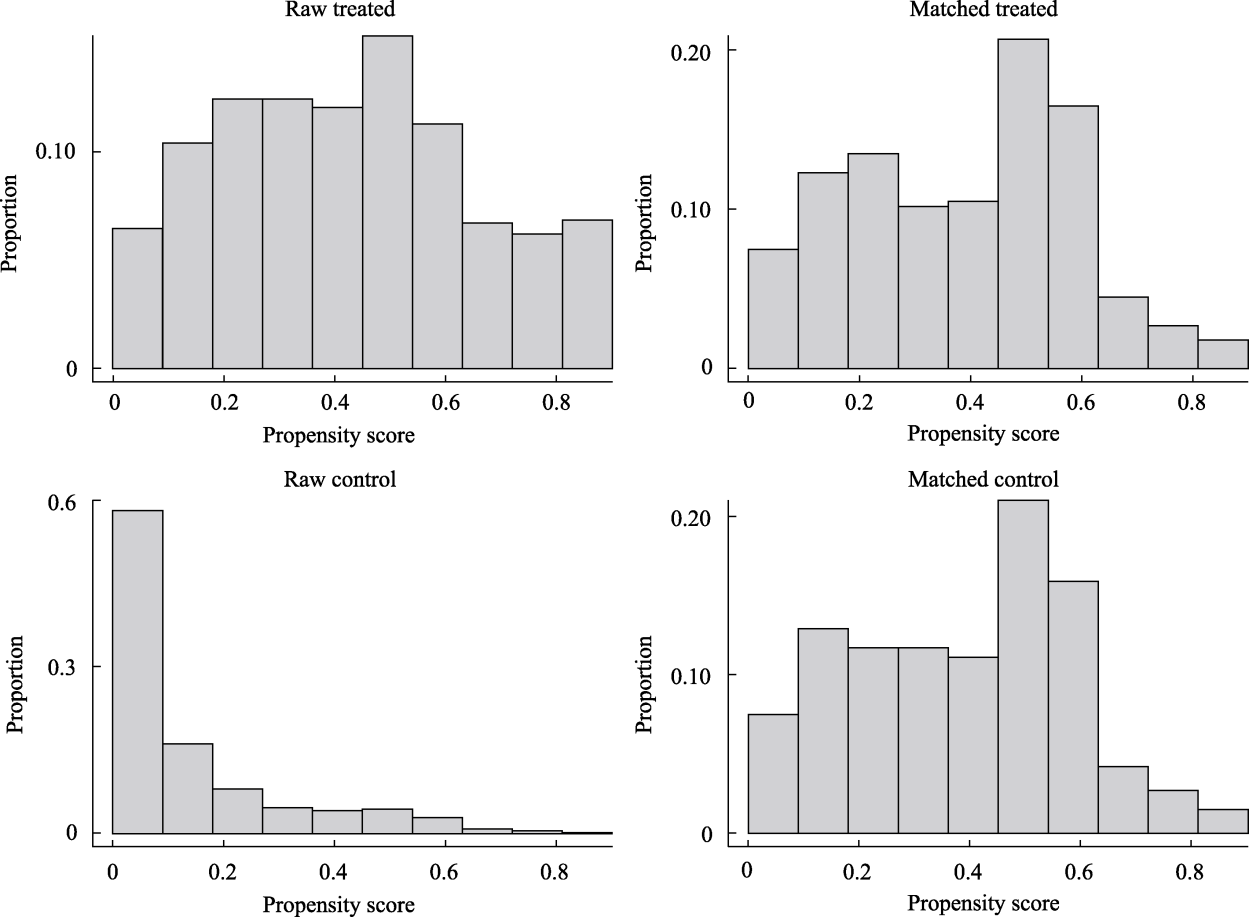
Figure S3 Propensity score distribution histograms of event and control groups before and after matching: Emerging adulthood (ages 18~29), Male
| Variable | Before matching | After matching | ||||
|---|---|---|---|---|---|---|
| Event Group | Control Group | Standardized Mean Difference | Event Group | Control Group | Standardized Mean Difference | |
| Distance | 0.53 | 0.16 | 1.52 | 0.43 | 0.42 | 0.01 |
| Number of females, N (%) | 812(100%) | 2445(42%) | 0.00 | 338(100%) | 338(100%) | 0.00 |
| Age (years) | 19.82 | 18.32 | 0.50 | 18.27 | 18.27 | 0.00 |
| Years of education | 10.98 | 10.32 | 0.21 | 10.45 | 10.80 | ?0.11 |
| Health status | 1.62 | 2.03 | ?0.48 | 1.58 | 1.71 | ?0.16 |
| Employment status | 0.36 | 0.19 | 0.37 | 0.18 | 0.18 | 0.00 |
| Personal income (RMB) | 6482.95 | 4239.57 | 0.20 | 4347.80 | 2804.76 | 0.14 |
| Number of measurements | 4.46 | 2.63 | 1.48 | 4.28 | 4.28 | 0.00 |
| First survey year | 2010.87 | 2013.57 | ?1.91 | 2010.97 | 2010.97 | 0.00 |
| Last survey year | 2018.68 | 2017.20 | 0.75 | 2018.27 | 2018.27 | 0.00 |
Table S6 Balance Improvement of Variables Before and After Propensity Score Matching: Emerging Adulthood (Ages 18~29), Female
| Variable | Before matching | After matching | ||||
|---|---|---|---|---|---|---|
| Event Group | Control Group | Standardized Mean Difference | Event Group | Control Group | Standardized Mean Difference | |
| Distance | 0.53 | 0.16 | 1.52 | 0.43 | 0.42 | 0.01 |
| Number of females, N (%) | 812(100%) | 2445(42%) | 0.00 | 338(100%) | 338(100%) | 0.00 |
| Age (years) | 19.82 | 18.32 | 0.50 | 18.27 | 18.27 | 0.00 |
| Years of education | 10.98 | 10.32 | 0.21 | 10.45 | 10.80 | ?0.11 |
| Health status | 1.62 | 2.03 | ?0.48 | 1.58 | 1.71 | ?0.16 |
| Employment status | 0.36 | 0.19 | 0.37 | 0.18 | 0.18 | 0.00 |
| Personal income (RMB) | 6482.95 | 4239.57 | 0.20 | 4347.80 | 2804.76 | 0.14 |
| Number of measurements | 4.46 | 2.63 | 1.48 | 4.28 | 4.28 | 0.00 |
| First survey year | 2010.87 | 2013.57 | ?1.91 | 2010.97 | 2010.97 | 0.00 |
| Last survey year | 2018.68 | 2017.20 | 0.75 | 2018.27 | 2018.27 | 0.00 |
| ControlGroup | Event Group | |
|---|---|---|
| Total sample | 2445 | 812 |
| Matched sample | 338 | 338 |
| Unmatched sample | 2107 | 474 |
| Discarded sample | 0 | 0 |
Table S7 Sample Sizes of Event and Control Groups After Propensity Score Matching: Emerging Adulthood (Ages 18~29), Female
| ControlGroup | Event Group | |
|---|---|---|
| Total sample | 2445 | 812 |
| Matched sample | 338 | 338 |
| Unmatched sample | 2107 | 474 |
| Discarded sample | 0 | 0 |
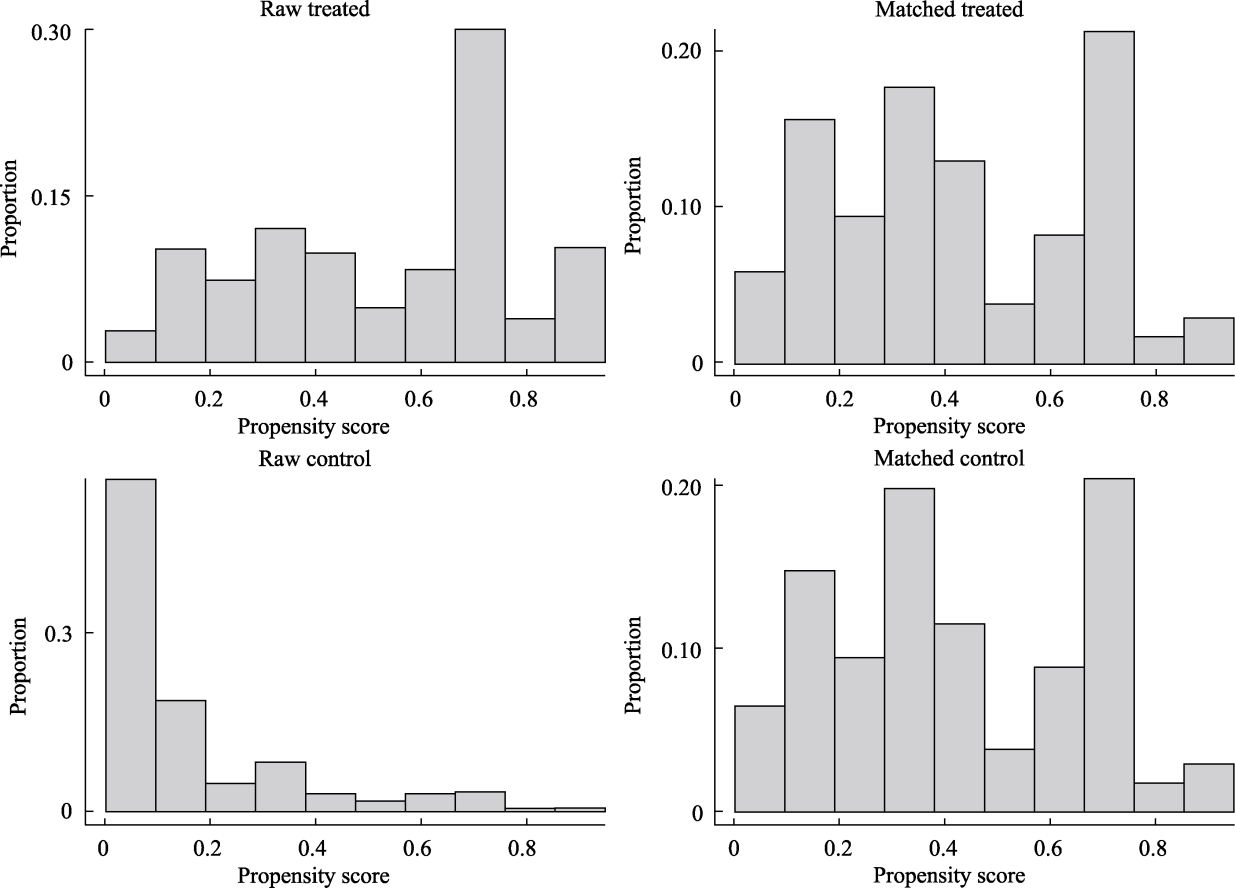
Figure S4 Propensity score distribution histograms of event and control groups before and after matching: Emerging adulthood (ages 18~29), Female
Variable | Before matching | After matching | ||||
|---|---|---|---|---|---|---|
| Event Group | Control Group | Standardized Mean Difference | Event Group | Control Group | Standardized Mean Difference | |
| Distance | 0.18 | 0.04 | 0.85 | 0.11 | 0.11 | 0.01 |
| Number of females, N (%) | 179(67%) | 2445(42%) | 0.53 | 83(62%) | 83(62%) | 0.00 |
| Age (years) | 17.57 | 19.97 | ?1.41 | 16.99 | 16.99 | 0.00 |
| Years of education | 8.68 | 9.88 | ?0.44 | 9.20 | 9.53 | ?0.12 |
| Health status | 1.67 | 1.99 | ?0.35 | 1.74 | 1.63 | 0.12 |
| Employment status | 0.39 | 0.24 | 0.31 | 0.12 | 0.11 | 0.02 |
| Personal income (RMB) | 5588.00 | 5884.50 | ?0.03 | 3045.75 | 1723.01 | 0.15 |
| Number of measurements | 4.14 | 2.78 | 1.10 | 4.11 | 4.11 | 0.00 |
| First survey year | 2011.35 | 2013.29 | ?1.05 | 2011.46 | 2011.46 | 0.00 |
| Last survey year | 2018.41 | 2017.34 | 0.53 | 2018.27 | 2018.27 | 0.00 |
Table S8 Balance Improvement of Variables Before and After Propensity Score Matching: Emerging Adulthood (Ages 18~21)
Variable | Before matching | After matching | ||||
|---|---|---|---|---|---|---|
| Event Group | Control Group | Standardized Mean Difference | Event Group | Control Group | Standardized Mean Difference | |
| Distance | 0.18 | 0.04 | 0.85 | 0.11 | 0.11 | 0.01 |
| Number of females, N (%) | 179(67%) | 2445(42%) | 0.53 | 83(62%) | 83(62%) | 0.00 |
| Age (years) | 17.57 | 19.97 | ?1.41 | 16.99 | 16.99 | 0.00 |
| Years of education | 8.68 | 9.88 | ?0.44 | 9.20 | 9.53 | ?0.12 |
| Health status | 1.67 | 1.99 | ?0.35 | 1.74 | 1.63 | 0.12 |
| Employment status | 0.39 | 0.24 | 0.31 | 0.12 | 0.11 | 0.02 |
| Personal income (RMB) | 5588.00 | 5884.50 | ?0.03 | 3045.75 | 1723.01 | 0.15 |
| Number of measurements | 4.14 | 2.78 | 1.10 | 4.11 | 4.11 | 0.00 |
| First survey year | 2011.35 | 2013.29 | ?1.05 | 2011.46 | 2011.46 | 0.00 |
| Last survey year | 2018.41 | 2017.34 | 0.53 | 2018.27 | 2018.27 | 0.00 |
| ControlGroup | Event Group | |
|---|---|---|
| Total sample | 5778 | 266 |
| Matched sample | 133 | 133 |
| Unmatched sample | 5645 | 133 |
| Discarded sample | 0 | 0 |
Table S9 Sample Sizes of Event and Control Groups After Propensity Score Matching: Emerging Adulthood (Ages 18~21)
| ControlGroup | Event Group | |
|---|---|---|
| Total sample | 5778 | 266 |
| Matched sample | 133 | 133 |
| Unmatched sample | 5645 | 133 |
| Discarded sample | 0 | 0 |
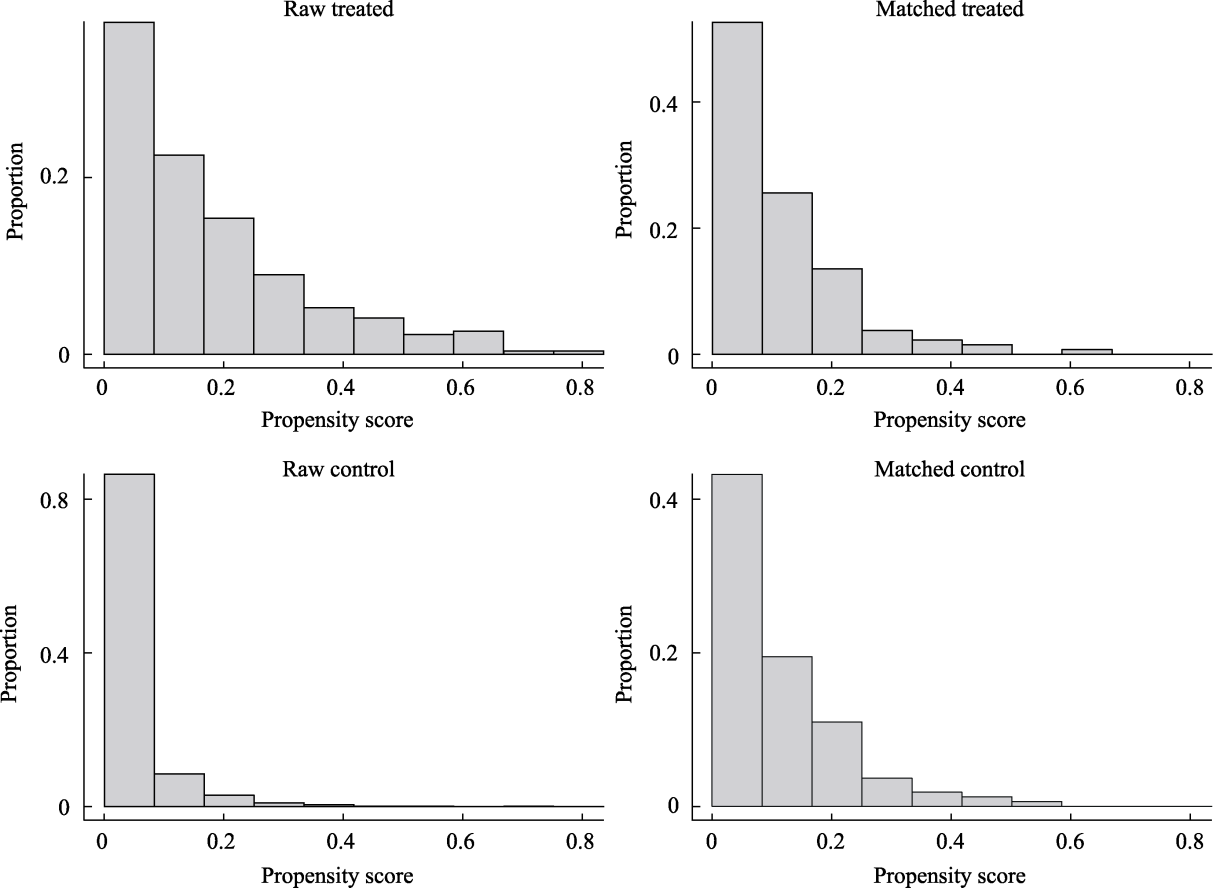
Figure S5 Propensity score distribution histograms of event and control groups before and after matching: Emerging adulthood (ages 18~21)
| Variable | Before matching | After matching | ||||
|---|---|---|---|---|---|---|
| Event Group | Control Group | Standardized Mean Difference | Event Group | Control Group | Standardized Mean Difference | |
| Distance | 0.11 | 0.02 | 0.81 | 0.07 | 0.07 | 0.01 |
| Number of males, N (%) | 87(100%) | 3333(100%) | 0.00 | 45(100%) | 45(100%) | 0.00 |
| Age (years) | 17.84 | 21.18 | ?1.92 | 17.42 | 17.42 | 0.00 |
| Years of education | 8.80 | 9.56 | ?0.31 | 9.69 | 9.60 | 0.04 |
| Health status | 1.48 | 1.96 | ?0.60 | 1.40 | 1.60 | ?0.25 |
| Employment status | 0.46 | 0.27 | 0.37 | 0.20 | 0.20 | 0.00 |
| Personal income (RMB) | 5925.79 | 7091.17 | ?0.14 | 3794.34 | 2064.89 | 0.20 |
| Number of measurements | 4.44 | 2.90 | 1.24 | 4.36 | 4.36 | 0.00 |
| First survey year | 2011.10 | 2013.08 | ?1.13 | 2011.18 | 2011.18 | 0.00 |
| Last survey year | 2018.68 | 2017.44 | 0.69 | 2018.58 | 2018.58 | 0.00 |
Table S10 Balance Improvement of Variables Before and After Propensity Score Matching: Emerging Adulthood (Ages 18~21), Male
| Variable | Before matching | After matching | ||||
|---|---|---|---|---|---|---|
| Event Group | Control Group | Standardized Mean Difference | Event Group | Control Group | Standardized Mean Difference | |
| Distance | 0.11 | 0.02 | 0.81 | 0.07 | 0.07 | 0.01 |
| Number of males, N (%) | 87(100%) | 3333(100%) | 0.00 | 45(100%) | 45(100%) | 0.00 |
| Age (years) | 17.84 | 21.18 | ?1.92 | 17.42 | 17.42 | 0.00 |
| Years of education | 8.80 | 9.56 | ?0.31 | 9.69 | 9.60 | 0.04 |
| Health status | 1.48 | 1.96 | ?0.60 | 1.40 | 1.60 | ?0.25 |
| Employment status | 0.46 | 0.27 | 0.37 | 0.20 | 0.20 | 0.00 |
| Personal income (RMB) | 5925.79 | 7091.17 | ?0.14 | 3794.34 | 2064.89 | 0.20 |
| Number of measurements | 4.44 | 2.90 | 1.24 | 4.36 | 4.36 | 0.00 |
| First survey year | 2011.10 | 2013.08 | ?1.13 | 2011.18 | 2011.18 | 0.00 |
| Last survey year | 2018.68 | 2017.44 | 0.69 | 2018.58 | 2018.58 | 0.00 |
| ControlGroup | Event Group | |
|---|---|---|
| Total sample | 3333 | 87 |
| Matched sample | 45 | 45 |
| Unmatched sample | 3288 | 42 |
| Discarded sample | 0 | 0 |
Table S11 Sample Sizes of Event and Control Groups After Propensity Score Matching: Emerging Adulthood (Ages 18~21), Male
| ControlGroup | Event Group | |
|---|---|---|
| Total sample | 3333 | 87 |
| Matched sample | 45 | 45 |
| Unmatched sample | 3288 | 42 |
| Discarded sample | 0 | 0 |
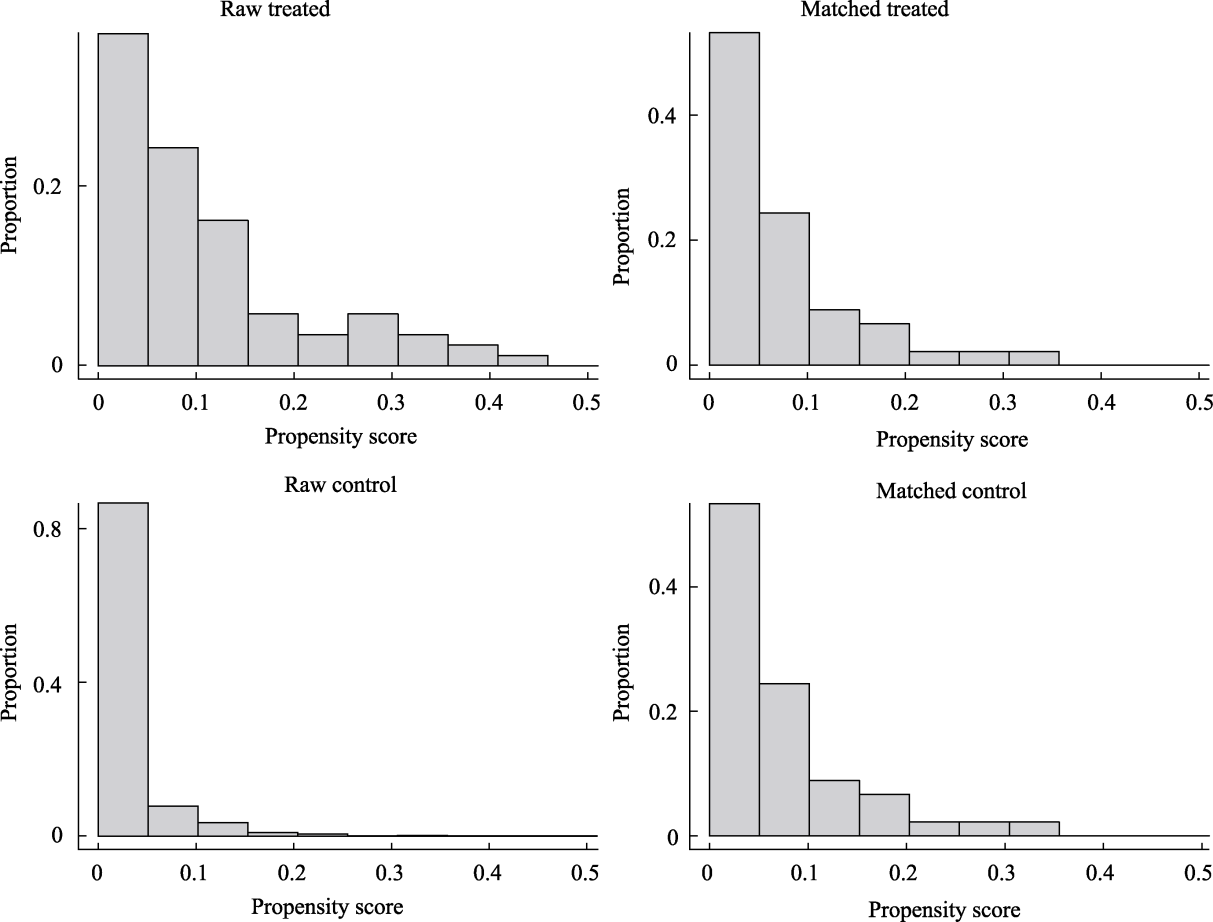
Figure S6 Propensity score distribution histograms of event and control groups before and after matching: Emerging adulthood (ages 18~21), Male
| Variable | Before matching | After matching | ||||
|---|---|---|---|---|---|---|
| Event Group | Control Group | Standardized Mean Difference | Event Group | Control Group | Standardized Mean Difference | |
| Distance | 0.22 | 0.06 | 0.88 | 0.13 | 0.13 | 0.00 |
| Number of females, N (%) | 179(100%) | 2445(100%) | 0.00 | 81(100%) | 81(100%) | 0.00 |
| Age (years) | 17.44 | 18.32 | ?0.53 | 16.75 | 16.75 | 0.00 |
| Years of education | 8.63 | 10.32 | ?0.59 | 9.25 | 9.22 | 0.01 |
| Health status | 1.76 | 2.03 | ?0.29 | 1.80 | 1.74 | 0.07 |
| Employment status | 0.35 | 0.19 | 0.35 | 0.04 | 0.02 | 0.03 |
| Personal income (RMB) | 5423.82 | 4239.57 | 0.14 | 1973.58 | 888.89 | 0.13 |
| Number of measurements | 3.99 | 2.63 | 1.14 | 3.99 | 3.99 | 0.00 |
| First survey year | 2011.46 | 2013.57 | ?1.11 | 2011.52 | 2011.52 | 0.00 |
| Last survey year | 2018.27 | 2017.20 | 0.52 | 2018.05 | 2018.05 | 0.00 |
Table S12 Balance Improvement of Variables Before and After Propensity Score Matching: Emerging Adulthood (Ages 18~21), Female
| Variable | Before matching | After matching | ||||
|---|---|---|---|---|---|---|
| Event Group | Control Group | Standardized Mean Difference | Event Group | Control Group | Standardized Mean Difference | |
| Distance | 0.22 | 0.06 | 0.88 | 0.13 | 0.13 | 0.00 |
| Number of females, N (%) | 179(100%) | 2445(100%) | 0.00 | 81(100%) | 81(100%) | 0.00 |
| Age (years) | 17.44 | 18.32 | ?0.53 | 16.75 | 16.75 | 0.00 |
| Years of education | 8.63 | 10.32 | ?0.59 | 9.25 | 9.22 | 0.01 |
| Health status | 1.76 | 2.03 | ?0.29 | 1.80 | 1.74 | 0.07 |
| Employment status | 0.35 | 0.19 | 0.35 | 0.04 | 0.02 | 0.03 |
| Personal income (RMB) | 5423.82 | 4239.57 | 0.14 | 1973.58 | 888.89 | 0.13 |
| Number of measurements | 3.99 | 2.63 | 1.14 | 3.99 | 3.99 | 0.00 |
| First survey year | 2011.46 | 2013.57 | ?1.11 | 2011.52 | 2011.52 | 0.00 |
| Last survey year | 2018.27 | 2017.20 | 0.52 | 2018.05 | 2018.05 | 0.00 |
| ControlGroup | Event Group | |
|---|---|---|
| Total sample | 2445 | 179 |
| Matched sample | 81 | 81 |
| Unmatched sample | 2364 | 98 |
| Discarded sample | 0 | 0 |
Table S13 Sample Sizes of Event and Control Groups After Propensity Score Matching: Emerging Adulthood (Ages 18~21), Female
| ControlGroup | Event Group | |
|---|---|---|
| Total sample | 2445 | 179 |
| Matched sample | 81 | 81 |
| Unmatched sample | 2364 | 98 |
| Discarded sample | 0 | 0 |
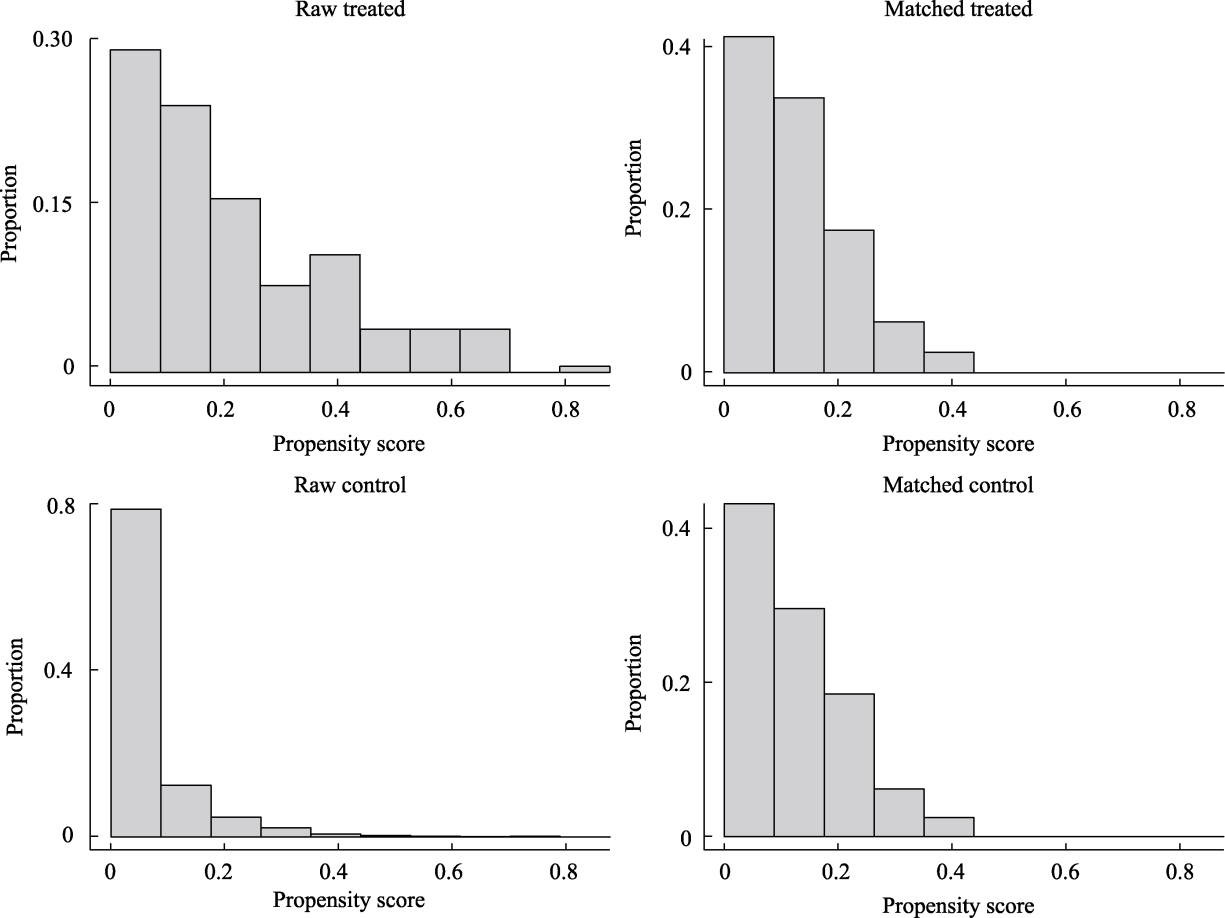
Figure S7 Propensity score distribution histograms of event and control groups before and after matching: Emerging adulthood (ages 18~21), Female
| Variable | Before matching | After matching | ||||
|---|---|---|---|---|---|---|
| Event Group | Control Group | Standardized Mean Difference | Event Group | Control Group | Standardized Mean Difference | |
| Distance | 0.34 | 0.09 | 1.21 | 0.31 | 0.31 | 0.01 |
| Number of females, N (%) | 421(51%) | 2445(42%) | ?0.18 | 185(46%) | 185(46%) | 0.00 |
| Age (years) | 19.80 | 19.97 | ?0.07 | 18.58 | 18.58 | 0.00 |
| Years of education | 10.74 | 9.88 | 0.29 | 10.59 | 10.65 | ?0.02 |
| Health status | 1.58 | 1.99 | ?0.49 | 1.55 | 1.65 | ?0.11 |
| Employment status | 0.38 | 0.24 | 0.29 | 0.20 | 0.20 | 0.01 |
| Personal income (RMB) | 8448.37 | 5884.50 | 0.09 | 4317.76 | 3000.16 | 0.05 |
| Number of measurements | 4.56 | 2.78 | 1.47 | 4.65 | 4.65 | 0.00 |
| First survey year | 2010.73 | 2013.29 | ?2.17 | 2010.66 | 2010.66 | 0.00 |
| Last survey year | 2018.76 | 2017.34 | 0.75 | 2018.78 | 2018.78 | 0.00 |
Table S14 Balance Improvement of Variables Before and After Propensity Score Matching: Emerging Adulthood (Ages 22~25)
| Variable | Before matching | After matching | ||||
|---|---|---|---|---|---|---|
| Event Group | Control Group | Standardized Mean Difference | Event Group | Control Group | Standardized Mean Difference | |
| Distance | 0.34 | 0.09 | 1.21 | 0.31 | 0.31 | 0.01 |
| Number of females, N (%) | 421(51%) | 2445(42%) | ?0.18 | 185(46%) | 185(46%) | 0.00 |
| Age (years) | 19.80 | 19.97 | ?0.07 | 18.58 | 18.58 | 0.00 |
| Years of education | 10.74 | 9.88 | 0.29 | 10.59 | 10.65 | ?0.02 |
| Health status | 1.58 | 1.99 | ?0.49 | 1.55 | 1.65 | ?0.11 |
| Employment status | 0.38 | 0.24 | 0.29 | 0.20 | 0.20 | 0.01 |
| Personal income (RMB) | 8448.37 | 5884.50 | 0.09 | 4317.76 | 3000.16 | 0.05 |
| Number of measurements | 4.56 | 2.78 | 1.47 | 4.65 | 4.65 | 0.00 |
| First survey year | 2010.73 | 2013.29 | ?2.17 | 2010.66 | 2010.66 | 0.00 |
| Last survey year | 2018.76 | 2017.34 | 0.75 | 2018.78 | 2018.78 | 0.00 |
| ControlGroup | Event Group | |
|---|---|---|
| Total sample | 5778 | 821 |
| Matched sample | 406 | 406 |
| Unmatched sample | 5372 | 415 |
| Discarded sample | 0 | 0 |
Table S15 Sample Sizes of Event and Control Groups After Propensity Score Matching: Emerging Adulthood (Ages 22~25)
| ControlGroup | Event Group | |
|---|---|---|
| Total sample | 5778 | 821 |
| Matched sample | 406 | 406 |
| Unmatched sample | 5372 | 415 |
| Discarded sample | 0 | 0 |
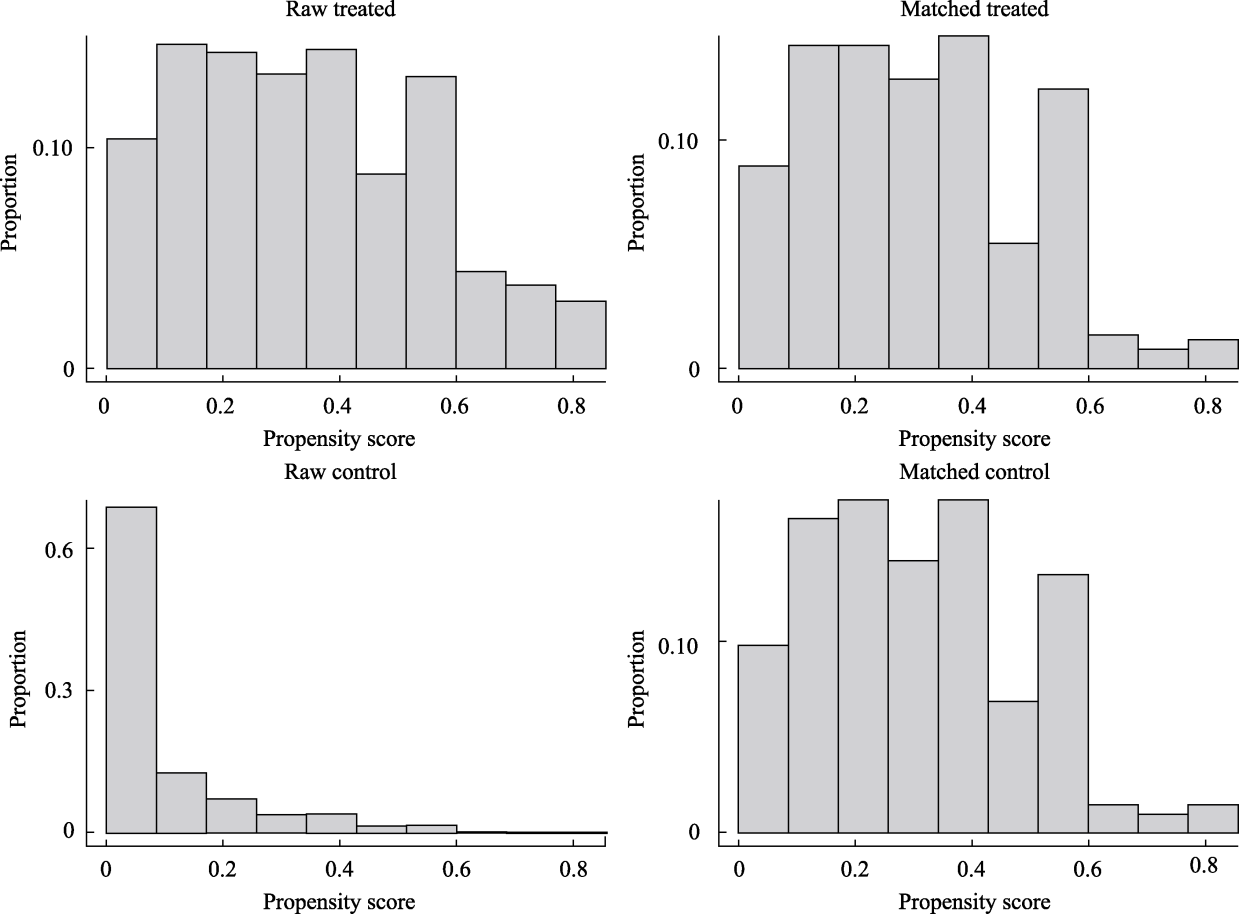
Figure S8 Propensity score distribution histograms of event and control groups before and after matching: Emerging adulthood (ages 22~25)
| Variable | Before matching | After matching | ||||
|---|---|---|---|---|---|---|
| Event Group | Control Group | Standardized Mean Difference | Event Group | Control Group | Standardized Mean Difference | |
| Distance | 0.29 | 0.09 | 1.13 | 0.27 | 0.27 | 0.01 |
| Number of males, N (%) | 400(100%) | 3333(100%) | 0.00 | 215(100%) | 215(100%) | 0.00 |
| Age (years) | 19.89 | 21.18 | ?0.49 | 18.87 | 18.87 | 0.00 |
| Years of education | 10.43 | 9.56 | 0.28 | 10.32 | 10.30 | 0.01 |
| Health status | 1.59 | 1.96 | ?0.44 | 1.60 | 1.63 | ?0.03 |
| Employment status | 0.42 | 0.27 | 0.30 | 0.27 | 0.27 | 0.00 |
| Personal income (RMB) | 11286.54 | 7091.17 | 0.11 | 5757.95 | 3713.65 | 0.05 |
| Number of measurements | 4.62 | 2.90 | 1.50 | 4.70 | 4.70 | 0.00 |
| First survey year | 2010.72 | 2013.08 | ?2.05 | 2010.63 | 2010.63 | 0.00 |
| Last survey year | 2018.86 | 2017.44 | 0.81 | 2018.93 | 2018.93 | 0.00 |
Table S16 Balance Improvement of Variables Before and After Propensity Score Matching: Emerging Adulthood (Ages 22~25), Male
| Variable | Before matching | After matching | ||||
|---|---|---|---|---|---|---|
| Event Group | Control Group | Standardized Mean Difference | Event Group | Control Group | Standardized Mean Difference | |
| Distance | 0.29 | 0.09 | 1.13 | 0.27 | 0.27 | 0.01 |
| Number of males, N (%) | 400(100%) | 3333(100%) | 0.00 | 215(100%) | 215(100%) | 0.00 |
| Age (years) | 19.89 | 21.18 | ?0.49 | 18.87 | 18.87 | 0.00 |
| Years of education | 10.43 | 9.56 | 0.28 | 10.32 | 10.30 | 0.01 |
| Health status | 1.59 | 1.96 | ?0.44 | 1.60 | 1.63 | ?0.03 |
| Employment status | 0.42 | 0.27 | 0.30 | 0.27 | 0.27 | 0.00 |
| Personal income (RMB) | 11286.54 | 7091.17 | 0.11 | 5757.95 | 3713.65 | 0.05 |
| Number of measurements | 4.62 | 2.90 | 1.50 | 4.70 | 4.70 | 0.00 |
| First survey year | 2010.72 | 2013.08 | ?2.05 | 2010.63 | 2010.63 | 0.00 |
| Last survey year | 2018.86 | 2017.44 | 0.81 | 2018.93 | 2018.93 | 0.00 |
| ControlGroup | Event Group | |
|---|---|---|
| Total sample | 3333 | 400 |
| Matched sample | 215 | 215 |
| Unmatched sample | 3118 | 185 |
| Discarded sample | 0 | 0 |
Table S17 Sample Sizes of Event and Control Groups After Propensity Score Matching: Emerging Adulthood (Ages 22~25), Male
| ControlGroup | Event Group | |
|---|---|---|
| Total sample | 3333 | 400 |
| Matched sample | 215 | 215 |
| Unmatched sample | 3118 | 185 |
| Discarded sample | 0 | 0 |
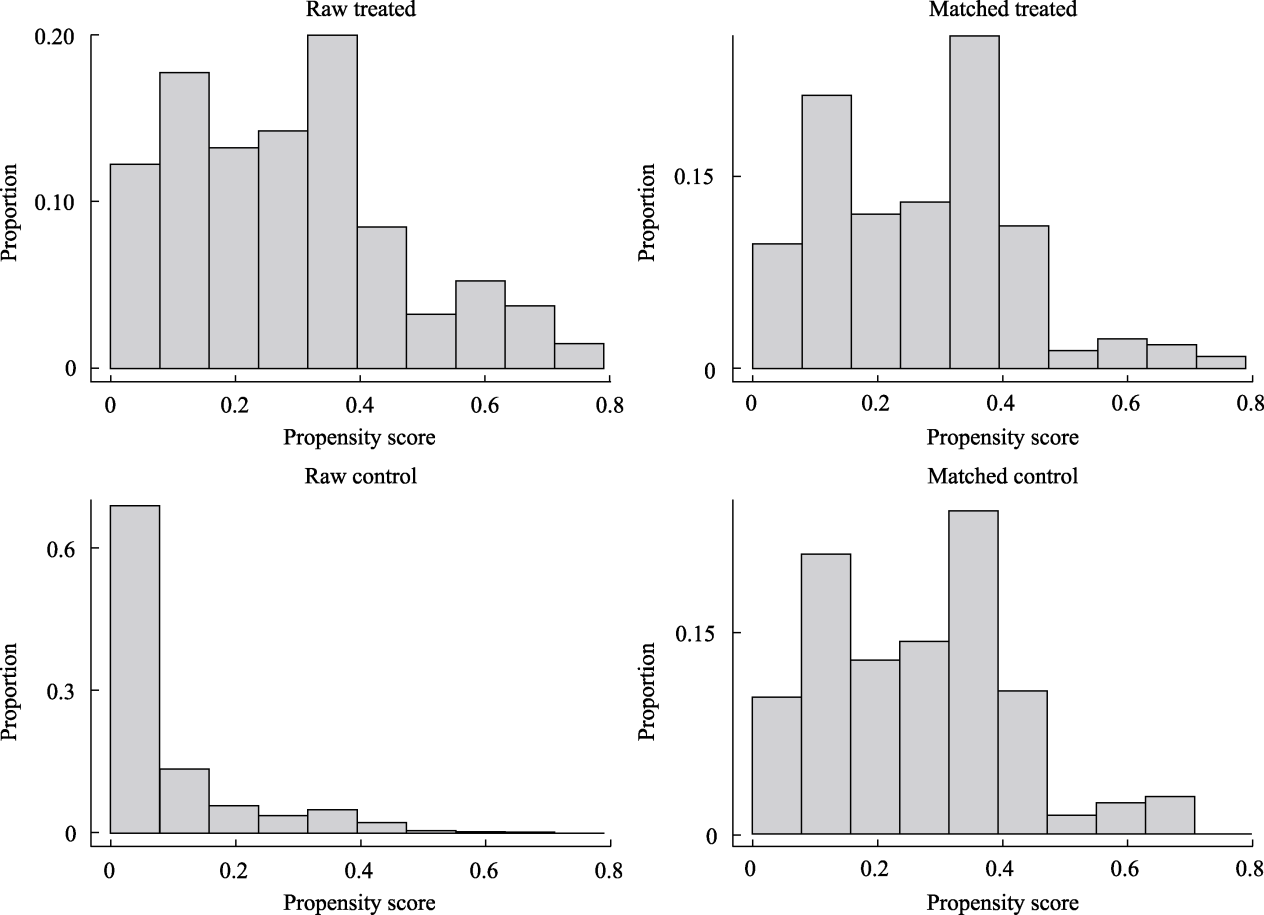
Figure S9 Propensity score distribution histograms of event and control groups before and after matching: Emerging adulthood (ages 22~25), Male
| Variable | Before matching | After matching | ||||
|---|---|---|---|---|---|---|
| Event Group | Control Group | Standardized Mean Difference | Event Group | Control Group | Standardized Mean Difference | |
| Distance | 0.41 | 0.10 | 1.38 | 0.36 | 0.35 | 0.01 |
| Number of females, N (%) | 421(100%) | 2445(100%) | 0.00 | 209(100%) | 209(100%) | 0.00 |
| Age (years) | 19.71 | 18.32 | 0.53 | 18.45 | 18.45 | 0.00 |
| Years of education | 11.04 | 10.32 | 0.26 | 10.99 | 11.08 | ?0.03 |
| Health status | 1.58 | 2.03 | ?0.57 | 1.50 | 1.64 | ?0.18 |
| Employment status | 0.34 | 0.19 | 0.32 | 0.15 | 0.14 | 0.01 |
| Personal income (RMB) | 5751.78 | 4239.57 | 0.14 | 2523.21 | 2161.63 | 0.03 |
| Number of measurements | 4.50 | 2.63 | 1.49 | 4.55 | 4.55 | 0.00 |
| First survey year | 2010.73 | 2013.57 | ?2.35 | 2010.66 | 2010.66 | 0.00 |
| Last survey year | 2018.67 | 2017.20 | 0.72 | 2018.53 | 2018.53 | 0.00 |
Table S18 Balance Improvement of Variables Before and After Propensity Score Matching: Emerging Adulthood (Ages 22~25), Female
| Variable | Before matching | After matching | ||||
|---|---|---|---|---|---|---|
| Event Group | Control Group | Standardized Mean Difference | Event Group | Control Group | Standardized Mean Difference | |
| Distance | 0.41 | 0.10 | 1.38 | 0.36 | 0.35 | 0.01 |
| Number of females, N (%) | 421(100%) | 2445(100%) | 0.00 | 209(100%) | 209(100%) | 0.00 |
| Age (years) | 19.71 | 18.32 | 0.53 | 18.45 | 18.45 | 0.00 |
| Years of education | 11.04 | 10.32 | 0.26 | 10.99 | 11.08 | ?0.03 |
| Health status | 1.58 | 2.03 | ?0.57 | 1.50 | 1.64 | ?0.18 |
| Employment status | 0.34 | 0.19 | 0.32 | 0.15 | 0.14 | 0.01 |
| Personal income (RMB) | 5751.78 | 4239.57 | 0.14 | 2523.21 | 2161.63 | 0.03 |
| Number of measurements | 4.50 | 2.63 | 1.49 | 4.55 | 4.55 | 0.00 |
| First survey year | 2010.73 | 2013.57 | ?2.35 | 2010.66 | 2010.66 | 0.00 |
| Last survey year | 2018.67 | 2017.20 | 0.72 | 2018.53 | 2018.53 | 0.00 |
| ControlGroup | Event Group | |
|---|---|---|
| Total sample | 2445 | 421 |
| Matched sample | 209 | 209 |
| Unmatched sample | 2236 | 212 |
| Discarded sample | 0 | 0 |
Table S19 Sample Sizes of Event and Control Groups After Propensity Score Matching: Emerging Adulthood (Ages 22~25), Female
| ControlGroup | Event Group | |
|---|---|---|
| Total sample | 2445 | 421 |
| Matched sample | 209 | 209 |
| Unmatched sample | 2236 | 212 |
| Discarded sample | 0 | 0 |
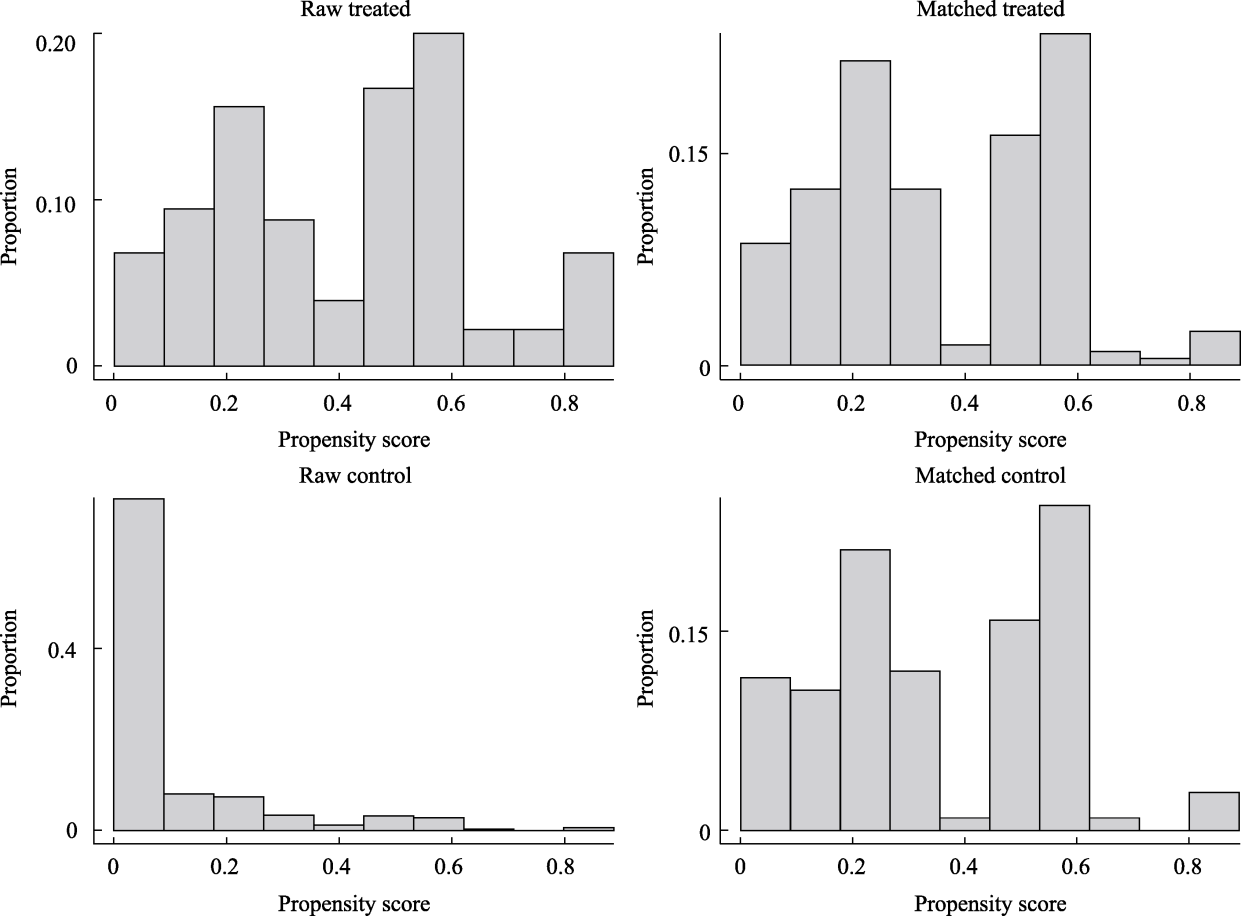
Figure S10 Propensity score distribution histograms of event and control groups before and after matching: Emerging adulthood (ages 22~25), Female
| Variable | Before matching | After matching | ||||
|---|---|---|---|---|---|---|
| Event Group | Control Group | Standardized Mean Difference | Event Group | Control Group | Standardized Mean Difference | |
| Distance | 0.36 | 0.06 | 1.23 | 0.30 | 0.30 | 0.01 |
| Number of females, N (%) | 212(41%) | 2445(42%) | 0.03 | 97(66%) | 97(66%) | 0.00 |
| Age (years) | 22.45 | 19.97 | 0.85 | 20.74 | 20.74 | 0.00 |
| Years of education | 12.33 | 9.88 | 0.78 | 11.82 | 11.53 | 0.09 |
| Health status | 1.59 | 1.99 | ?0.48 | 1.45 | 1.57 | ?0.15 |
| Employment status | 0.49 | 0.24 | 0.51 | 0.27 | 0.31 | ?0.08 |
| Personal income (RMB) | 11408.64 | 5884.50 | 0.29 | 6028.24 | 6350.41 | ?0.02 |
| Number of measurements | 4.76 | 2.78 | 1.75 | 4.98 | 4.98 | 0.00 |
| First survey year | 2010.72 | 2013.29 | ?2.08 | 2010.51 | 2010.51 | 0.00 |
| Last survey year | 2019.04 | 2017.34 | 1.02 | 2019.11 | 2019.11 | 0.00 |
Table S20 Balance Improvement of Variables Before and After Propensity Score Matching: Emerging Adulthood (Ages 26~29)
| Variable | Before matching | After matching | ||||
|---|---|---|---|---|---|---|
| Event Group | Control Group | Standardized Mean Difference | Event Group | Control Group | Standardized Mean Difference | |
| Distance | 0.36 | 0.06 | 1.23 | 0.30 | 0.30 | 0.01 |
| Number of females, N (%) | 212(41%) | 2445(42%) | 0.03 | 97(66%) | 97(66%) | 0.00 |
| Age (years) | 22.45 | 19.97 | 0.85 | 20.74 | 20.74 | 0.00 |
| Years of education | 12.33 | 9.88 | 0.78 | 11.82 | 11.53 | 0.09 |
| Health status | 1.59 | 1.99 | ?0.48 | 1.45 | 1.57 | ?0.15 |
| Employment status | 0.49 | 0.24 | 0.51 | 0.27 | 0.31 | ?0.08 |
| Personal income (RMB) | 11408.64 | 5884.50 | 0.29 | 6028.24 | 6350.41 | ?0.02 |
| Number of measurements | 4.76 | 2.78 | 1.75 | 4.98 | 4.98 | 0.00 |
| First survey year | 2010.72 | 2013.29 | ?2.08 | 2010.51 | 2010.51 | 0.00 |
| Last survey year | 2019.04 | 2017.34 | 1.02 | 2019.11 | 2019.11 | 0.00 |
| ControlGroup | Event Group | |
|---|---|---|
| Total sample | 5778 | 516 |
| Matched sample | 146 | 146 |
| Unmatched sample | 5632 | 370 |
| Discarded sample | 0 | 0 |
Table S21 Sample Sizes of Event and Control Groups After Propensity Score Matching: Emerging Adulthood (Ages 26~29)
| ControlGroup | Event Group | |
|---|---|---|
| Total sample | 5778 | 516 |
| Matched sample | 146 | 146 |
| Unmatched sample | 5632 | 370 |
| Discarded sample | 0 | 0 |
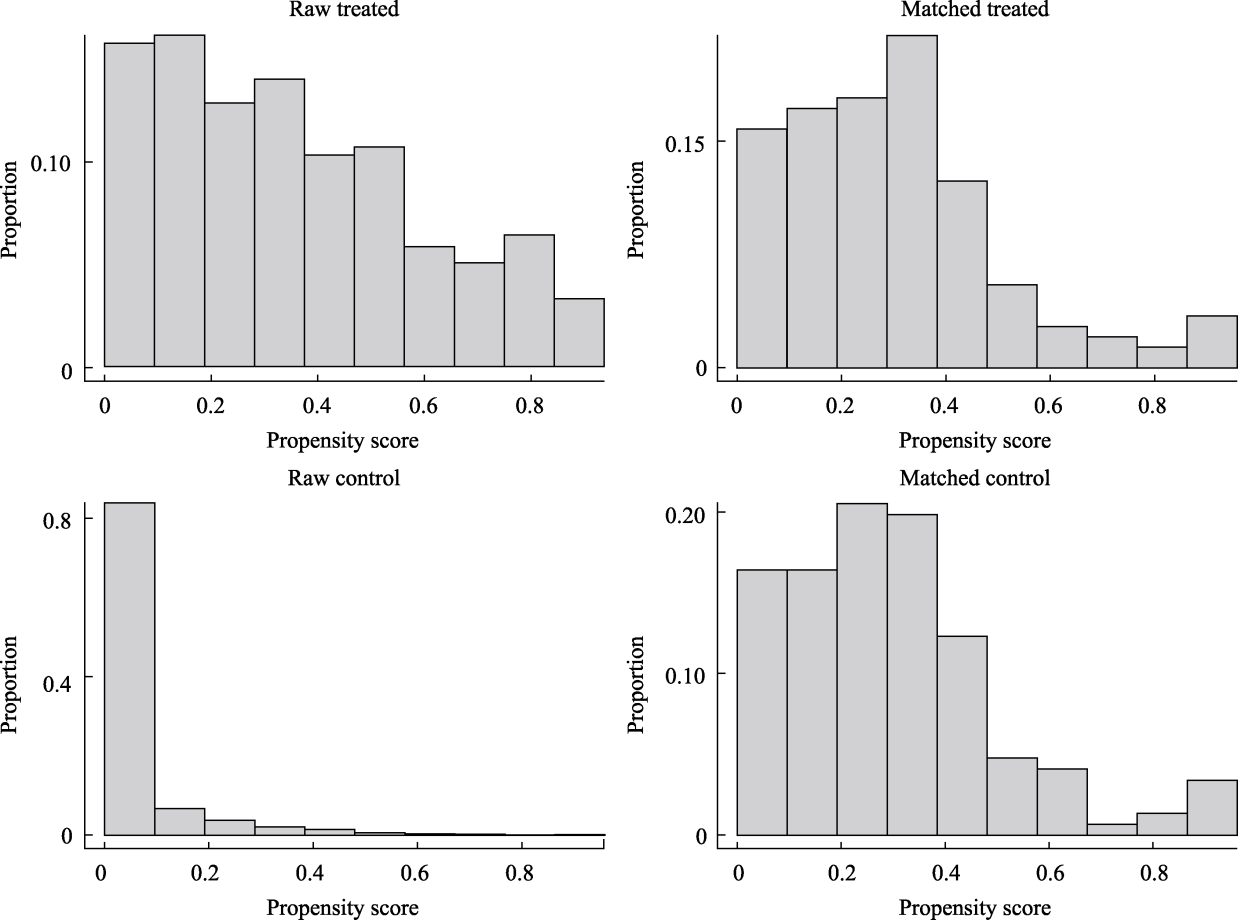
Figure S11 Propensity score distribution histograms of event and control groups before and after matching: Emerging adulthood (ages 26~29)
| Variable | Before matching | After matching | ||||
|---|---|---|---|---|---|---|
| Event Group | Control Group | Standardized Mean Difference | Event Group | Control Group | Standardized Mean Difference | |
| Distance | 0.33 | 0.06 | 1.10 | 0.26 | 0.26 | 0.00 |
| Number of males, N (%) | 304(100%) | 3333(100%) | 0.00 | 89(100%) | 89(100%) | 0.00 |
| Age (years) | 22.73 | 21.18 | 0.53 | 20.65 | 20.65 | 0.00 |
| Years of education | 11.98 | 9.56 | 0.73 | 11.31 | 10.94 | 0.11 |
| Health status | 1.57 | 1.96 | ?0.46 | 1.44 | 1.54 | ?0.12 |
| Employment status | 0.53 | 0.27 | 0.52 | 0.26 | 0.35 | ?0.18 |
| Personal income (RMB) | 13207.46 | 7091.17 | 0.28 | 6397.78 | 5430.33 | 0.04 |
| Number of measurements | 4.73 | 2.90 | 1.63 | 4.96 | 4.96 | 0.00 |
| First survey year | 2010.78 | 2013.08 | ?1.81 | 2010.47 | 2010.47 | 0.00 |
| Last survey year | 2019.02 | 2017.44 | 0.97 | 2019.11 | 2019.11 | 0.00 |
Table S22 Balance Improvement of Variables Before and After Propensity Score Matching: Emerging Adulthood (Ages 26~29), Male
| Variable | Before matching | After matching | ||||
|---|---|---|---|---|---|---|
| Event Group | Control Group | Standardized Mean Difference | Event Group | Control Group | Standardized Mean Difference | |
| Distance | 0.33 | 0.06 | 1.10 | 0.26 | 0.26 | 0.00 |
| Number of males, N (%) | 304(100%) | 3333(100%) | 0.00 | 89(100%) | 89(100%) | 0.00 |
| Age (years) | 22.73 | 21.18 | 0.53 | 20.65 | 20.65 | 0.00 |
| Years of education | 11.98 | 9.56 | 0.73 | 11.31 | 10.94 | 0.11 |
| Health status | 1.57 | 1.96 | ?0.46 | 1.44 | 1.54 | ?0.12 |
| Employment status | 0.53 | 0.27 | 0.52 | 0.26 | 0.35 | ?0.18 |
| Personal income (RMB) | 13207.46 | 7091.17 | 0.28 | 6397.78 | 5430.33 | 0.04 |
| Number of measurements | 4.73 | 2.90 | 1.63 | 4.96 | 4.96 | 0.00 |
| First survey year | 2010.78 | 2013.08 | ?1.81 | 2010.47 | 2010.47 | 0.00 |
| Last survey year | 2019.02 | 2017.44 | 0.97 | 2019.11 | 2019.11 | 0.00 |
| ControlGroup | Event Group | |
|---|---|---|
| Total sample | 3333 | 304 |
| Matched sample | 89 | 89 |
| Unmatched sample | 3244 | 215 |
| Discarded sample | 0 | 0 |
Table S23 Sample Sizes of Event and Control Groups After Propensity Score Matching: Emerging Adulthood (Ages 26~29), Male
| ControlGroup | Event Group | |
|---|---|---|
| Total sample | 3333 | 304 |
| Matched sample | 89 | 89 |
| Unmatched sample | 3244 | 215 |
| Discarded sample | 0 | 0 |
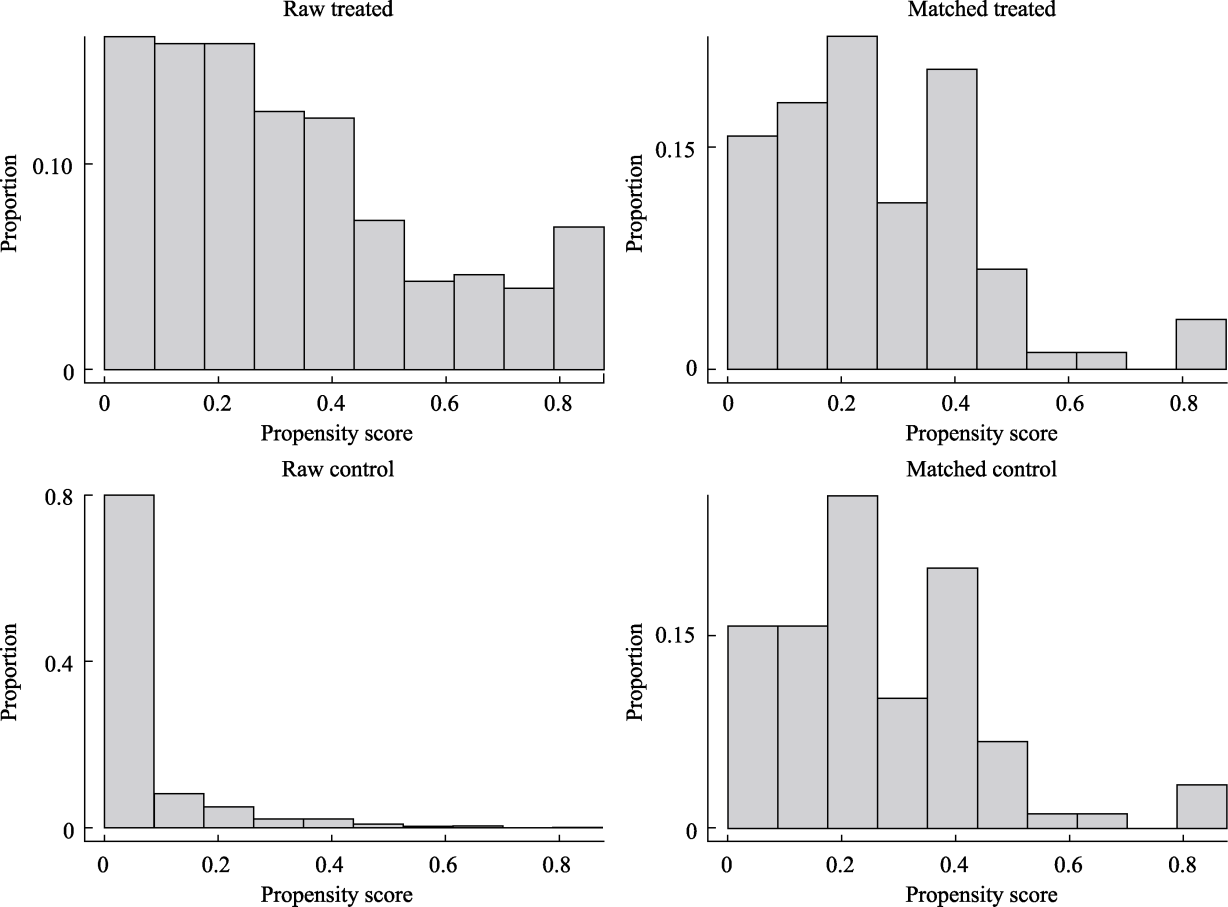
Figure S12 Propensity score distribution histograms of event and control groups before and after matching: Emerging adulthood (ages 26~29), Male
| Variable | Before matching | After matching | ||||
|---|---|---|---|---|---|---|
| Event Group | Control Group | Standardized Mean Difference | Event Group | Control Group | Standardized Mean Difference | |
| Distance | 0.42 | 0.05 | 1.48 | 0.35 | 0.35 | 0.01 |
| Number of females, N (%) | 212(100%) | 2445(100%) | 0.00 | 56(100%) | 56(100%) | 0.00 |
| Age (years) | 22.05 | 18.32 | 1.29 | 20.30 | 20.30 | 0.00 |
| Years of education | 12.84 | 10.32 | 0.88 | 12.20 | 12.46 | ?0.09 |
| Health status | 1.60 | 2.03 | ?0.50 | 1.39 | 1.50 | ?0.12 |
| Employment status | 0.43 | 0.19 | 0.49 | 0.25 | 0.18 | 0.14 |
| Personal income (RMB) | 8829.19 | 4239.57 | 0.33 | 4923.65 | 4499.64 | 0.03 |
| Number of measurements | 4.79 | 2.63 | 1.92 | 5.07 | 5.07 | 0.00 |
| First survey year | 2010.64 | 2013.57 | ?2.50 | 2010.39 | 2010.39 | 0.00 |
| Last survey year | 2019.07 | 2017.20 | 1.09 | 2019.11 | 2019.11 | 0.00 |
Table S24 Balance Improvement of Variables Before and After Propensity Score Matching: Emerging Adulthood (Ages 26~29), Female
| Variable | Before matching | After matching | ||||
|---|---|---|---|---|---|---|
| Event Group | Control Group | Standardized Mean Difference | Event Group | Control Group | Standardized Mean Difference | |
| Distance | 0.42 | 0.05 | 1.48 | 0.35 | 0.35 | 0.01 |
| Number of females, N (%) | 212(100%) | 2445(100%) | 0.00 | 56(100%) | 56(100%) | 0.00 |
| Age (years) | 22.05 | 18.32 | 1.29 | 20.30 | 20.30 | 0.00 |
| Years of education | 12.84 | 10.32 | 0.88 | 12.20 | 12.46 | ?0.09 |
| Health status | 1.60 | 2.03 | ?0.50 | 1.39 | 1.50 | ?0.12 |
| Employment status | 0.43 | 0.19 | 0.49 | 0.25 | 0.18 | 0.14 |
| Personal income (RMB) | 8829.19 | 4239.57 | 0.33 | 4923.65 | 4499.64 | 0.03 |
| Number of measurements | 4.79 | 2.63 | 1.92 | 5.07 | 5.07 | 0.00 |
| First survey year | 2010.64 | 2013.57 | ?2.50 | 2010.39 | 2010.39 | 0.00 |
| Last survey year | 2019.07 | 2017.20 | 1.09 | 2019.11 | 2019.11 | 0.00 |
| ControlGroup | Event Group | |
|---|---|---|
| Total sample | 2445 | 212 |
| Matched sample | 56 | 56 |
| Unmatched sample | 2389 | 156 |
| Discarded sample | 0 | 0 |
Table S25 Sample Sizes of Event and Control Groups After Propensity Score Matching: Emerging Adulthood (Ages 26~29), Female
| ControlGroup | Event Group | |
|---|---|---|
| Total sample | 2445 | 212 |
| Matched sample | 56 | 56 |
| Unmatched sample | 2389 | 156 |
| Discarded sample | 0 | 0 |
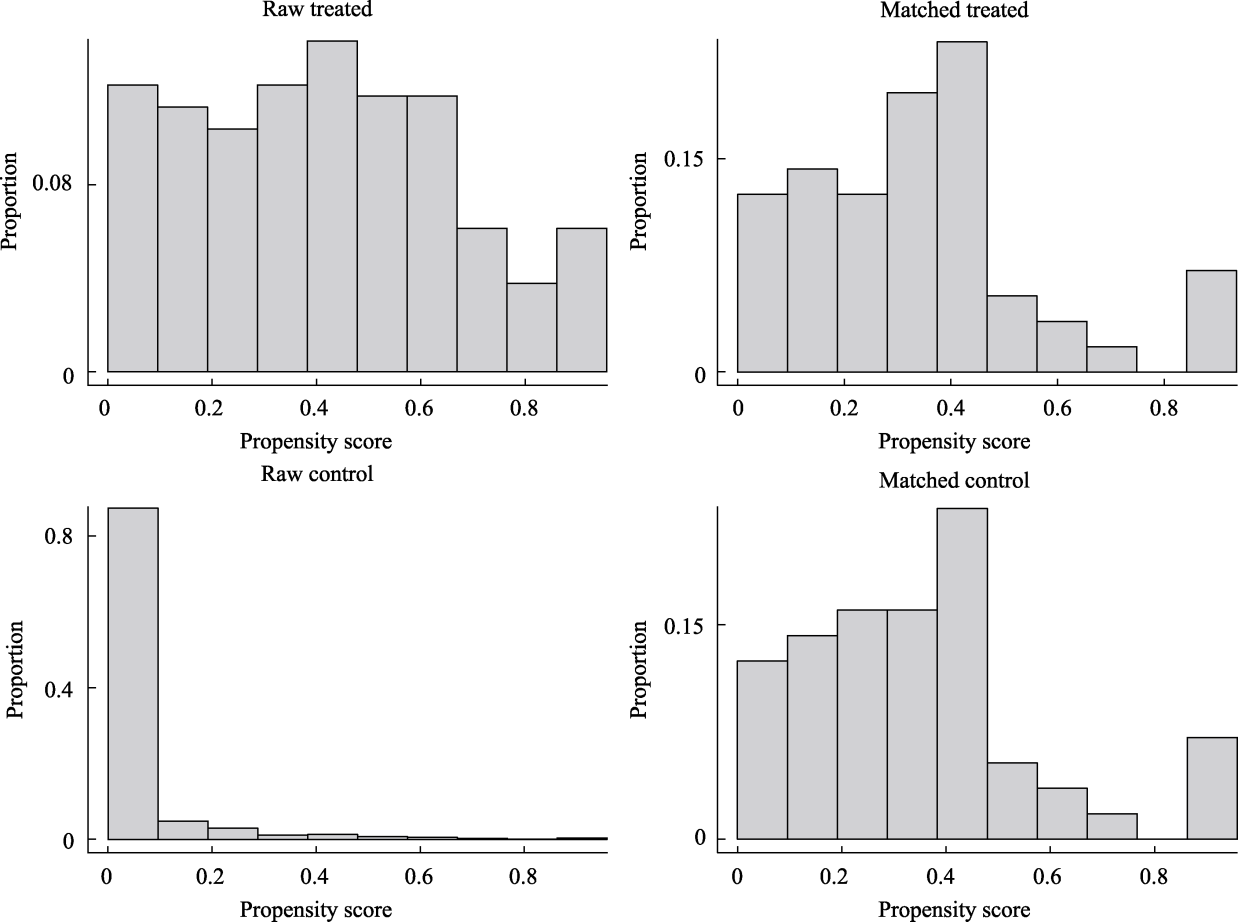
Figure S13 Propensity score distribution histograms of event and control groups before and after matching: Emerging adulthood (ages 26~29), Female
| Variable | Model A | Model B | Model B | ||||||
|---|---|---|---|---|---|---|---|---|---|
| Overall | Male | Female | Overall | Male | Female | Overall | Male | Female | |
| Intercept (b0) | 3.450* | 3.265* | 3.585* | 3.513* | 3.271* | 3.561* | 3.089* | 2.801* | 3.330* |
| Test effect(b1) | 0.039* | 0.069* | 0.010 | 0.032* | 0.065* | 0.014 | 0.122* | 0.152* | 0.075* |
| Gender(b2) | ?0.120* | ?0.157* | ?0.101* | ||||||
| Group(b3) | 0.104* | 0.147* | 0.062 | 0.103* | 0.144* | 0.059 | 0.263* | 0.352* | 0.130* |
| Age at event(b4) | ?0.017* | ?0.034* | ?0.001 | ?0.024* | ?0.036* | ?0.015 | ?0.036* | ?0.051* | ?0.016 |
| Age at event2(b5) | 0.002 | 0.002 | 0.003 | 0.004+ | 0.003 | 0.006+ | 0.003+ | 0.003 | 0.004 |
| Baseline Change(b6) | ?0.109*# | ?0.157* | ?0.072 | ||||||
| Event Year(b7) | ?0.063# | ?0.196* | 0.015 | ||||||
| Linear anticipation(b8) | ?0.072*# | ?0.095* | ?0.040* | ||||||
| Quadratic anticipation(b9) | ?0.001 | ?0.002 | |||||||
| Linear reaction(b10) | ?0.043 | ?0.003 | ?0.044* | ||||||
| Quadratic reaction(b11) | 0.002 | ?0.004 | |||||||
| Baseline change×Group(b12) | 0.249* | 0.280* | 0.213* | ||||||
| Event year×Group(b13) | 0.225* | 0.301* | 0.157 | ||||||
| Linear anticipation×Group(b14) | 0.092* | 0.095* | 0.014 | ||||||
| Quadratic anticipation×Group(b15) | 0.010* | 0.008 | |||||||
| Linear reaction×Group(b16) | 0.059 | 0.050 | 0.051* | ||||||
| Quadratic reaction×Group(b17) | ?0.007 | ?0.007 | |||||||
Table S26 Changes in Life Satisfaction Before and After Marriage Among Emerging Adults (Ages 18~29)
| Variable | Model A | Model B | Model B | ||||||
|---|---|---|---|---|---|---|---|---|---|
| Overall | Male | Female | Overall | Male | Female | Overall | Male | Female | |
| Intercept (b0) | 3.450* | 3.265* | 3.585* | 3.513* | 3.271* | 3.561* | 3.089* | 2.801* | 3.330* |
| Test effect(b1) | 0.039* | 0.069* | 0.010 | 0.032* | 0.065* | 0.014 | 0.122* | 0.152* | 0.075* |
| Gender(b2) | ?0.120* | ?0.157* | ?0.101* | ||||||
| Group(b3) | 0.104* | 0.147* | 0.062 | 0.103* | 0.144* | 0.059 | 0.263* | 0.352* | 0.130* |
| Age at event(b4) | ?0.017* | ?0.034* | ?0.001 | ?0.024* | ?0.036* | ?0.015 | ?0.036* | ?0.051* | ?0.016 |
| Age at event2(b5) | 0.002 | 0.002 | 0.003 | 0.004+ | 0.003 | 0.006+ | 0.003+ | 0.003 | 0.004 |
| Baseline Change(b6) | ?0.109*# | ?0.157* | ?0.072 | ||||||
| Event Year(b7) | ?0.063# | ?0.196* | 0.015 | ||||||
| Linear anticipation(b8) | ?0.072*# | ?0.095* | ?0.040* | ||||||
| Quadratic anticipation(b9) | ?0.001 | ?0.002 | |||||||
| Linear reaction(b10) | ?0.043 | ?0.003 | ?0.044* | ||||||
| Quadratic reaction(b11) | 0.002 | ?0.004 | |||||||
| Baseline change×Group(b12) | 0.249* | 0.280* | 0.213* | ||||||
| Event year×Group(b13) | 0.225* | 0.301* | 0.157 | ||||||
| Linear anticipation×Group(b14) | 0.092* | 0.095* | 0.014 | ||||||
| Quadratic anticipation×Group(b15) | 0.010* | 0.008 | |||||||
| Linear reaction×Group(b16) | 0.059 | 0.050 | 0.051* | ||||||
| Quadratic reaction×Group(b17) | ?0.007 | ?0.007 | |||||||
| Variable | Model A | Model B | Model B | ||||||
|---|---|---|---|---|---|---|---|---|---|
| Overall | Male | Female | Overall | Male | Female | Overall | Male | Female | |
| Intercept (b0) | 3.466* | 3.242* | 3.523* | 3.545* | 3.247* | 3.496* | 2.889* | 2.812* | 3.084* |
| Test effect(b1) | 0.099* | 0.160* | 0.057 | 0.075 | 0.187+ | 0.034 | 0.264* | 0.238* | 0.174* |
| Gender(b2) | 0.080 | ?0.141 | ?0.042 | ||||||
| Group(b3) | 0.233* | 0.258 | 0.229+ | 0.221* | 0.258 | 0.253* | 0.387* | 0.359+ | 0.397* |
| Age at event(b4) | 0.002 | ?0.043 | 0.089+ | ?0.029 | ?0.047 | 0.100 | ?0.056 | ?0.068 | 0.030 |
| Age at event2(b5) | ?0.001 | ?0.005 | 0.049 | 0.001 | ?0.007 | 0.090 | 0.002 | ?0.004 | 0.046 |
| Baseline Change(b6) | ?0.264* | ?0.307+ | ?0.205# | ||||||
| Event Year(b7) | ?0.162 | ?0.470* | ?0.208# | ||||||
| Linear anticipation(b8) | ?0.166+ | ?0.118+ | ?0.096 | ||||||
| Quadratic anticipation(b9) | ?0.006 | 0.006 | |||||||
| Linear reaction(b10) | ?0.140* | ?0.041 | ?0.125 | ||||||
| Quadratic reaction(b11) | 0.007 | 0.0133 | |||||||
| Baseline change×Group(b12) | ?0.020 | 0.018 | ?0.058 | ||||||
| Event year×Group(b13) | 0.059 | 0.150 | 0.180 | ||||||
| Linear anticipation×Group(b14) | 0.121 | 0.029 | 0.093 | ||||||
| Quadratic anticipation×Group(b15) | 0.015 | 0.006 | |||||||
| Linear reaction×Group(b16) | ?0.162+ | ?0.037 | ?0.152 | ||||||
| Quadratic reaction×Group(b17) | 0.023* | 0.014 | |||||||
Table S27 Changes in Life Satisfaction Before and After Marriage Among Emerging Adults (Ages 18~21)
| Variable | Model A | Model B | Model B | ||||||
|---|---|---|---|---|---|---|---|---|---|
| Overall | Male | Female | Overall | Male | Female | Overall | Male | Female | |
| Intercept (b0) | 3.466* | 3.242* | 3.523* | 3.545* | 3.247* | 3.496* | 2.889* | 2.812* | 3.084* |
| Test effect(b1) | 0.099* | 0.160* | 0.057 | 0.075 | 0.187+ | 0.034 | 0.264* | 0.238* | 0.174* |
| Gender(b2) | 0.080 | ?0.141 | ?0.042 | ||||||
| Group(b3) | 0.233* | 0.258 | 0.229+ | 0.221* | 0.258 | 0.253* | 0.387* | 0.359+ | 0.397* |
| Age at event(b4) | 0.002 | ?0.043 | 0.089+ | ?0.029 | ?0.047 | 0.100 | ?0.056 | ?0.068 | 0.030 |
| Age at event2(b5) | ?0.001 | ?0.005 | 0.049 | 0.001 | ?0.007 | 0.090 | 0.002 | ?0.004 | 0.046 |
| Baseline Change(b6) | ?0.264* | ?0.307+ | ?0.205# | ||||||
| Event Year(b7) | ?0.162 | ?0.470* | ?0.208# | ||||||
| Linear anticipation(b8) | ?0.166+ | ?0.118+ | ?0.096 | ||||||
| Quadratic anticipation(b9) | ?0.006 | 0.006 | |||||||
| Linear reaction(b10) | ?0.140* | ?0.041 | ?0.125 | ||||||
| Quadratic reaction(b11) | 0.007 | 0.0133 | |||||||
| Baseline change×Group(b12) | ?0.020 | 0.018 | ?0.058 | ||||||
| Event year×Group(b13) | 0.059 | 0.150 | 0.180 | ||||||
| Linear anticipation×Group(b14) | 0.121 | 0.029 | 0.093 | ||||||
| Quadratic anticipation×Group(b15) | 0.015 | 0.006 | |||||||
| Linear reaction×Group(b16) | ?0.162+ | ?0.037 | ?0.152 | ||||||
| Quadratic reaction×Group(b17) | 0.023* | 0.014 | |||||||
| Variable | Model A | Model B | Model B | ||||||
|---|---|---|---|---|---|---|---|---|---|
| Overall | Male | Female | Overall | Male | Female | Overall | Male | Female | |
| Intercept (b0) | 3.490* | 3.314* | 3.602* | 3.519* | 3.316* | 3.624* | 3.031* | 2.764* | 3.330* |
| Test effect(b1) | 0.040* | 0.064* | 0.006 | 0.036* | 0.072* | 0.002 | 0.131* | 0.192* | 0.067* |
| Gender(b2) | ?0.119* | ?0.132* | ?0.084* | ||||||
| Group(b3) | 0.070 | 0.142+ | ?0.019 | 0.067 | 0.148+ | ?0.027 | 0.225* | 0.307* | 0.076 |
| Age at event(b4) | 0.000 | ?0.032 | 0.041+ | ?0.002 | ?0.044 | 0.057* | ?0.023 | ?0.059* | 0.021 |
| Age at event2(b5) | 0.006 | ?0.006 | 0.014 | ?0.001 | ?0.018 | 0.010 | 0.004 | ?0.005 | 0.013 |
| Baseline Change(b6) | ?0.108*# | ?0.118 | ?0.064 | ||||||
| Event Year(b7) | ?0.122+# | ?0.175+ | ?0.025 | ||||||
| Linear anticipation(b8) | ?0.074*# | ?0.066# | ?0.038 | ||||||
| Quadratic anticipation(b9) | ?0.000 | 0.005 | 0.001 | ||||||
| Linear reaction(b10) | ?0.017 | ?0.040 | ?0.047 | ||||||
| Quadratic reaction(b11) | ?0.001 | ?0.000 | 0.006 | ||||||
| Baseline change×Group(b12) | 0.317* | 0.260* | 0.331* | ||||||
| Event year×Group(b13) | 0.292* | 0.290* | 0.207 | ||||||
| Linear anticipation×Group(b14) | 0.071 | 0.052 | 0.045 | ||||||
| Quadratic anticipation×Group(b15) | 0.008 | 0.004 | 0.005 | ||||||
| Linear reaction×Group(b16) | 0.105* | 0.091 | 0.164* | ||||||
| Quadratic reaction×Group(b17) | ?0.014* | ?0.015+ | ?0.020* | ||||||
Table S28 Changes in Life Satisfaction Before and After Marriage Among Emerging Adults (Ages 22~25)
| Variable | Model A | Model B | Model B | ||||||
|---|---|---|---|---|---|---|---|---|---|
| Overall | Male | Female | Overall | Male | Female | Overall | Male | Female | |
| Intercept (b0) | 3.490* | 3.314* | 3.602* | 3.519* | 3.316* | 3.624* | 3.031* | 2.764* | 3.330* |
| Test effect(b1) | 0.040* | 0.064* | 0.006 | 0.036* | 0.072* | 0.002 | 0.131* | 0.192* | 0.067* |
| Gender(b2) | ?0.119* | ?0.132* | ?0.084* | ||||||
| Group(b3) | 0.070 | 0.142+ | ?0.019 | 0.067 | 0.148+ | ?0.027 | 0.225* | 0.307* | 0.076 |
| Age at event(b4) | 0.000 | ?0.032 | 0.041+ | ?0.002 | ?0.044 | 0.057* | ?0.023 | ?0.059* | 0.021 |
| Age at event2(b5) | 0.006 | ?0.006 | 0.014 | ?0.001 | ?0.018 | 0.010 | 0.004 | ?0.005 | 0.013 |
| Baseline Change(b6) | ?0.108*# | ?0.118 | ?0.064 | ||||||
| Event Year(b7) | ?0.122+# | ?0.175+ | ?0.025 | ||||||
| Linear anticipation(b8) | ?0.074*# | ?0.066# | ?0.038 | ||||||
| Quadratic anticipation(b9) | ?0.000 | 0.005 | 0.001 | ||||||
| Linear reaction(b10) | ?0.017 | ?0.040 | ?0.047 | ||||||
| Quadratic reaction(b11) | ?0.001 | ?0.000 | 0.006 | ||||||
| Baseline change×Group(b12) | 0.317* | 0.260* | 0.331* | ||||||
| Event year×Group(b13) | 0.292* | 0.290* | 0.207 | ||||||
| Linear anticipation×Group(b14) | 0.071 | 0.052 | 0.045 | ||||||
| Quadratic anticipation×Group(b15) | 0.008 | 0.004 | 0.005 | ||||||
| Linear reaction×Group(b16) | 0.105* | 0.091 | 0.164* | ||||||
| Quadratic reaction×Group(b17) | ?0.014* | ?0.015+ | ?0.020* | ||||||
| Variable | Model A | Model B | Model B | ||||||
|---|---|---|---|---|---|---|---|---|---|
| Overall | Male | Female | Overall | Male | Female | Overall | Male | Female | |
| Intercept (b0) | 3.439* | 3.228* | 3.499* | 3.469* | 3.251* | 3.406* | 3.034* | 2.933* | 3.198* |
| Test effect(b1) | 0.058* | 0.084* | 0.007 | 0.054* | 0.076* | 0.012 | 0.134* | 0.139* | 0.078+ |
| Gender(b2) | ?0.210* | ?0.250* | ?0.185* | ||||||
| Group(b3) | 0.087 | 0.071 | 0.137 | 0.087 | 0.072 | 0.158 | 0.340* | 0.118 | 0.400* |
| Age at event(b4) | 0.044 | 0.039 | 0.049 | 0.051 | 0.063 | 0.000 | 0.036 | 0.031 | ?0.002 |
| Age at event2(b5) | 0.013 | ?0.023 | 0.030 | ?0.014 | ?0.029+ | 0.081 | ?0.013 | ?0.025 | 0.044 |
| Baseline Change(b6) | ?0.048 | ?0.120 | ?0.030# | ||||||
| Event Year(b7) | ?0.037 | ?0.094 | 0.036# | ||||||
| Linear anticipation(b8) | ?0.080+ | ?0.038+ | ?0.007 | ||||||
| Quadratic anticipation(b9) | ?0.004 | 0.004 | |||||||
| Linear reaction(b10) | 0.002 | ?0.018 | ?0.063 | ||||||
| Quadratic reaction(b11) | ?0.003 | 0.005 | |||||||
| Baseline change×Group(b12) | 0.235* | 0.171 | 0.335* | ||||||
| Event year×Group(b13) | 0.321* | 0.242 | 0.438+ | ||||||
| Linear anticipation×Group(b14) | 0.179* | ?0.000 | 0.165+ | ||||||
| Quadratic anticipation×Group(b15) | 0.020* | 0.018+ | |||||||
| Linear reaction×Group(b16) | ?0.044 | 0.015 | 0.022 | ||||||
| Quadratic reaction×Group(b17) | 0.006 | 0.002 | |||||||
Table S29 Changes in Life Satisfaction Before and After Marriage Among Emerging Adults (Ages 26~29)
| Variable | Model A | Model B | Model B | ||||||
|---|---|---|---|---|---|---|---|---|---|
| Overall | Male | Female | Overall | Male | Female | Overall | Male | Female | |
| Intercept (b0) | 3.439* | 3.228* | 3.499* | 3.469* | 3.251* | 3.406* | 3.034* | 2.933* | 3.198* |
| Test effect(b1) | 0.058* | 0.084* | 0.007 | 0.054* | 0.076* | 0.012 | 0.134* | 0.139* | 0.078+ |
| Gender(b2) | ?0.210* | ?0.250* | ?0.185* | ||||||
| Group(b3) | 0.087 | 0.071 | 0.137 | 0.087 | 0.072 | 0.158 | 0.340* | 0.118 | 0.400* |
| Age at event(b4) | 0.044 | 0.039 | 0.049 | 0.051 | 0.063 | 0.000 | 0.036 | 0.031 | ?0.002 |
| Age at event2(b5) | 0.013 | ?0.023 | 0.030 | ?0.014 | ?0.029+ | 0.081 | ?0.013 | ?0.025 | 0.044 |
| Baseline Change(b6) | ?0.048 | ?0.120 | ?0.030# | ||||||
| Event Year(b7) | ?0.037 | ?0.094 | 0.036# | ||||||
| Linear anticipation(b8) | ?0.080+ | ?0.038+ | ?0.007 | ||||||
| Quadratic anticipation(b9) | ?0.004 | 0.004 | |||||||
| Linear reaction(b10) | 0.002 | ?0.018 | ?0.063 | ||||||
| Quadratic reaction(b11) | ?0.003 | 0.005 | |||||||
| Baseline change×Group(b12) | 0.235* | 0.171 | 0.335* | ||||||
| Event year×Group(b13) | 0.321* | 0.242 | 0.438+ | ||||||
| Linear anticipation×Group(b14) | 0.179* | ?0.000 | 0.165+ | ||||||
| Quadratic anticipation×Group(b15) | 0.020* | 0.018+ | |||||||
| Linear reaction×Group(b16) | ?0.044 | 0.015 | 0.022 | ||||||
| Quadratic reaction×Group(b17) | 0.006 | 0.002 | |||||||
| Interaction term with group | Overall | Male | Female | ||||||||||
|---|---|---|---|---|---|---|---|---|---|---|---|---|---|
| β | p | Cohen’s d | 95% CI | β | p | Cohen’s d | 95% CI | β | p | Cohen’s d | 95% CI | ||
| 18~29 years | Baseline change | 0.249 | <0.001 | 0.067 | [0.042, 0.091] | 0.280 | <0.001 | 0.073 | [0.040, 0.106] | 0.213 | <0.001 | 0.059 | [0.025, 0.093] |
| Event year | 0.225 | 0.002 | 0.047 | [0.018, 0.076] | 0.301 | 0.003 | 0.062 | [0.021, 0.102] | 0.157 | 0.110 | 0.033 | [?0.008, 0.074] | |
| Linear anticipation | 0.092 | 0.005 | 0.130 | [0.038, 0.218] | 0.095 | 0.042 | 0.130 | [0.005, 0.255] | 0.014 | 0.333 | 0.019 | [?0.020, 0.058] | |
| Quadratic anticipation | 0.010 | 0.014 | 0.100 | [0.021, 0.186] | 0.008 | 0.143 | 0.085 | [?0.028, 0.198] | . | . | . | . | |
| Linear reaction | 0.059 | 0.132 | 0.060 | [?0.019, 0.141] | 0.050 | 0.363 | 0.053 | [?0.062, 0.168] | 0.051 | 0.012 | 0.051 | [0.011, 0.092] | |
| Quadratic reaction | ?0.007 | 0.177 | ?0.050 | [?0.121, 0.022] | ?0.007 | 0.340 | ?0.050 | [?0.153, 0.053] | . | . | . | . | |
| 18~21 years | Baseline change | ?0.020 | 0.856 | ?0.005 | [?0.061, 0.051] | 0.018 | 0.924 | 0.004 | [?0.087, 0.096] | ?0.058 | 0.722 | ?0.015 | [?0.099, 0.069] |
| Event year | 0.059 | 0.728 | 0.013 | [?0.061, 0.087] | 0.150 | 0.567 | 0.037 | [?0.090, 0.165] | 0.180 | 0.498 | 0.038 | [?0.071, 0.147] | |
| Linear anticipation | 0.121 | 0.375 | 0.101 | [?0.122, 0.324] | 0.029 | 0.680 | 0.022 | [?0.083, 0.128] | 0.093 | 0.599 | 0.080 | [?0.219, 0.379] | |
| Quadratic anticipation | 0.015 | 0.582 | 0.056 | [?0.143, 0.254] | . | . | . | . | 0.006 | 0.870 | 0.022 | [?0.244, 0.289] | |
| Linear reaction | ?0.162+ | 0.062 | ?0.195 | [?0.400, 0.010] | ?0.037 | 0.396 | ?0.047 | [?0.154, 0.061] | ?0.152 | 0.201 | ?0.166 | [?0.421, 0.089] | |
| Quadratic reaction | 0.023 | 0.040 | 0.191 | [0.009, 0.374] | . | . | . | . | 0.014 | 0.367 | 0.103 | [?0.121, 0.328] | |
| 22~25 years | Baseline change | 0.317 | <0.001 | 0.084 | [0.054, 0.114] | 0.260 | 0.001 | 0.066 | [0.026, 0.107] | 0.331 | <0.001 | 0.093 | [0.050, 0.135] |
| Event year | 0.292 | 0.002 | 0.059 | [0.022, 0.095] | 0.290 | 0.032 | 0.056 | [0.005, 0.107] | 0.207 | 0.100 | 0.043 | [?0.008, 0.094] | |
| Linear anticipation | 0.071 | 0.111 | 0.097 | [?0.022, 0.216] | 0.052 | 0.429 | 0.065 | [?0.097, 0.228] | 0.045 | 0.427 | 0.067 | [?0.098, 0.233] | |
| Quadratic anticipation | 0.008 | 0.185 | 0.073 | [?0.035, 0.182] | 0.004 | 0.672 | 0.032 | [?0.116, 0.180] | 0.005 | 0.503 | 0.051 | [?0.099, 0.201] | |
| Linear reaction | 0.105 | 0.033 | 0.110 | [0.009, 0.211] | 0.091 | 0.166 | 0.098 | [?0.041, 0.237] | 0.164 | 0.016 | 0.172 | [0.032, 0.312] | |
| Quadratic reaction | ?0.014 | 0.039 | ?0.095 | [?0.185, ?0.005] | ?0.015 | 0.072 | ?0.113 | [?0.235, 0.010] | ?0.020 | 0.032 | ?0.137 | [?0.262, ?0.012] | |
| 26~29 years | Baseline change | 0.235 | 0.012 | 0.060 | [0.013, 0.108] | 0.171 | 0.156 | 0.045 | [?0.017, 0.106] | 0.335 | 0.033 | 0.085 | [0.008, 0.163] |
| Event year | 0.321 | 0.020 | 0.063 | [0.010, 0.117] | 0.242 | 0.171 | 0.049 | [?0.021, 0.120] | 0.438 | 0.058 | 0.080 | [?0.003, 0.162] | |
| Linear anticipation | 0.179 | 0.002 | 0.290 | [0.105, 0.475] | ?0.000 | ?0.001 | [?0.069, 0.068] | 0.165 | 0.064 | 0.278 | [?0.016, 0.571] | ||
| Quadratic anticipation | 0.020 | 0.002 | 0.272 | [0.102, 0.442] | . | . | . | . | 0.018 | 0.073 | 0.248 | [?0.023, 0.519] | |
| Linear reaction | ?0.044 | 0.619 | ?0.039 | [?0.193, 0.115] | 0.015 | 0.012 | [?0.060, 0.084] | 0.022 | 0.870 | 0.020 | [?0.220, 0.260] | ||
| Quadratic reaction | 0.006 | 0.629 | 0.034 | [?0.104, 0.173] | . | . | . | . | 0.002 | 0.912 | 0.012 | [?0.204, 0.228] | |
Table 30 Key Variable Estimates in Linear Mixed Models (β, p, Cohen’s d, 95% CI)
| Interaction term with group | Overall | Male | Female | ||||||||||
|---|---|---|---|---|---|---|---|---|---|---|---|---|---|
| β | p | Cohen’s d | 95% CI | β | p | Cohen’s d | 95% CI | β | p | Cohen’s d | 95% CI | ||
| 18~29 years | Baseline change | 0.249 | <0.001 | 0.067 | [0.042, 0.091] | 0.280 | <0.001 | 0.073 | [0.040, 0.106] | 0.213 | <0.001 | 0.059 | [0.025, 0.093] |
| Event year | 0.225 | 0.002 | 0.047 | [0.018, 0.076] | 0.301 | 0.003 | 0.062 | [0.021, 0.102] | 0.157 | 0.110 | 0.033 | [?0.008, 0.074] | |
| Linear anticipation | 0.092 | 0.005 | 0.130 | [0.038, 0.218] | 0.095 | 0.042 | 0.130 | [0.005, 0.255] | 0.014 | 0.333 | 0.019 | [?0.020, 0.058] | |
| Quadratic anticipation | 0.010 | 0.014 | 0.100 | [0.021, 0.186] | 0.008 | 0.143 | 0.085 | [?0.028, 0.198] | . | . | . | . | |
| Linear reaction | 0.059 | 0.132 | 0.060 | [?0.019, 0.141] | 0.050 | 0.363 | 0.053 | [?0.062, 0.168] | 0.051 | 0.012 | 0.051 | [0.011, 0.092] | |
| Quadratic reaction | ?0.007 | 0.177 | ?0.050 | [?0.121, 0.022] | ?0.007 | 0.340 | ?0.050 | [?0.153, 0.053] | . | . | . | . | |
| 18~21 years | Baseline change | ?0.020 | 0.856 | ?0.005 | [?0.061, 0.051] | 0.018 | 0.924 | 0.004 | [?0.087, 0.096] | ?0.058 | 0.722 | ?0.015 | [?0.099, 0.069] |
| Event year | 0.059 | 0.728 | 0.013 | [?0.061, 0.087] | 0.150 | 0.567 | 0.037 | [?0.090, 0.165] | 0.180 | 0.498 | 0.038 | [?0.071, 0.147] | |
| Linear anticipation | 0.121 | 0.375 | 0.101 | [?0.122, 0.324] | 0.029 | 0.680 | 0.022 | [?0.083, 0.128] | 0.093 | 0.599 | 0.080 | [?0.219, 0.379] | |
| Quadratic anticipation | 0.015 | 0.582 | 0.056 | [?0.143, 0.254] | . | . | . | . | 0.006 | 0.870 | 0.022 | [?0.244, 0.289] | |
| Linear reaction | ?0.162+ | 0.062 | ?0.195 | [?0.400, 0.010] | ?0.037 | 0.396 | ?0.047 | [?0.154, 0.061] | ?0.152 | 0.201 | ?0.166 | [?0.421, 0.089] | |
| Quadratic reaction | 0.023 | 0.040 | 0.191 | [0.009, 0.374] | . | . | . | . | 0.014 | 0.367 | 0.103 | [?0.121, 0.328] | |
| 22~25 years | Baseline change | 0.317 | <0.001 | 0.084 | [0.054, 0.114] | 0.260 | 0.001 | 0.066 | [0.026, 0.107] | 0.331 | <0.001 | 0.093 | [0.050, 0.135] |
| Event year | 0.292 | 0.002 | 0.059 | [0.022, 0.095] | 0.290 | 0.032 | 0.056 | [0.005, 0.107] | 0.207 | 0.100 | 0.043 | [?0.008, 0.094] | |
| Linear anticipation | 0.071 | 0.111 | 0.097 | [?0.022, 0.216] | 0.052 | 0.429 | 0.065 | [?0.097, 0.228] | 0.045 | 0.427 | 0.067 | [?0.098, 0.233] | |
| Quadratic anticipation | 0.008 | 0.185 | 0.073 | [?0.035, 0.182] | 0.004 | 0.672 | 0.032 | [?0.116, 0.180] | 0.005 | 0.503 | 0.051 | [?0.099, 0.201] | |
| Linear reaction | 0.105 | 0.033 | 0.110 | [0.009, 0.211] | 0.091 | 0.166 | 0.098 | [?0.041, 0.237] | 0.164 | 0.016 | 0.172 | [0.032, 0.312] | |
| Quadratic reaction | ?0.014 | 0.039 | ?0.095 | [?0.185, ?0.005] | ?0.015 | 0.072 | ?0.113 | [?0.235, 0.010] | ?0.020 | 0.032 | ?0.137 | [?0.262, ?0.012] | |
| 26~29 years | Baseline change | 0.235 | 0.012 | 0.060 | [0.013, 0.108] | 0.171 | 0.156 | 0.045 | [?0.017, 0.106] | 0.335 | 0.033 | 0.085 | [0.008, 0.163] |
| Event year | 0.321 | 0.020 | 0.063 | [0.010, 0.117] | 0.242 | 0.171 | 0.049 | [?0.021, 0.120] | 0.438 | 0.058 | 0.080 | [?0.003, 0.162] | |
| Linear anticipation | 0.179 | 0.002 | 0.290 | [0.105, 0.475] | ?0.000 | ?0.001 | [?0.069, 0.068] | 0.165 | 0.064 | 0.278 | [?0.016, 0.571] | ||
| Quadratic anticipation | 0.020 | 0.002 | 0.272 | [0.102, 0.442] | . | . | . | . | 0.018 | 0.073 | 0.248 | [?0.023, 0.519] | |
| Linear reaction | ?0.044 | 0.619 | ?0.039 | [?0.193, 0.115] | 0.015 | 0.012 | [?0.060, 0.084] | 0.022 | 0.870 | 0.020 | [?0.220, 0.260] | ||
| Quadratic reaction | 0.006 | 0.629 | 0.034 | [?0.104, 0.173] | . | . | . | . | 0.002 | 0.912 | 0.012 | [?0.204, 0.228] | |
| 18~29 years | 18~21 years | 22~25 years | 26~29 years | |
|---|---|---|---|---|
| Intercept(b0) | 3.553* | 3.511* | 3.561* | 3.528* |
| Testing(b1) | 0.039* | 0.096* | 0.041* | 0.041* |
| Gender(b2) | ?0.235* | ?0.197 | ?0.257* | ?0.212* |
| Group(b3) | 0.04 | 0.211+ | ?0.048 | 0.027 |
| Age at event(b4) | ?0.017* | 0.006 | 0.000 | ?0.022* |
| Age at event2(b5) | 0.001 | ?0.001 | 0.006 | 0.001 |
| Baseline Change(b6) | ?0.177* | ?0.271* | ?0.177* | ?0.176** |
| Baseline Change×Group(b7) | 0.237* | ?0.117 | 0.388 | 0.260* |
| Baseline Change×Gender(b8) | 0.123+ | 0.042 | 0.129* | 0.138* |
| Group×Gender(b9) | 0.113 | 0.049 | 0.225* | 0.092 |
| Baseline Change×Gender×Group(b10) | 0.016 | 0.242 | ?0.141 | 0.006 |
Table S31 Gender Differences in Postevent Baseline Change Without Gender-Specific Matching
| 18~29 years | 18~21 years | 22~25 years | 26~29 years | |
|---|---|---|---|---|
| Intercept(b0) | 3.553* | 3.511* | 3.561* | 3.528* |
| Testing(b1) | 0.039* | 0.096* | 0.041* | 0.041* |
| Gender(b2) | ?0.235* | ?0.197 | ?0.257* | ?0.212* |
| Group(b3) | 0.04 | 0.211+ | ?0.048 | 0.027 |
| Age at event(b4) | ?0.017* | 0.006 | 0.000 | ?0.022* |
| Age at event2(b5) | 0.001 | ?0.001 | 0.006 | 0.001 |
| Baseline Change(b6) | ?0.177* | ?0.271* | ?0.177* | ?0.176** |
| Baseline Change×Group(b7) | 0.237* | ?0.117 | 0.388 | 0.260* |
| Baseline Change×Gender(b8) | 0.123+ | 0.042 | 0.129* | 0.138* |
| Group×Gender(b9) | 0.113 | 0.049 | 0.225* | 0.092 |
| Baseline Change×Gender×Group(b10) | 0.016 | 0.242 | ?0.141 | 0.006 |
| Sample | E-value (Point Estimate) | E-value (Lower Bound) |
|---|---|---|
| Overall (ages 18~29) | 1.88 | 1.62 |
| Early Emerging Adulthood (ages 18~21) | 1.15 | (Main effect not significant, not meaningful) |
| Middle Emerging Adulthood (ages 22~25) | 2.05 | 1.72 |
| Late Emerging Adulthood (ages 26~29) | 1.80 | 1.26 |
Table S32 Results of E-value Sensitivity Analysis for the Main Effects of Linear Mixed Models after Propensity Score Matching
| Sample | E-value (Point Estimate) | E-value (Lower Bound) |
|---|---|---|
| Overall (ages 18~29) | 1.88 | 1.62 |
| Early Emerging Adulthood (ages 18~21) | 1.15 | (Main effect not significant, not meaningful) |
| Middle Emerging Adulthood (ages 22~25) | 2.05 | 1.72 |
| Late Emerging Adulthood (ages 26~29) | 1.80 | 1.26 |
| Variable | Survey Item |
|---|---|
| Gender | Choose “Gender”: 0 = female, 1 = male |
| Age | Use the survey year minus year and month of birth to calculate age |
| Marriage time | Question: When did you get married? Year ___, Month ___ |
| Employment status | Question: In the past week, did you work for at least 1 hour? (0 = no, 1 = yes) |
| Years of education | Total years of formal education completed |
| Annual income | Report income for each detailed item; total annual income is automatically calculated |
| Health status | Question: How do you rate your own health? (1 = very healthy, 5 = unhealthy) |
| Life satisfaction | Question: Overall, how satisfied are you with your life situation? (1 = very dissatisfied, 5 = very satisfied) |
| Marital status | (1) unmarried: never married and not cohabiting at present (2) Married: currently married, including both registered marriages and de facto marriages (3)Cohabiting: living together without obtaining a marriage certificate, not a formal marriage (4)Divorced: previously married, divorced, not remarried, not currently cohabiting (5)Widowed: spouse has passed away, not remarried |
| Positive affect | I felt cheerful (1 = rarely or none of the time [<1 day], 2 = some of the time [1~2 days], 3 = occasionally [3~4 days], 4 = most of the time [5~7 days]) |
| I was happy | |
| Negative emotion | - I felt depressed (1 = rarely or none of the time [<1 day], 2 = some of the time [1~2 days], 3 = occasionally [3~4 days], 4 = most of the time [5~7 days]) |
| I felt sad | |
| I felt lonely | |
| I felt that everything I did was an effort | |
| My sleep was restless | |
| I felt that life was meaningless |
Table S33 Survey Items (from the CFPS 2020 Individual Questionnaire)
| Variable | Survey Item |
|---|---|
| Gender | Choose “Gender”: 0 = female, 1 = male |
| Age | Use the survey year minus year and month of birth to calculate age |
| Marriage time | Question: When did you get married? Year ___, Month ___ |
| Employment status | Question: In the past week, did you work for at least 1 hour? (0 = no, 1 = yes) |
| Years of education | Total years of formal education completed |
| Annual income | Report income for each detailed item; total annual income is automatically calculated |
| Health status | Question: How do you rate your own health? (1 = very healthy, 5 = unhealthy) |
| Life satisfaction | Question: Overall, how satisfied are you with your life situation? (1 = very dissatisfied, 5 = very satisfied) |
| Marital status | (1) unmarried: never married and not cohabiting at present (2) Married: currently married, including both registered marriages and de facto marriages (3)Cohabiting: living together without obtaining a marriage certificate, not a formal marriage (4)Divorced: previously married, divorced, not remarried, not currently cohabiting (5)Widowed: spouse has passed away, not remarried |
| Positive affect | I felt cheerful (1 = rarely or none of the time [<1 day], 2 = some of the time [1~2 days], 3 = occasionally [3~4 days], 4 = most of the time [5~7 days]) |
| I was happy | |
| Negative emotion | - I felt depressed (1 = rarely or none of the time [<1 day], 2 = some of the time [1~2 days], 3 = occasionally [3~4 days], 4 = most of the time [5~7 days]) |
| I felt sad | |
| I felt lonely | |
| I felt that everything I did was an effort | |
| My sleep was restless | |
| I felt that life was meaningless |
| [1] |
Adams T. R., Rabin L. A., Da Silva V. G., Katz M. J., Fogel J., & Lipton R. B. (2016). Social support buffers the impact of depressive symptoms on life satisfaction in old age. Clinical Gerontologist, 39(2), 139-157. https://doi.org/10.1080/07317115.2015.1073823
URL pmid: 27418714 |
| [2] | Armenta, C., Bao K. J., Lyubomirsky S., & Sheldon K. M. (2014). Is lasting change possible? Lessons from the hedonic adaptation prevention model. In K. M. Sheldon & R. E. Lucas (Eds.), Stability of happiness (pp. 57-74). Academic Press. https://doi.org/10.1016/b978-0-12-411478-4.00004-7 |
| [3] |
Arnett J. J. (2000). Emerging adulthood: A theory of development from the late teens through the twenties. American Psychologist, 55(5), 469-480. https://doi.org/10.1037/0003-066X.55.5.469
URL pmid: 10842426 |
| [4] | Arnett J. J., & Schwab J. (2012). 2012 poll of emerging adults: Thriving, struggling & hopeful [Report]. Clark University. https://commons.clarku.edu/clarkunipoll/1 |
| [5] | Arnett J. J., Žukauskienė R., & Sugimura K. (2014). The new life stage of emerging adulthood at ages 18-29 years: Implications for mental health. The Lancet Psychiatry, 1(7), 569-576. https://doi.org/10.1016/s2215-0366(14)00080-7 |
| [6] |
Austin P. C. (2009). Balance diagnostics for comparing the distribution of baseline covariates between treatment groups in propensity‐score matched samples. Statistics in Medicine, 28(25), 3083-3107. https://doi.org/10.1002/sim.3697
doi: 10.1002/sim.3697 URL pmid: 19757444 |
| [7] |
Baird B. M., Lucas R. E., & Donnellan M. B. (2010). Life satisfaction across the lifespan: Findings from two nationally representative panel studies. Social Indicators Research, 99(2), 183-203. https://doi.org/10.1007/s11205-010-9584-9
URL pmid: 21113322 |
| [8] | Barry C. M., Madsen S. D., Nelson L. J., Carroll J. S., & Badger S. (2009). Friendship and romantic relationship qualities in emerging adulthood: Differential associations with identity development and achieved adulthood criteria. Journal of Adult Development, 16(4), 209-222. https://doi.org/10.1007/s10804-009-9067-x |
| [9] | Bell L. G., & Harsin A. (2018). A prospective longitudinal study of marriage from midlife to later life. Couple and Family Psychology: Research and Practice, 7(1), 12. https://doi.org/10.1037/cfp0000096 |
| [10] | Bi K., Chen P., & Chen S. (2023). Validating the 8-item Center for Epidemiological Studies Depression Scale-Chinese (CESD-Chinese): Data from the China Family Panel Studies (CFPS). OSF Preprints. https://doi.org/10.31219/osf.io/4brd7 |
| [11] | Boyce C. J., Wood A. M., & Ferguson E. (2016). For better or for worse: The moderating effects of personality on the marriage-life satisfaction link. Personality and Individual Differences, 97, 61-66. https://doi.org/10.1016/j.paid.2016.03.005 |
| [12] | Bramlett M. D., & Mosher W. D. (2002). Cohabitation, marriage, divorce, and remarriage in the United States (Vital and Health Statistics Series 23, No. 22). National Center for Health Statistics. https://doi.org/10.1037/e372462004-001 |
| [13] | Brickman P., & Campbell D. T. (1971). Hedonic relativism and planning the good society. In M. H. Appley (Ed.), Adaptation-level theory (pp. 287-302). Academic Press. |
| [14] |
Buecker S., Denissen J. J. A., & Luhmann M. (2021). A propensity-score matched study of changes in loneliness surrounding major life events. Journal of Personality and Social Psychology, 121(3), 669-690. https://doi.org/10.1037/pspp0000373
doi: 10.1037/pspp0000373 URL pmid: 33119390 |
| [15] | Cai H., Yuan J., Su Z., Wang X., Huang Z., Jing Y., & Yang Z. (2023). Does economic growth raise happiness in China? A comprehensive re-examination. Social Psychological and Personality Science, 14(2), 238-248. https://doi.org/10.1177/19485506221089804 |
| [16] |
Carr D., & Utz R. L. (2020). Families in later life: A decade in review. Journal of Marriage and Family, 82(1), 346-363. https://doi.org/10.1111/jomf.12609
doi: 10.1111/jomf.12609 URL pmid: 33633412 |
| [17] |
Casey B. J., Getz S., & Galvan A. (2008). The adolescent brain. Developmental review, 28(1), 62-77. https://doi.org/10.1016/j.dr.2007.08.003
doi: 10.1016/j.dr.2007.08.003 URL pmid: 18688292 |
| [18] |
Cheung F., & Lucas R. E. (2014). Assessing the validity of single-item life satisfaction measures: Results from three large samples. Quality of Life Research, 23, 2809-2818. https://doi.org/10.1007/s11136-014-0726-4
doi: 10.1007/s11136-014-0726-4 URL pmid: 24890827 |
| [19] | Chipperfield J. G., & Havens B. (2001). Gender differences in the relationship between marital status transitions and life satisfaction in later life. The Journals of Gerontology: Series B, 56(3), P176-P186. https://doi.org/10.1093/geronb/56.3.P176 |
| [20] |
Choquette K. A., & Hesselbrock M. N. (1987). Effects of retesting with the Beck and Zung depression scales in alcoholics. Alcohol and Alcoholism, 22(3), 277-283. https://doi.org/10.1093/oxfordjournals.alcalc.a044709
URL pmid: 3620002 |
| [21] | Clark A. E., Diener E., Georgellis Y., & Lucas R. E. (2008). Lags and leads in life satisfaction: A test of the baseline hypothesis. The Economic Journal, 118(529), F222-F243. https://doi.org/10.1111/j.1468-0297.2008.02150.x |
| [22] | Clark A. E., & Georgellis Y. (2012). Back to baseline in Britain: Adaptation in the BHPS. SSRN Electronic Journal. https://doi.org/10.2139/ssrn.2031994 |
| [23] |
Cobb S. (1976). Social support as a moderator of life stress. Psychosomatic medicine, 38(5), 300-314. https://doi.org/10.1097/00006842-197609000-00003
doi: 10.1097/00006842-197609000-00003 URL pmid: 981490 |
| [24] | Cohen A. O., Breiner K., Steinberg L., Bonnie R. J., Scott E. S., Taylor-Thompson K., Casey B. J. (2016). When is an adolescent an adult? Assessing cognitive control in emotional and nonemotional contexts. Psychological Science, 27(4), 549-562. https://doi.org/10.1177/0956797615627625 |
| [25] |
Cohen S., & Wills T. A. (1985). Stress, social support, and the buffering hypothesis. Psychological Bulletin, 98(2), 310-357. https://doi.org/10.1037/0033-2909.98.2.310
URL pmid: 3901065 |
| [26] |
DeMaris A., & Oates G. (2022). The trajectory of subjective well-being: A partial explanation of the marriage advantage. Journal of Family Issues, 43(6), 1650-1668. https://doi.org/10.1177/0192513x211030033
doi: 10.1177/0192513x211030033 URL pmid: 35755972 |
| [27] |
Denissen J. J. A., Luhmann M., Chung J. M., & Bleidorn W. (2019). Transactions between life events and personality traits across the adult lifespan. Journal of Personality and Social Psychology, 116(4), 612-633. https://doi.org/10.1037/pspp0000196
doi: 10.1037/pspp0000196 URL pmid: 30047764 |
| [28] | Deng X., & Xiang Y. (2023). Is marriage the tomb of happiness? Evidence from CFPS tracking data based on a PSM-DID approach. Journal of Psychological Science, 46(3), 635-643. https://doi.org/10.1177/2057150x15614535 |
| [29] | De Vries B., & Watt D. (1996). A lifetime of events: Age and gender variations in the life story. The International Journal of Aging and Human Development, 42(2), 81-102. https://doi.org/10.2190/FM22-V5VT-B60Y-6UGC |
| [30] | Diener E., Gohm C. L., Suh E., & Oishi S. (2000). Similarity of the relations between marital status and subjective well-being across cultures. Journal of Cross-Cultural Psychology, 31(4), 419-436. https://10.1177/0022022100031004001 |
| [31] |
Diener E., Lucas R. E., & Scollon C. N. (2006). Beyond the hedonic treadmill: Revising the adaptation theory of well-being. American Psychologist, 61(4), 305-314. https://doi.org/10.1037/0003-066X.61.4.305
URL pmid: 16719675 |
| [32] | Diener, E., & Oishi S. (Eds.). (2018). Handbook of well-being (pp. 1-962). Noba Scholar. |
| [33] | Diener E., Oishi S., & Lucas R. E. (2003). Personality, culture, and subjective well-being: Emotional and cognitive evaluations of life. Annual Review of Psychology, 54(1), 403-425. https://doi.org/10.1146/annurev.psych.54.101601.145056 |
| [34] | Dion K. K., & Dion K. L. (1993). Individualistic and collectivistic perspectives on gender and the cultural context of love and intimacy. Journal of Social Issues, 49(3), 53-69. https://doi.org/10.1111/j.1540-4560.1993.tb01168.x |
| [35] |
Fakhari A., Farahbakhsh M., Azizi H., Esmaeili E. D., Mirzapour M., Rahimi V. A., … Gaffarifam S. (2020). Early marriage and negative life events affect on depression in young adults and adolescents. Archives of Iranian Medicine, 23(2), 90-98.
pmid: 32061071 |
| [36] | Fang F. (2018). Culture and family life: Three studies on family and marriage relationships across cultures [Doctoral dissertation, Virginia Tech]. http://hdl.handle.net/10919/83771 |
| [37] | Ferreira R. W., & Domingues M. R. (2021). Can your partner influence your physical activity? The role of social support provided by partners. Revista Brasileira de Atividade Física & Saúde, 26, 1-9. https://doi.org/10.12820/rbafs.26e0195 |
| [38] | Fincham F. D., & Beach S. R. H. (2010). Marriage in the new millennium: A decade in review. Journal of Marriage and Family, 72(3), 630-649. https://doi.org/10.1111/j.1741-3737.2010.00722.x |
| [39] | Finkel E. J., Larson G. M., Carswell K. L., & Hui C. M. (2014). Marriage at the summit: Response to the commentaries. Psychological Inquiry, 25(1), 120-145. https://doi.org/10.1080/1047840X.2014.890512 |
| [40] | Frederick, S., & Loewenstein G. (1999). Hedonic adaptation. In D. Kahneman, E. Diener, & N. Schwarz (Eds.), Well-being: The foundations of hedonic psychology (pp. 302-329). Russell Sage Foundation. |
| [41] | Gattig A., & Minkus L. (2021). Does marriage increase couples’ life satisfaction? Evidence using panel data and fixed-effects individual slopes. Comparative Population Studies, 46, Article 5. https://doi.org/10.12765/CPoS-2021-05 |
| [42] | Gómez-López M., Viejo C., & Ortega-Ruiz R. (2019). Well-being and romantic relationships: A systematic review in adolescence and emerging adulthood. International Journal of Environmental Research and Public Health, 16(13), 2415. https://doi.org/10.3390/ijerph16132415 |
| [43] | Goodwin R., & Cramer D. (2000). Marriage and social support in a British-Asian community. Journal of Community & Applied Social Psychology, 10(1), 49-62. https://doi.org/10.1002/(sici)1099-1298(200001/02)10:1<49::aid-casp549>3.0.co;2-0 |
| [44] |
Grover S., & Helliwell J. F. (2019). How’s life at home? New evidence on marriage and the set point for happiness. Journal of Happiness Studies, 20(2), 373-390. https://doi.org/10.1007/s10902-017-9941-3
doi: 10.1007/s10902-017-9941-3 URL |
| [45] | Grundström J., Konttinen H., Berg N., & Kiviruusu O. (2021). Associations between relationship status and mental well-being in different life phases from young to middle adulthood. SSM - Population Health, 14, 100774. https://doi.org/10.1016/j.ssmph.2021.100774 |
| [46] |
Harder V. S., Stuart E. A., & Anthony J. C. (2010). Propensity score techniques and the assessment of measured covariate balance to test causal associations in psychological research. Psychological Methods, 15(3), 234-249. https://doi.org/10.1037/a0019623
doi: 10.1037/a0019623 URL pmid: 20822250 |
| [47] |
Heckhausen J., Wrosch C., & Schulz R. (2010). A motivational theory of life-span development. Psychological Review, 117(1), 32-60. https://doi.org/10.1037/a0017668
doi: 10.1037/a0017668 URL pmid: 20063963 |
| [48] | Helliwell J. F. (2003). How's life? Combining individual and national variables to explain subjective well-being. Economic Modelling, 20(2), 331-360. https://doi.org/10.3386/w9065 |
| [49] |
Holt-Lunstad J., Birmingham W., & Jones B. Q. (2008). Is there something unique about marriage? The relative impact of marital status, relationship quality, and network social support on ambulatory blood pressure and mental health. Annals of Behavioral Medicine, 35(2), 239-244. https://doi.org/10.1007/s12160-008-9018-y
doi: 10.1007/s12160-008-9018-y URL pmid: 18347896 |
| [50] | Hu Y., Zhang R., Zhao S., & Zhang J. (2024). How and why marriage is related to subjective well‐being? Evidence from Chinese society. Journal of Family Issues. Advance online publication. https://doi.org/10.1177/0192513X241263785 |
| [51] | Hudde A. (2023). Do they think that joy and misery are temporary? Comparing trajectories of current and predicted life satisfaction across life events. European Societies, 26(4), 1121-1136. https://doi.org/10.1080/14616696.2023.2289653 |
| [52] | Hutteman R., Hennecke M., Orth U., Reitz A. K., & Specht J. (2014). Developmental tasks as a framework to study personality development in adulthood and old age. European Journal of Personality, 28(3), 267-278. https://doi.org/10.1002/per.1959 |
| [53] |
Icenogle G., & Cauffman E. (2021). Adolescent decision making: A decade in review. Journal of Research on Adolescence, 31(4), 1006-1022. https://doi.org/10.1111/jora.12608
doi: 10.1111/jora.12608 URL pmid: 34820945 |
| [54] | Impicciatore R., & Tomatis F. (2020). The nexus between education and fertility in six European countries. Genus, 76(1), 35. https://doi.org/10.1186/s41118-020-00104-4 |
| [55] | Ji Y. (2015). Between tradition and modernity: "Leftover" women in Shanghai. Journal of Marriage and Family, 77(5), 1057-1073. https://doi.org/10.1111/jomf.12220 |
| [56] |
Johnson M. D., Krahn H. J., & Galambos N. L. (2017). Better late than early: Marital timing and subjective well-being in midlife. Journal of Family Psychology, 31(5), 635-641. https://doi.org/10.1037/fam0000297
doi: 10.1037/fam0000297 URL pmid: 28114770 |
| [57] | Kim S. (2011). Sociological studies on happiness in cross-national contexts: Effects of economic inequality and marriage [Unpublished doctoral dissertation]. The University of Iowa. https://doi.org/10.17077/etd.89z7hvrm |
| [58] |
Kroger J., Martinussen M., & Marcia J. E. (2010). Identity status change during adolescence and young adulthood: A meta‐analysis. Journal of Adolescence, 33(5), 683-698. https://doi.org/10.1016/j.adolescence.2009.11.002
doi: 10.1016/j.adolescence.2009.11.002 URL pmid: 20004962 |
| [59] | Le B., & Agnew C. R. (2003). Commitment and its theorized determinants: A meta-analysis of the Investment Model. Personal Relationships, 10(1), 37-57. https://doi.org/10.1111/1475-6811.00035 |
| [60] | Lee Y. (2021). A longitudinal analysis of the association between transition into marriage and life satisfaction and childhood parental divorce as a moderator. Human Ecology Research, 59(1), 113-125. https://doi.org/10.6115/fer.2021.009 |
| [61] | Li F., Chen C., Wang J., Peng H., Wu L., Ren L., … Yang Q. (2022). A cross-temporal meta-analysis on marital satisfaction of Chinese couples. Frontiers in Psychology, 13, Article 903276. https://doi.org/10.3389/fpsyg.2022.903276 |
| [62] |
Liu H., Li S., & Feldman M. W. (2013). Gender in marriage and life satisfaction under gender imbalance in China: The role of intergenerational support and SES. Social Indicators Research, 114(3), 915-933. https://doi.org/10.1007/s11205-012-0180-z
URL pmid: 26640317 |
| [63] |
Liu S., Fang Y., Su Z., Cai J., & Chen Z. (2023). Factor structure and measurement invariance of the 8-item CES-D: A national longitudinal sample of Chinese adolescents. BMC Psychiatry, 23(1), 868. https://doi.org/10.1186/s12888-023-05316-4
doi: 10.1186/s12888-023-05316-4 URL pmid: 37993821 |
| [64] | Lucas R. E., & Clark A. E. (2006). Do people really adapt to marriage?. Journal of Happiness Studies, 7(4), 405-426. https://doi.org/10.1007/s10902-006-9001-x |
| [65] |
Lucas R. E., Clark A. E., Georgellis Y., & Diener E. (2003). Reexamining adaptation and the set point model of happiness: Reactions to changes in marital status. Journal of Personality and Social Psychology, 84(3), 527-539. https://doi.org/10.1037/0022-3514.84.3.527
URL pmid: 12635914 |
| [66] |
Lucas R. E., & Donnellan M. B. (2012). Estimating the reliability of single-item life satisfaction measures: Results from four national panel studies. Social Indicators Research, 105(3), 323-331. https://doi.org/10.1007/s11205-011-9783-z
doi: 10.1007/s11205-011-9783-z URL pmid: 23087538 |
| [67] |
Luhmann M., Hofmann W., Eid M., & Lucas R. E. (2012). Subjective well-being and adaptation to life events: A meta-analysis. Journal of Personality and Social Psychology, 102(3), 592-615. https://doi.org/10.1037/a0025948
doi: 10.1037/a0025948 URL pmid: 22059843 |
| [68] | Luo D., Yan X., Xu R., Zhang J., Shi X., Ma J., … Sawyer S. M. (2020). Chinese trends in adolescent marriage and fertility between 1990 and 2015: A systematic synthesis of national and subnational population data. The Lancet Global Health, 8(7), e954-e964. https://doi.org/10.1016/S2214-109X(20)30130-3 |
| [69] | Lyubomirsky, S. (2011). Hedonic adaptation to positive and negative experiences. In S. Folkman (Ed.), The Oxford handbook of stress, health, and coping (pp. 200-224). Oxford University Press. https://doi.org/10.1093/oxfordhb/9780195375343.013.0011 |
| [70] |
Malone J. C., Liu S. R., Vaillant G. E., Rentz D. M., & Waldinger R. J. (2016). Midlife Eriksonian psychosocial development: Setting the stage for late-life cognitive and emotional health. Developmental Psychology, 52(3), 496-508. https://doi.org/10.1037/a0039875
doi: 10.1037/a0039875 URL pmid: 26551530 |
| [71] |
McAdams D. P., de St Aubin E. D., & Logan R. L. (1993). Generativity among young, midlife, and older adults. Psychology and Aging, 8(2), 221-230. https://doi.org/10.1037/0882-7974.8.2.221
URL pmid: 8323726 |
| [72] | Næss, S., Blekesaune, M., & Jakobsson, N. (2015). Marital transitions and life satisfaction: Evidence from longitudinal data from Norway. Acta Sociologica, 58(1), 63-78. https://doi.org/10.1177/0001699314563841 |
| [73] | Oh H. J., Ozkaya E., & LaRose R. (2014). How does online social networking enhance life satisfaction? The relationships among online supportive interaction, affect, perceived social support, sense of community, and life satisfaction. Computers in Human Behavior, 30, 69-78. https://doi.org/10.1016/j.chb.2013.07.053 |
| [74] | Pavlenko V., & Krasnikova K. (2024). The interconnection between empathy and the quality of marital relations with different length of marriage. Visnyk of V. N. Karazin Kharkiv National University, Series: Psychology, 77, 40-45. https://doi.org/10.26565/2225-7756-2024-77-05 |
| [75] | Pinquart M. (2003). Loneliness in married, widowed, divorced, and never-married older adults. Journal of Social and Personal Relationships, 20(1), 31-53. https://doi.org/10.1177/02654075030201002 |
| [76] | Piotrowski K., Brzezińska A. I., & Luyckx K. (2020). Adult roles as predictors of adult identity and identity commitment in Polish emerging adults: Psychosocial maturity as an intervening variable. Current Psychology, 39(6), 2149-2158. https://doi.org/10.1007/s12144-018-9903-x |
| [77] |
Preacher K. J., & Hayes A. F. (2008). Asymptotic and resampling strategies for assessing and comparing indirect effects in multiple mediator models. Behavior Research Methods, 40(3), 879-891. https://doi.org/10.3758/brm.40.3.879
doi: 10.3758/brm.40.3.879 URL pmid: 18697684 |
| [78] | Qing S. (2020). Gender role attitudes and male-female income differences in China. The Journal of Chinese Sociology, 7(1), Article 12. https://doi.org/10.1186/s40711-020-00123-w |
| [79] | Radloff L. S. (1977). The CES-D scale: A self-report depression scale for research in the general population. Applied Psychological Measurement, 1(3), 385-401. https://doi.org/10.1177/014662167700100306 |
| [80] | Reis M., Ramiro L., & de Matos M. G. (2014). How do we love? Do gender, age, "passion status" and "control" really matter? Highlights from the questionnaire "Being in love". Asian Journal of Humanities and Social Studies, 2(4), 513-521. https://www.academia.edu/93429597/ |
| [81] |
Robards J., Evandrou M., Falkingham J., & Vlachantoni A. (2012). Marital status, health and mortality. Maturitas, 73(4), 295-299. https://doi.org/10.1016/j.maturitas.2012.08.007
doi: 10.1016/j.maturitas.2012.08.007 URL pmid: 23007006 |
| [82] | Rodrigues D., Lopes D., Monteiro L., & Prada M. (2017). Perceived parent and friend support for romantic relationships in emerging adults. Personal Relationships, 24(1), 4-16. https://doi.org/10.1111/pere.12163 |
| [83] |
Rohrer J. M., Richter D., Brümmer M., Wagner G. G., & Schmukle S. C. (2018). Successfully striving for happiness: Socially engaged pursuits predict increases in life satisfaction. Psychological Science, 29(8), 1291-1298. https://doi.org/10.1177/0956797618761660
doi: 10.1177/0956797618761660 URL pmid: 29775423 |
| [84] | Rubin D. B. (2001). Using propensity scores to help design observational studies: Application to the tobacco litigation. Health Services and Outcomes Research Methodology, 2, 169-188. https://doi.org/10.1017/cbo9780511810725.030 |
| [85] |
Rudolph M. D., Miranda-Domínguez O., Cohen A. O., Breiner K., Steinberg L., Bonnie R. J.,... Fair D. A. (2017). At risk of being risky: The relationship between "brain age" under emotional states and risk preference. Developmental Cognitive Neuroscience, 24, 93-106. https://doi.org/10.1016/j.dcn.2017.01.010
doi: S1878-9293(16)30107-4 URL pmid: 28279917 |
| [86] | Schimmack, U., Diener E., & Oishi S. (2009). Life-satisfaction is a momentary judgment and a stable personality characteristic:The use of chronically accessible and stable sources. In E. Diener (Ed.), Assessing well-being: The collected works of Ed Diener (pp. 181-212). Springer. https://doi.org/10.1007/978-90-481-2354-4_9 |
| [87] | Shadish W. R., Cook T. D., & Campbell D. T. (2002). Experimental and quasi-experimental designs for generalized causal inference (2nd ed.). Houghton Mifflin. |
| [88] | Siddiqi M., & Greene M. E. (2022). Mapping the field of child marriage: Evidence, gaps, and future directions from a large-scale systematic scoping review, 2000-2019. Journal of Adolescent Health, 70(3), S9-S16. https://doi.org/10.1016/j.jadohealth.2021.09.020 |
| [89] |
Simon R. W., & Barrett A. E. (2010). Nonmarital romantic relationships and mental health in early adulthood: Does the association differ for women and men? Journal of Health and Social Behavior, 51(2), 168-182. https://doi.org/10.1177/0022146510372343
URL pmid: 20617757 |
| [90] | Soulsby L. K., & Bennett K. M. (2015). Marriage and psychological wellbeing: The role of social support. Psychology, 6(11), 1349-1359. https://doi.org/10.4236/psych.2015.611132 |
| [91] |
Stanley S. M., Ragan E. P., Rhoades G. K., & Markman H. J. (2012). Examining changes in relationship adjustment and life satisfaction in marriage. Journal of Family Psychology, 26(1), 165-170. https://doi.org/10.1037/a0026759
doi: 10.1037/a0026759 URL pmid: 22309820 |
| [92] |
Stern J., Krämer M. D., Schumacher A., MacDonald G., & Richter D. (2024). Differences between lifelong singles and ever-partnered individuals in Big Five personality traits and life satisfaction. Psychological Science, 35(12), 1364-1381. https://doi.org/10.1177/09567976241286865
doi: 10.1177/09567976241286865 URL pmid: 39576846 |
| [93] | Stets J. E., & Burke P. J. (2005). Identity verification, control, and aggression in marriage. Social Psychology Quarterly, 68(2), 160-178. https://doi.org/10.1177/019027250506800204 |
| [94] |
Stronge S., Overall N. C., & Sibley C. G. (2019). Gender differences in the associations between relationship status, social support, and wellbeing. Journal of Family Psychology, 33(7), 819-829. https://doi.org/10.1037/fam0000540
doi: 10.1037/fam0000540 URL pmid: 31094543 |
| [95] |
Stuart E. A. (2010). Matching methods for causal inference: A review and a look forward. Statistical Science, 25(1), 1-21. https://doi.org/10.1214/09-STS313
URL pmid: 20871802 |
| [96] | Stuart E. A., Lee B. K., & Leacy F. P. (2013). Prognostic score-based balance measures can be a useful diagnostic for propensity score methods in comparative effectiveness research. Journal of Clinical Epidemiology, 66(8), S84-S90.e1. https://doi.org/10.1016/j.jclinepi.2013.01.013 |
| [97] | Tillman K. H., Brewster K. L., & Holway G. V. (2019). Sexual and romantic relationships in young adulthood. Annual Review of Sociology, 45(1), 133-153. https://doi.org/10.1146/annurev-soc-073018-022625 |
| [98] | van de Vijver F. J. R., & Arends-Tóth, J. V. ,(2009). Family support in five cultural groups in the Netherlands. Journal of Comparative Family Studies, 40(3), 455-473. https://doi.org/10.3138/jcfs.40.3.455 |
| [99] |
VanderWeele T. J., & Ding P. (2017). Sensitivity analysis in observational research: Introducing the E-value. Annals of Internal Medicine, 167(4), 268-274. https://doi.org/10.7326/M16-2607
doi: 10.7326/M16-2607 URL pmid: 28693043 |
| [100] | Willroth E. C., Atherton O. E., & Robins R. W. (2021). Life satisfaction trajectories during adolescence and the transition to young adulthood: Findings from a longitudinal study of Mexican-origin youth. Journal of Personality and Social Psychology, 120(1), 192-205. https://doi.org/10.1037/pspp0000294 |
| [101] |
Wrzus C., Hänel M., Wagner J., & Neyer F. J. (2013). Social network changes and life events across the life span: A meta-analysis. Psychological Bulletin, 139(1), 53-80. https://doi.org/10.1037/a0028601
doi: 10.1037/a0028601 URL pmid: 22642230 |
| [102] | Xiao M., Li A., Wang Y., Yu C., Pang Y., Pei P., … Qu C. (2024). A wide landscape of morbidity and mortality risk associated with marital status in 0.5 million Chinese men and women: A prospective cohort study. The Lancet Regional Health - Western Pacific, 42, 100948. https://doi.org/10.1016/j.lanwpc.2023.100948 |
| [103] | Xie Y., Hu J., & Zhang C. (2014). The China Family Panel Studies: Design and practice. Chinese Journal of Sociology, 34(2), 1-32. https://www.society.shu.edu.cn/CN/Y2014/V34/I2/1 |
| Viewed | ||||||
|
Full text |
|
|||||
|
Abstract |
|
|||||