ISSN 0439-755X
CN 11-1911/B
主办:中国心理学会
中国科学院心理研究所
出版:科学出版社
CN 11-1911/B
主办:中国心理学会
中国科学院心理研究所
出版:科学出版社
心理学报 ›› 2026, Vol. 58 ›› Issue (2): 292-307.doi: 10.3724/SP.J.1041.2026.0292 cstr: 32110.14.2026.0292
• “社会治理视角下经济处境的心理影响及其干预策略”专栏 • 上一篇 下一篇
张衍1, 王俊秀2( ), 许博洋3, 崔雨晴2
收稿日期:2025-07-21
发布日期:2025-12-03
出版日期:2026-02-25
通讯作者:
王俊秀, E-mail: casswjx@163.com基金资助:
ZHANG Yan1, WANG Junxiu2(), XU Boyang3, CUI Yuqing2
Received:2025-07-21
Online:2025-12-03
Published:2026-02-25
摘要: 扩大中等收入群体是推进共同富裕和实现中国式现代化的重要途径。为考察扩大中等收入群体与公平感的关系, 本文分析了中国综合社会调查2010~2021年8期数据(N = 61,751)。结果发现:扩大中等收入群体与公平感的关系受到收入和经济发展水平的双重调节, 主观社会经济地位和向上流动感知在其中起到相互拮抗的中介作用。具体来说, 当收入和经济发展水平都低时, 扩大中等收入群体会降低公平感, 主观社会经济地位有显著负向的中介作用, 而向上流动感知有显著正向的中介作用; 当收入或经济发展水平变高时, 扩大中等收入群体对公平感的预测作用转为正向, 主观社会经济地位的中介作用转为正向, 而向上流动感知的中介作用转为负向。时空异质性检验发现研究结果具有可推广性。总的来说, 本研究提示调整收入分配结构应以经济发展为先。
中图分类号:
张衍, 王俊秀, 许博洋, 崔雨晴. (2026). 迈向橄榄型社会的心理意义:扩大中等收入群体与公平感提升. 心理学报, 58(2), 292-307.
ZHANG Yan, WANG Junxiu, XU Boyang, CUI Yuqing. (2026). Psychological meaning of moving toward an olive-shaped society: Relationship between expanding the middle-income group and enhancing sense of fairness. Acta Psychologica Sinica, 58(2), 292-307.
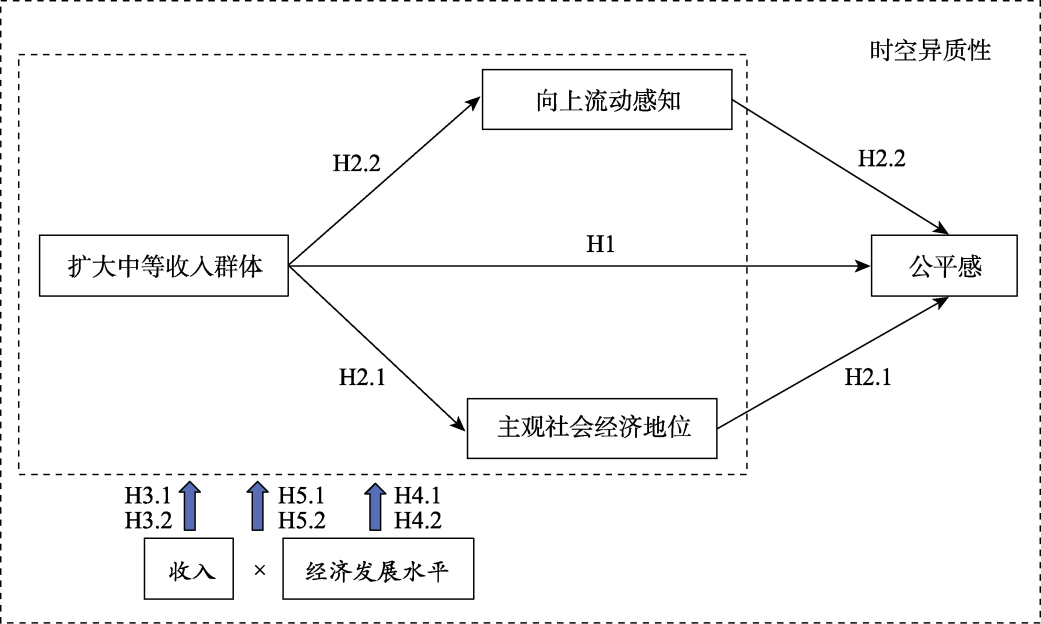
图1 理论框架图
| 变量 | 全样本特征 | 分时期均值 | ||||||||||
|---|---|---|---|---|---|---|---|---|---|---|---|---|
| 均值 | 标准差 | 取值范围 | 2010 | 2011 | 2012 | 2013 | 2015 | 2017 | 2018 | 2021 | ||
| 个体变量 | ||||||||||||
| 公平感 | 3.09 | 1.05 | 1~5 | 2.96 | 3.08 | 3.02 | 2.97 | 3.18 | 3.06 | 3.17 | 3.42 | |
| 性别 | 0.48 | 0.50 | 0=女性、1=男性 | 0.48 | 0.47 | 0.52 | 0.51 | 0.48 | 0.47 | 0.47 | 0.46 | |
| 年龄 | 46.20 | 13.72 | 18~70 | 44.89 | 45.29 | 45.82 | 45.35 | 46.46 | 46.97 | 47.60 | 47.27 | |
| 居住地 | 0.62 | 0.49 | 0=农村、1=城镇 | 0.60 | 0.57 | 0.60 | 0.61 | 0.59 | 0.64 | 0.71 | 0.58 | |
| 家庭年收入(对数) | 10.54 | 1.12 | 4.61~16.12 | 10.12 | 10.15 | 10.37 | 10.55 | 10.60 | 10.74 | 10.80 | 11.01 | |
| 受教育年限 | 9.31 | 4.46 | 0~19 | 8.96 | 8.87 | 9.20 | 9.31 | 9.19 | 9.62 | 9.35 | 10.10 | |
| 民族状况 | 0.92 | 0.27 | 0=少数民族、1=汉族 | 0.90 | 0.95 | 0.91 | 0.92 | 0.92 | 0.92 | 0.93 | 0.93 | |
| 宗教信仰 | 0.11 | 0.31 | 0=无、1=有 | 0.13 | 0.11 | 0.14 | 0.10 | 0.10 | 0.10 | 0.10 | 0.07 | |
| 政治面貌 | 0.11 | 0.31 | 0=非共产党员、 1=共产党员 | 0.12 | 0.10 | 0.12 | 0.10 | 0.10 | 0.10 | 0.10 | 0.12 | |
| 健康状况自评 | 3.61 | 1.09 | 1~5 | 3.67 | 2.87 | 3.62 | 3.80 | 3.71 | 3.57 | 3.64 | 3.58 | |
| 工作状况−无工作 | 0.33 | 0.47 | 0=否、1=是 | 0.31 | 0.28 | 0.29 | 0.30 | 0.35 | 0.36 | 0.38 | 0.40 | |
| 工作状况−务农 | 0.23 | 0.42 | 0=否、1=是 | 0.27 | 0.29 | 0.26 | 0.24 | 0.22 | 0.19 | 0.18 | 0.16 | |
| 工作状况−非农工作 | 0.44 | 0.50 | 0=否、1=是 | 0.42 | 0.43 | 0.45 | 0.46 | 0.43 | 0.45 | 0.44 | 0.43 | |
| 婚姻状况 | 0.82 | 0.39 | 0=未婚、1=已婚 | 0.85 | 0.84 | 0.84 | 0.83 | 0.81 | 0.80 | 0.80 | 0.76 | |
| 主观社会经济地位 | 4.21 | 1.69 | 1~10 | 4.04 | 4.12 | 4.17 | 4.36 | 4.32 | 4.14 | 4.26 | 4.31 | |
| 向上流动感知 | 1.00 | 1.39 | −9~9 | 1.16 | 1.21 | 1.12 | 1.06 | 0.95 | 0.88 | 0.78 | 0.91 | |
| 省级变量 | ||||||||||||
| 中等收入群体占比 | 0.48 | 0.08 | 0.28~0.81 | 0.46 | 0.49 | 0.49 | 0.52 | 0.48 | 0.46 | 0.45 | 0.47 | |
| 人均GDP (对数) | 10.70 | 0.50 | 9.46~12.14 | 10.24 | 10.44 | 10.53 | 10.63 | 10.76 | 10.92 | 11.02 | 11.26 | |
| 人均GDP增速 | 0.12 | 0.06 | −0.02~0.29 | 0.18 | 0.19 | 0.10 | 0.10 | 0.05 | 0.10 | 0.10 | 0.14 | |
| 城镇化率 | 0.58 | 0.13 | 0.23~0.90 | 0.51 | 0.54 | 0.54 | 0.56 | 0.59 | 0.62 | 0.63 | 0.65 | |
| 性别比(女性=100) | 104.79 | 3.78 | 95.77~120.43 | 104.29 | 104.99 | 104.85 | 105.23 | 105.56 | 104.44 | 104.72 | 104.11 | |
| 总抚养比 | 36.75 | 7.38 | 19.3~56.7 | 34.92 | 33.73 | 34.33 | 34.51 | 36.02 | 38.14 | 38.97 | 46.65 | |
| 社会保障占比 | 0.13 | 0.03 | 0.06~0.28 | 0.12 | 0.12 | 0.11 | 0.12 | 0.13 | 0.14 | 0.14 | 0.16 | |
| 第三产业占比 | 0.47 | 0.09 | 0.32~0.83 | 0.43 | 0.43 | 0.44 | 0.45 | 0.49 | 0.52 | 0.53 | 0.51 | |
| 私营就业人员占比 | 0.33 | 0.12 | 0.08~0.73 | 0.29 | 0.30 | 0.30 | 0.29 | 0.33 | 0.37 | 0.38 | 0.41 | |
| 高等教育招生比 | 1.08 | 0.57 | 0.38~3.54 | 0.93 | 1.02 | 0.99 | 1.01 | 1.06 | 1.14 | 1.17 | 1.42 | |
| 样本数 | 61751 | / | / | 9189 | 4289 | 9053 | 8653 | 7954 | 9028 | 8886 | 4699 | |
| 省份数 | 217 | / | / | 31 | 26 | 29 | 28 | 28 | 28 | 28 | 19 | |
表1 样本特征
| 变量 | 全样本特征 | 分时期均值 | ||||||||||
|---|---|---|---|---|---|---|---|---|---|---|---|---|
| 均值 | 标准差 | 取值范围 | 2010 | 2011 | 2012 | 2013 | 2015 | 2017 | 2018 | 2021 | ||
| 个体变量 | ||||||||||||
| 公平感 | 3.09 | 1.05 | 1~5 | 2.96 | 3.08 | 3.02 | 2.97 | 3.18 | 3.06 | 3.17 | 3.42 | |
| 性别 | 0.48 | 0.50 | 0=女性、1=男性 | 0.48 | 0.47 | 0.52 | 0.51 | 0.48 | 0.47 | 0.47 | 0.46 | |
| 年龄 | 46.20 | 13.72 | 18~70 | 44.89 | 45.29 | 45.82 | 45.35 | 46.46 | 46.97 | 47.60 | 47.27 | |
| 居住地 | 0.62 | 0.49 | 0=农村、1=城镇 | 0.60 | 0.57 | 0.60 | 0.61 | 0.59 | 0.64 | 0.71 | 0.58 | |
| 家庭年收入(对数) | 10.54 | 1.12 | 4.61~16.12 | 10.12 | 10.15 | 10.37 | 10.55 | 10.60 | 10.74 | 10.80 | 11.01 | |
| 受教育年限 | 9.31 | 4.46 | 0~19 | 8.96 | 8.87 | 9.20 | 9.31 | 9.19 | 9.62 | 9.35 | 10.10 | |
| 民族状况 | 0.92 | 0.27 | 0=少数民族、1=汉族 | 0.90 | 0.95 | 0.91 | 0.92 | 0.92 | 0.92 | 0.93 | 0.93 | |
| 宗教信仰 | 0.11 | 0.31 | 0=无、1=有 | 0.13 | 0.11 | 0.14 | 0.10 | 0.10 | 0.10 | 0.10 | 0.07 | |
| 政治面貌 | 0.11 | 0.31 | 0=非共产党员、 1=共产党员 | 0.12 | 0.10 | 0.12 | 0.10 | 0.10 | 0.10 | 0.10 | 0.12 | |
| 健康状况自评 | 3.61 | 1.09 | 1~5 | 3.67 | 2.87 | 3.62 | 3.80 | 3.71 | 3.57 | 3.64 | 3.58 | |
| 工作状况−无工作 | 0.33 | 0.47 | 0=否、1=是 | 0.31 | 0.28 | 0.29 | 0.30 | 0.35 | 0.36 | 0.38 | 0.40 | |
| 工作状况−务农 | 0.23 | 0.42 | 0=否、1=是 | 0.27 | 0.29 | 0.26 | 0.24 | 0.22 | 0.19 | 0.18 | 0.16 | |
| 工作状况−非农工作 | 0.44 | 0.50 | 0=否、1=是 | 0.42 | 0.43 | 0.45 | 0.46 | 0.43 | 0.45 | 0.44 | 0.43 | |
| 婚姻状况 | 0.82 | 0.39 | 0=未婚、1=已婚 | 0.85 | 0.84 | 0.84 | 0.83 | 0.81 | 0.80 | 0.80 | 0.76 | |
| 主观社会经济地位 | 4.21 | 1.69 | 1~10 | 4.04 | 4.12 | 4.17 | 4.36 | 4.32 | 4.14 | 4.26 | 4.31 | |
| 向上流动感知 | 1.00 | 1.39 | −9~9 | 1.16 | 1.21 | 1.12 | 1.06 | 0.95 | 0.88 | 0.78 | 0.91 | |
| 省级变量 | ||||||||||||
| 中等收入群体占比 | 0.48 | 0.08 | 0.28~0.81 | 0.46 | 0.49 | 0.49 | 0.52 | 0.48 | 0.46 | 0.45 | 0.47 | |
| 人均GDP (对数) | 10.70 | 0.50 | 9.46~12.14 | 10.24 | 10.44 | 10.53 | 10.63 | 10.76 | 10.92 | 11.02 | 11.26 | |
| 人均GDP增速 | 0.12 | 0.06 | −0.02~0.29 | 0.18 | 0.19 | 0.10 | 0.10 | 0.05 | 0.10 | 0.10 | 0.14 | |
| 城镇化率 | 0.58 | 0.13 | 0.23~0.90 | 0.51 | 0.54 | 0.54 | 0.56 | 0.59 | 0.62 | 0.63 | 0.65 | |
| 性别比(女性=100) | 104.79 | 3.78 | 95.77~120.43 | 104.29 | 104.99 | 104.85 | 105.23 | 105.56 | 104.44 | 104.72 | 104.11 | |
| 总抚养比 | 36.75 | 7.38 | 19.3~56.7 | 34.92 | 33.73 | 34.33 | 34.51 | 36.02 | 38.14 | 38.97 | 46.65 | |
| 社会保障占比 | 0.13 | 0.03 | 0.06~0.28 | 0.12 | 0.12 | 0.11 | 0.12 | 0.13 | 0.14 | 0.14 | 0.16 | |
| 第三产业占比 | 0.47 | 0.09 | 0.32~0.83 | 0.43 | 0.43 | 0.44 | 0.45 | 0.49 | 0.52 | 0.53 | 0.51 | |
| 私营就业人员占比 | 0.33 | 0.12 | 0.08~0.73 | 0.29 | 0.30 | 0.30 | 0.29 | 0.33 | 0.37 | 0.38 | 0.41 | |
| 高等教育招生比 | 1.08 | 0.57 | 0.38~3.54 | 0.93 | 1.02 | 0.99 | 1.01 | 1.06 | 1.14 | 1.17 | 1.42 | |
| 样本数 | 61751 | / | / | 9189 | 4289 | 9053 | 8653 | 7954 | 9028 | 8886 | 4699 | |
| 省份数 | 217 | / | / | 31 | 26 | 29 | 28 | 28 | 28 | 28 | 19 | |
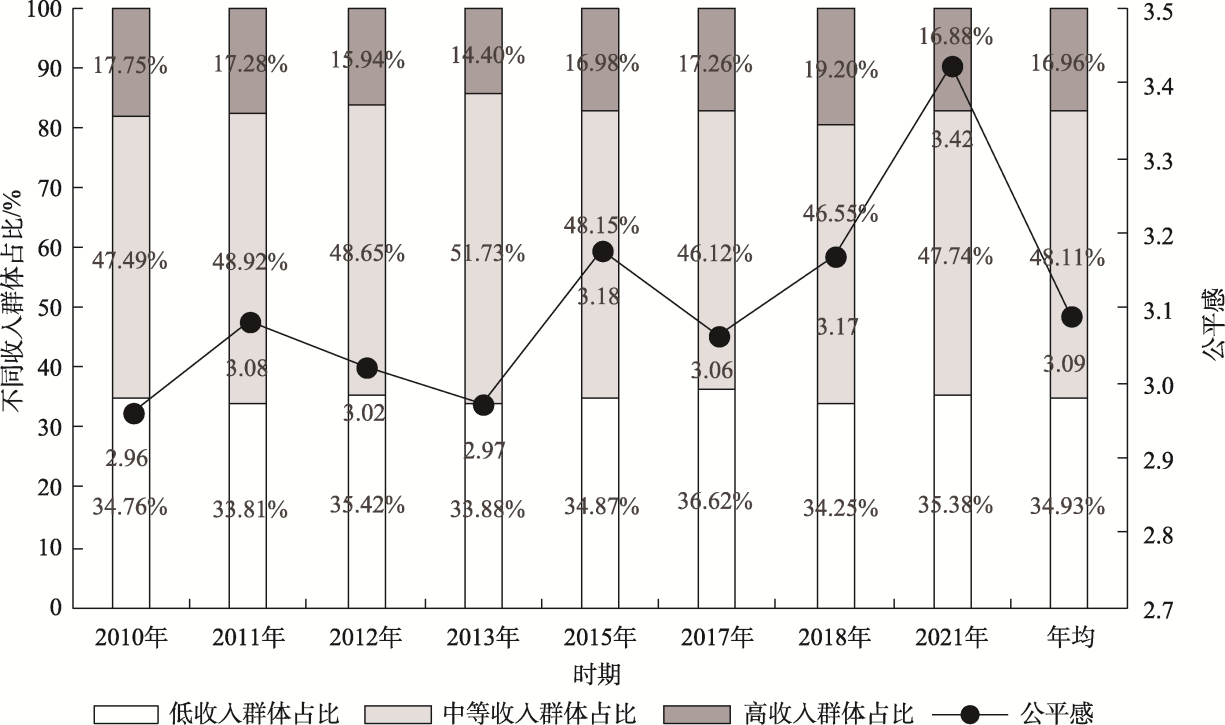
图2 不同收入群体占比与公平感的时期变化(2010~2021年)
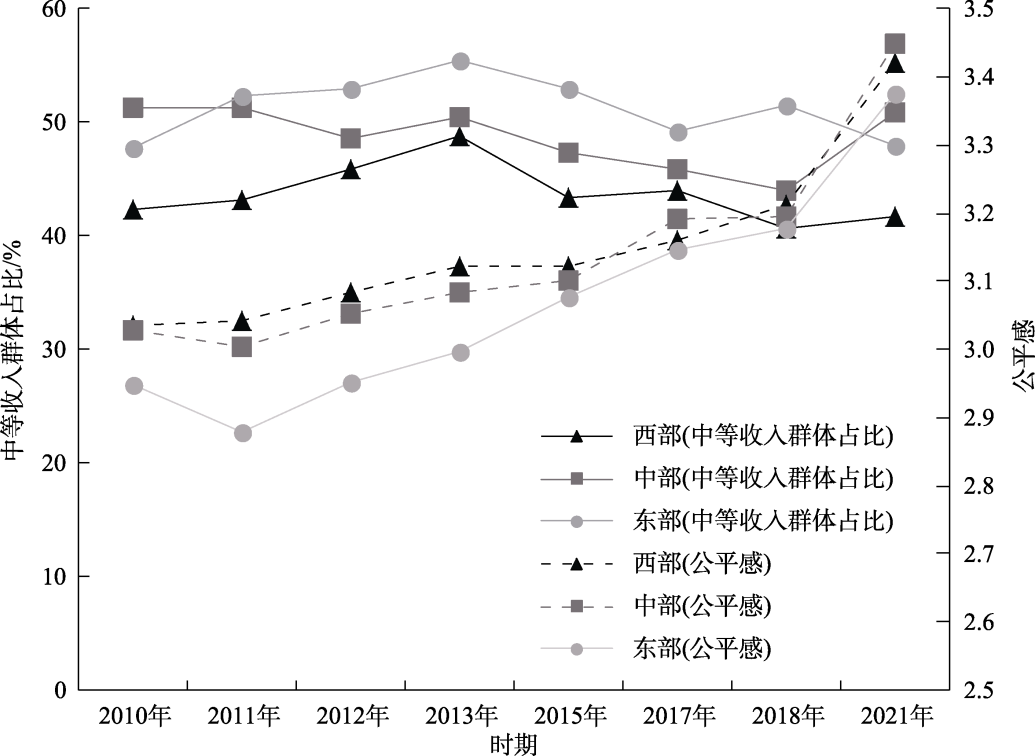
图3 中等收入群体占比与公平感的区域变化(2010~2021年)
| 变量 | 模型1: 因变量−公平感 | 模型2: 因变量−公平感 | 模型3 因变量−主观社会经济地位 | 模型4: 因变量−向上流动感知 |
|---|---|---|---|---|
| 截距 | 0.369*** (0.063) | 0.263*** (0.063) | 0.504*** (0.081) | 2.361*** (0.068) |
| 控制变量 | 已控制 | 已控制 | 已控制 | 已控制 |
| 中等收入群体占比 | 0.435*** (0.077) | 0.403*** (0.076) | 0.316** (0.115) | −0.102 (0.095) |
| 主观社会经济地位 | 0.103*** (0.003) | |||
| 向上流动感知 | 0.023*** (0.003) |
表2 总效应与中介效应的回归分析结果
| 变量 | 模型1: 因变量−公平感 | 模型2: 因变量−公平感 | 模型3 因变量−主观社会经济地位 | 模型4: 因变量−向上流动感知 |
|---|---|---|---|---|
| 截距 | 0.369*** (0.063) | 0.263*** (0.063) | 0.504*** (0.081) | 2.361*** (0.068) |
| 控制变量 | 已控制 | 已控制 | 已控制 | 已控制 |
| 中等收入群体占比 | 0.435*** (0.077) | 0.403*** (0.076) | 0.316** (0.115) | −0.102 (0.095) |
| 主观社会经济地位 | 0.103*** (0.003) | |||
| 向上流动感知 | 0.023*** (0.003) |
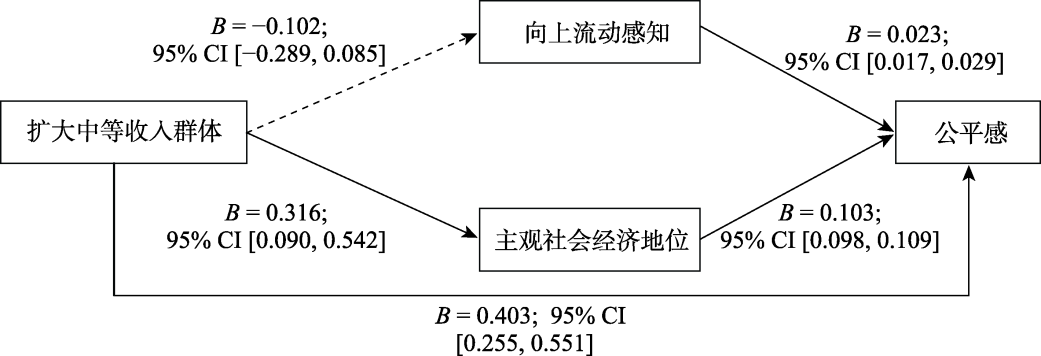
图4 主观社会经济地位与向上流动感知的并行中介效应
| 路径 | 模型1 | 模型2 | 模型3 | 模型4 | 模型5 | 模型6 |
|---|---|---|---|---|---|---|
| 中等收入群体占比×收入→公平感 | 0.352*** (0.058) | 0.215*** (0.063) | ||||
| 中等收入群体占比×人均GDP→公平感 | 0.814*** (0.157) | 0.658*** (0.169) | ||||
| 中等收入群体占比×收入→主观社会经济地位 | 0.951*** (0.088) | 0.863*** (0.096) | ||||
| 中等收入群体占比×收入→向上流动感知 | −0.306*** (0.073) | −0.226** (0.079) | ||||
| 中等收入群体占比×人均GDP→主观社会经济地位 | 1.877*** (0.235) | 1.134*** (0.253) | ||||
| 中等收入群体占比×人均GDP→向上流动感知 | −0.567** (0.195) | −0.207 (0.210) | ||||
| 中等收入群体占比×收入×人均GDP→公平感 | −0.236* (0.117) | |||||
| 中等收入群体占比×收入×人均GDP→主观社会经济地位 | −0.086 (0.178) | |||||
| 中等收入群体占比×收入×人均GDP→向上流动感知 | −0.553*** (0.147) |
表3 收入和经济发展水平调节效应的回归分析结果
| 路径 | 模型1 | 模型2 | 模型3 | 模型4 | 模型5 | 模型6 |
|---|---|---|---|---|---|---|
| 中等收入群体占比×收入→公平感 | 0.352*** (0.058) | 0.215*** (0.063) | ||||
| 中等收入群体占比×人均GDP→公平感 | 0.814*** (0.157) | 0.658*** (0.169) | ||||
| 中等收入群体占比×收入→主观社会经济地位 | 0.951*** (0.088) | 0.863*** (0.096) | ||||
| 中等收入群体占比×收入→向上流动感知 | −0.306*** (0.073) | −0.226** (0.079) | ||||
| 中等收入群体占比×人均GDP→主观社会经济地位 | 1.877*** (0.235) | 1.134*** (0.253) | ||||
| 中等收入群体占比×人均GDP→向上流动感知 | −0.567** (0.195) | −0.207 (0.210) | ||||
| 中等收入群体占比×收入×人均GDP→公平感 | −0.236* (0.117) | |||||
| 中等收入群体占比×收入×人均GDP→主观社会经济地位 | −0.086 (0.178) | |||||
| 中等收入群体占比×收入×人均GDP→向上流动感知 | −0.553*** (0.147) |
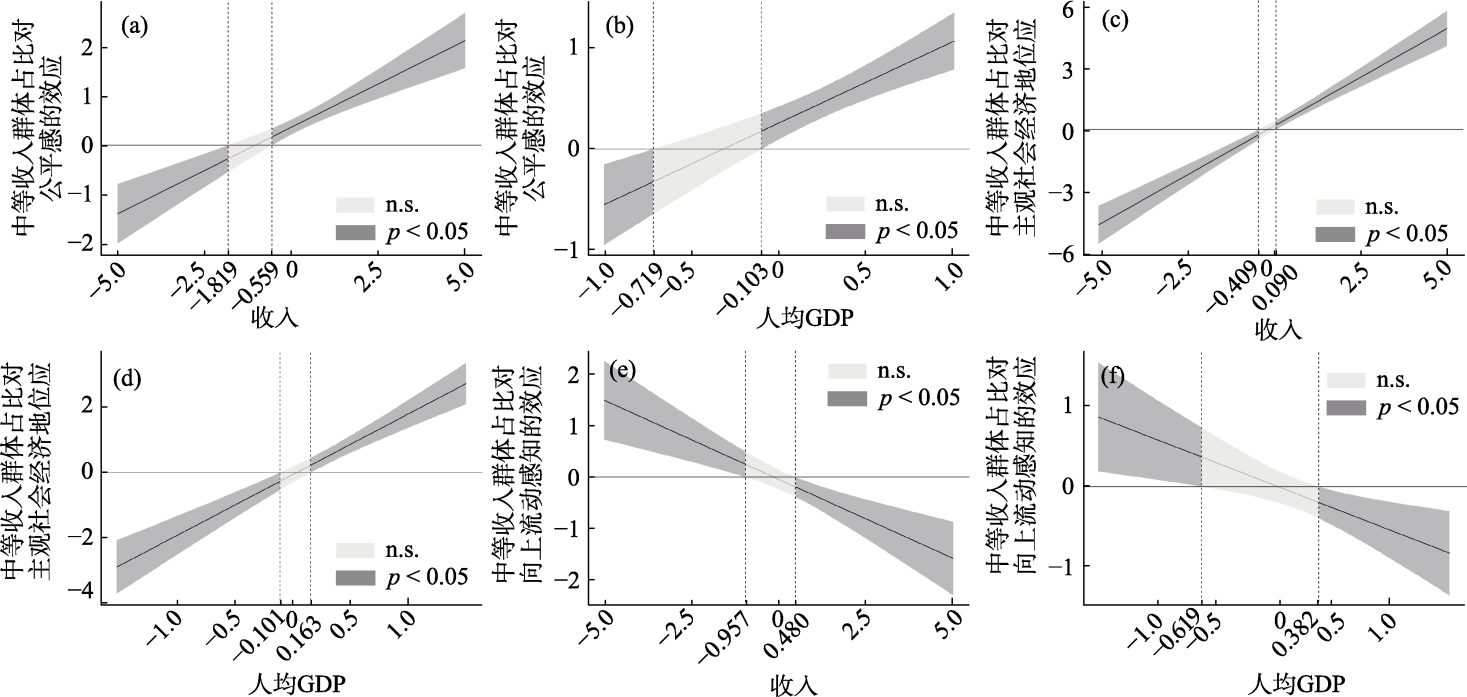
图5 收入与经济发展水平调节作用的Johnson-Neyman图 注:图a和b表示随着收入或人均GDP的提高, 中等收入群体占比对公平感的效应从显著负向变为显著正向; 图c和d表示随着收入或人均GDP的提高, 中等收入群体占比对主观社会经济地位的效应从显著负向变为显著正向; 图e和f表示随着收入或人均GDP的提高, 中等收入群体占比对向上流动感知的效应从显著正向变为显著负向。
| 人均GDP | 收入 | 中等收入群体占比→主观社会经济地位→公平感 | 中等收入群体占比→向上流动感知→公平感 | ||||||
|---|---|---|---|---|---|---|---|---|---|
| B | SE | p | [95% CI] | B | SE | p | [95% CI] | ||
| −1 SD | −0.095 | 0.018 | 0.000 | [−0.124, −0.054] | 0.007 | 0.003 | 0.025 | [0.001, 0.012] | |
| M | 0.013 | 0.012 | 0.265 | [−0.007, 0.039] | −0.001 | 0.002 | 0.754 | [−0.006, 0.004] | |
| +1 SD | 0.126 | 0.016 | 0.000 | [0.096, 0.154] | −0.009 | 0.003 | 0.003 | [−0.014, −0.003] | |
| −1 SD | −0.097 | 0.021 | 0.000 | [−0.137, −0.056] | 0.006 | 0.003 | 0.072 | [0.000, 0.013] | |
| M | 0.005 | 0.011 | 0.667 | [−0.017, 0.027] | −0.001 | 0.002 | 0.804 | [−0.005, 0.003] | |
| +1 SD | 0.111 | 0.013 | 0.000 | [0.086, 0.136] | −0.008 | 0.003 | 0.023 | [−0.015, −0.001] | |
| −1 SD | −1 SD | −0.169 | 0.026 | 0.000 | [−0.225, −0.119] | 0.005 | 0.004 | 0.217 | [−0.003, 0.012] |
| M | −0.059 | 0.022 | 0.006 | [−0.100, −0.020] | 0.006 | 0.004 | 0.163 | [−0.002, 0.014] | |
| +1 SD | 0.049 | 0.026 | 0.058 | [0.001, 0.097] | 0.006 | 0.005 | 0.254 | [−0.004, 0.014] | |
| M | −1 SD | −0.098 | 0.018 | 0.000 | [−0.136, −0.072] | 0.010 | 0.004 | 0.004 | [0.004, 0.017] |
| M | 0.003 | 0.012 | 0.811 | [−0.017, 0.023] | 0.003 | 0.002 | 0.256 | [−0.002, 0.008] | |
| +1 SD | 0.100 | 0.017 | 0.000 | [0.073, 0.137] | −0.004 | 0.003 | 0.171 | [−0.010, 0.001] | |
| +1 SD | −1 SD | −0.030 | 0.027 | 0.277 | [−0.086, 0.017] | 0.015 | 0.006 | 0.011 | [0.005, 0.025] |
| M | 0.067 | 0.017 | 0.000 | [0.036, 0.097] | 0.001 | 0.003 | 0.831 | [−0.005, 0.007] | |
| +1 SD | 0.158 | 0.017 | 0.000 | [0.129, 0.197] | −0.014 | 0.004 | 0.000 | [−0.021, −0.007] | |
表4 收入和经济发展水平对并行中介路径的调节作用结果
| 人均GDP | 收入 | 中等收入群体占比→主观社会经济地位→公平感 | 中等收入群体占比→向上流动感知→公平感 | ||||||
|---|---|---|---|---|---|---|---|---|---|
| B | SE | p | [95% CI] | B | SE | p | [95% CI] | ||
| −1 SD | −0.095 | 0.018 | 0.000 | [−0.124, −0.054] | 0.007 | 0.003 | 0.025 | [0.001, 0.012] | |
| M | 0.013 | 0.012 | 0.265 | [−0.007, 0.039] | −0.001 | 0.002 | 0.754 | [−0.006, 0.004] | |
| +1 SD | 0.126 | 0.016 | 0.000 | [0.096, 0.154] | −0.009 | 0.003 | 0.003 | [−0.014, −0.003] | |
| −1 SD | −0.097 | 0.021 | 0.000 | [−0.137, −0.056] | 0.006 | 0.003 | 0.072 | [0.000, 0.013] | |
| M | 0.005 | 0.011 | 0.667 | [−0.017, 0.027] | −0.001 | 0.002 | 0.804 | [−0.005, 0.003] | |
| +1 SD | 0.111 | 0.013 | 0.000 | [0.086, 0.136] | −0.008 | 0.003 | 0.023 | [−0.015, −0.001] | |
| −1 SD | −1 SD | −0.169 | 0.026 | 0.000 | [−0.225, −0.119] | 0.005 | 0.004 | 0.217 | [−0.003, 0.012] |
| M | −0.059 | 0.022 | 0.006 | [−0.100, −0.020] | 0.006 | 0.004 | 0.163 | [−0.002, 0.014] | |
| +1 SD | 0.049 | 0.026 | 0.058 | [0.001, 0.097] | 0.006 | 0.005 | 0.254 | [−0.004, 0.014] | |
| M | −1 SD | −0.098 | 0.018 | 0.000 | [−0.136, −0.072] | 0.010 | 0.004 | 0.004 | [0.004, 0.017] |
| M | 0.003 | 0.012 | 0.811 | [−0.017, 0.023] | 0.003 | 0.002 | 0.256 | [−0.002, 0.008] | |
| +1 SD | 0.100 | 0.017 | 0.000 | [0.073, 0.137] | −0.004 | 0.003 | 0.171 | [−0.010, 0.001] | |
| +1 SD | −1 SD | −0.030 | 0.027 | 0.277 | [−0.086, 0.017] | 0.015 | 0.006 | 0.011 | [0.005, 0.025] |
| M | 0.067 | 0.017 | 0.000 | [0.036, 0.097] | 0.001 | 0.003 | 0.831 | [−0.005, 0.007] | |
| +1 SD | 0.158 | 0.017 | 0.000 | [0.129, 0.197] | −0.014 | 0.004 | 0.000 | [−0.021, −0.007] | |

图6 收入和经济发展水平双重调节效应的拟合曲面图 注:红色网格面代表中等收入群体占比对公平感的效应, 上方橙色面代表95%置信区间的上限, 下方蓝色面代表95%置信区间的下限, 灰色面代表效应值为0的空间位置。彩图见电子版。
| 效应 | 路径 | 全样本 | 2010~2012年 | 2013~2021年 | 西部 | 中部 | 东部 |
|---|---|---|---|---|---|---|---|
| 总效应 | 中等收入群体 →公平感 | 0.435*** (0.077) | 0.016 (0.179) | 0.347*** (0.099) | −0.089 (0.204) | −0.271 (0.172) | 0.820*** (0.107) |
| 中介效应 | 中等收入群体 →公平感 | 0.403*** (0.076) | −0.017 (0.177) | 0.281** (0.098) | −0.071 (0.203) | −0.203 (0.170) | 0.728*** (0.106) |
| 中等收入群体 →主观社会经济地位 | 0.316** (0.115) | 0.179 (0.254) | 0.665*** (0.152) | −0.007 (0.298) | −0.753** (0.261) | 0.929*** (0.171) | |
| 中等收入群体 →向上流动感知 | −0.102 (0.095) | −0.030 (0.206) | −0.167 (0.124) | −0.008 (0.261) | 0.467* (0.212) | −0.547*** (0.137) | |
| 主观社会经济地位 →公平感 | 0.103*** (0.003) | 0.100*** (0.004) | 0.106*** (0.003) | 0.080*** (0.005) | 0.103*** (0.005) | 0.119*** (0.004) | |
| 向上流动感知 →公平感 | 0.023*** (0.003) | 0.036*** (0.005) | 0.014*** (0.004) | 0.018** (0.006) | 0.020** (0.006) | 0.025*** (0.005) | |
| 总效应的调节效应 | 中等收入群体×收入 →公平感 | 0.352*** (0.058) | 0.432*** (0.109) | 0.312*** (0.070) | 0.206 (0.128) | 0.095 (0.127) | 0.044 (0.107) |
| 中等收入群体×人均GDP →公平感 | 0.814*** (0.157) | 1.545*** (0.445) | 0.743*** (0.224) | 1.620*** (0.560) | 2.045*** (0.527) | −0.708* (0.302) | |
| 中等收入群体×收入×人均GDP →公平感 | −0.236* (0.117) | −0.354 (0.241) | 0.051 (0.168) | −0.358 (0.382) | −0.158 (0.432) | 0.235 (0.269) | |
| 中介效应的调节效应 | 中等收入群体×收入 →主观社会经济地位 | 0.951*** (0.088) | 0.783*** (0.162) | 0.770*** (0.108) | 0.398* (0.195) | 0.644*** (0.194) | 0.880*** (0.165) |
| 中等收入群体×人均GDP →主观社会经济地位 | 1.877*** (0.235) | 0.851 (0.616) | 0.937** (0.347) | 2.966*** (0.806) | −1.065 (0.801) | 0.704 (0.481) | |
| 中等收入群体×收入 →向上流动感知 | −0.306*** (0.073) | −0.127 (0.137) | −0.338*** (0.088) | −0.136 (0.166) | −0.598*** (0.158) | −0.266* (0.134) | |
| 中等收入群体×人均GDP →向上流动感知 | −0.567*** (0.195) | 0.794 (0.485) | −0.731** (0.281) | 1.451* (0.705) | −1.134† (0.081) | −1.698*** (0.386) | |
| 中等收入群体×收入×人均GDP →主观社会经济地位 | −0.086 (0.178) | −0.087 (0.358) | 0.428 (0.261) | 0.646 (0.582) | 0..042 (0.657) | −1.265** (0.418) | |
| 中等收入群体×收入×人均GDP →向上流动感知 | −0.553*** (0.147) | −0.681* (0.303) | −0.164 (0.211) | −0.194 (0.497) | 0.296 (0.535) | −0.548 (0.339) |
表5 时空异质性检验结果与全样本结果的对比
| 效应 | 路径 | 全样本 | 2010~2012年 | 2013~2021年 | 西部 | 中部 | 东部 |
|---|---|---|---|---|---|---|---|
| 总效应 | 中等收入群体 →公平感 | 0.435*** (0.077) | 0.016 (0.179) | 0.347*** (0.099) | −0.089 (0.204) | −0.271 (0.172) | 0.820*** (0.107) |
| 中介效应 | 中等收入群体 →公平感 | 0.403*** (0.076) | −0.017 (0.177) | 0.281** (0.098) | −0.071 (0.203) | −0.203 (0.170) | 0.728*** (0.106) |
| 中等收入群体 →主观社会经济地位 | 0.316** (0.115) | 0.179 (0.254) | 0.665*** (0.152) | −0.007 (0.298) | −0.753** (0.261) | 0.929*** (0.171) | |
| 中等收入群体 →向上流动感知 | −0.102 (0.095) | −0.030 (0.206) | −0.167 (0.124) | −0.008 (0.261) | 0.467* (0.212) | −0.547*** (0.137) | |
| 主观社会经济地位 →公平感 | 0.103*** (0.003) | 0.100*** (0.004) | 0.106*** (0.003) | 0.080*** (0.005) | 0.103*** (0.005) | 0.119*** (0.004) | |
| 向上流动感知 →公平感 | 0.023*** (0.003) | 0.036*** (0.005) | 0.014*** (0.004) | 0.018** (0.006) | 0.020** (0.006) | 0.025*** (0.005) | |
| 总效应的调节效应 | 中等收入群体×收入 →公平感 | 0.352*** (0.058) | 0.432*** (0.109) | 0.312*** (0.070) | 0.206 (0.128) | 0.095 (0.127) | 0.044 (0.107) |
| 中等收入群体×人均GDP →公平感 | 0.814*** (0.157) | 1.545*** (0.445) | 0.743*** (0.224) | 1.620*** (0.560) | 2.045*** (0.527) | −0.708* (0.302) | |
| 中等收入群体×收入×人均GDP →公平感 | −0.236* (0.117) | −0.354 (0.241) | 0.051 (0.168) | −0.358 (0.382) | −0.158 (0.432) | 0.235 (0.269) | |
| 中介效应的调节效应 | 中等收入群体×收入 →主观社会经济地位 | 0.951*** (0.088) | 0.783*** (0.162) | 0.770*** (0.108) | 0.398* (0.195) | 0.644*** (0.194) | 0.880*** (0.165) |
| 中等收入群体×人均GDP →主观社会经济地位 | 1.877*** (0.235) | 0.851 (0.616) | 0.937** (0.347) | 2.966*** (0.806) | −1.065 (0.801) | 0.704 (0.481) | |
| 中等收入群体×收入 →向上流动感知 | −0.306*** (0.073) | −0.127 (0.137) | −0.338*** (0.088) | −0.136 (0.166) | −0.598*** (0.158) | −0.266* (0.134) | |
| 中等收入群体×人均GDP →向上流动感知 | −0.567*** (0.195) | 0.794 (0.485) | −0.731** (0.281) | 1.451* (0.705) | −1.134† (0.081) | −1.698*** (0.386) | |
| 中等收入群体×收入×人均GDP →主观社会经济地位 | −0.086 (0.178) | −0.087 (0.358) | 0.428 (0.261) | 0.646 (0.582) | 0..042 (0.657) | −1.265** (0.418) | |
| 中等收入群体×收入×人均GDP →向上流动感知 | −0.553*** (0.147) | −0.681* (0.303) | −0.164 (0.211) | −0.194 (0.497) | 0.296 (0.535) | −0.548 (0.339) |
| 样本 | 人均GDP | 较低收入群体(−1 SD) | 较高收入群体(+1 SD) | ||
|---|---|---|---|---|---|
| 主观社会经济地位 | 向上 流动 感知 | 主观社会经济地位 | 向上 流动 感知 | ||
| 全样本 | 较低(−1 SD) | ↓ | ↑ | ||
| 较高(+1 SD) | ↑ | ↑ | ↓ | ||
| 2010~2012年 | 较低(−1 SD) | ||||
| 较高(+1 SD) | ↑ | ||||
| 2013~2021年 | 较低(−1 SD) | ↑ | |||
| 较高(+1 SD) | ↑ | ↓ | |||
| 西部 | 较低(−1 SD) | ↓ | ↓ | ||
| 较高(+1 SD) | ↑ | ||||
| 中部 | 较低(−1 SD) | ↑ | |||
| 较高(+1 SD) | ↓ | ↑ | |||
| 东部 | 较低(−1 SD) | ↑ | |||
| 较高(+1 SD) | ↑ | ↓ | |||
表6 并行中介效应的调节效应结果总结
| 样本 | 人均GDP | 较低收入群体(−1 SD) | 较高收入群体(+1 SD) | ||
|---|---|---|---|---|---|
| 主观社会经济地位 | 向上 流动 感知 | 主观社会经济地位 | 向上 流动 感知 | ||
| 全样本 | 较低(−1 SD) | ↓ | ↑ | ||
| 较高(+1 SD) | ↑ | ↑ | ↓ | ||
| 2010~2012年 | 较低(−1 SD) | ||||
| 较高(+1 SD) | ↑ | ||||
| 2013~2021年 | 较低(−1 SD) | ↑ | |||
| 较高(+1 SD) | ↑ | ↓ | |||
| 西部 | 较低(−1 SD) | ↓ | ↓ | ||
| 较高(+1 SD) | ↑ | ||||
| 中部 | 较低(−1 SD) | ↑ | |||
| 较高(+1 SD) | ↓ | ↑ | |||
| 东部 | 较低(−1 SD) | ↑ | |||
| 较高(+1 SD) | ↑ | ↓ | |||
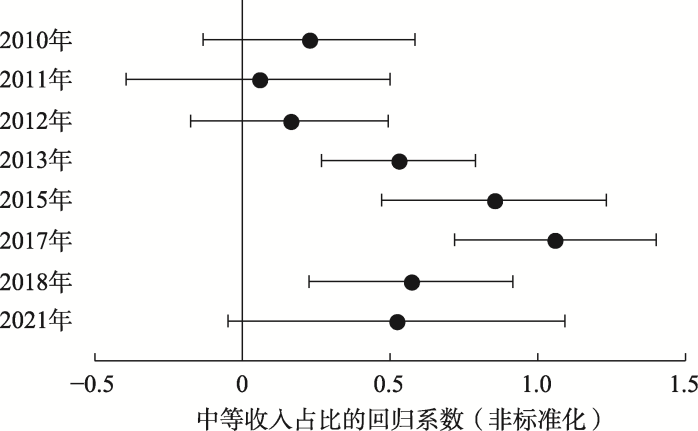
附图1 不同时期中等收入群体占比对公平感的回归系数
| 子样本 | 人均GDP | 收入 | 中介变量:主观社会经济地位 | 中介变量:向上流动感知 | ||||||
|---|---|---|---|---|---|---|---|---|---|---|
| B | SE | p | [95% CI] | B | SE | p | [95% CI] | |||
| 2010~2012年 | −1 SD | −1 SD | −0.088 | 0.050 | 0.079 | [−0.189, 0.009] | −0.025 | 0.015 | 0.107 | [−0.055, 0.004] |
| +1 SD | 0.067 | 0.054 | 0.219 | [−0.040, 0.180] | −0.014 | 0.017 | 0.412 | [−0.043, 0.021] | ||
| +1 SD | −1 SD | −0.070 | 0.045 | 0.117 | [−0.156, 0.008] | 0.030 | 0.016 | 0.070 | [−0.002, 0.062] | |
| +1 SD | 0.067 | 0.032 | 0.038 | [ 0.013, 0.126] | 0.000 | 0.010 | 0.999 | [−0.021, 0.015] | ||
| 2013~2021年 | −1 SD | −1 SD | −0.022 | 0.027 | 0.425 | [−0.069, 0.038] | 0.006 | 0.004 | 0.105 | [−0.002, 0.015] |
| +1 SD | 0.109 | 0.034 | 0.001 | [0.050, 0.175] | −0.002 | 0.004 | 0.644 | [−0.010, 0.005] | ||
| +1 SD | −1 SD | −0.053 | 0.037 | 0.148 | [−0.127, 0.015] | 0.003 | 0.004 | 0.442 | [−0.004, 0.012] | |
| +1 SD | 0.172 | 0.024 | <0.001 | [0.127, 0.217] | −0.010 | 0.004 | 0.014 | [−0.018, −0.004] | ||
| 西部 | −1 SD | −1 SD | −0.105 | 0.040 | 0.009 | [−0.184, −0.031] | −0.007 | 0.008 | 0.408 | [−0.021, 0.007] |
| +1 SD | −0.091 | 0.041 | 0.026 | [−0.167, −0.014] | −0.011 | 0.010 | 0.268 | [−0.031, 0.005] | ||
| +1 SD | −1 SD | 0.066 | 0.047 | 0.157 | [−0.021, 0.152] | 0.019 | 0.012 | 0.119 | [−0.004, 0.043] | |
| +1 SD | 0.172 | 0.053 | 0.001 | [ 0.066, 0.276] | 0.008 | 0.010 | 0.410 | [−0.008, 0.029] | ||
| 中部 | −1 SD | −1 SD | −0.063 | 0.054 | 0.238 | [−0.163, 0.047] | 0.033 | 0.012 | 0.008 | [ 0.014, 0.057] |
| +1 SD | 0.009 | 0.058 | 0.884 | [−0.105, 0.108] | −0.001 | 0.010 | 0.960 | [−0.020, 0.019] | ||
| +1 SD | −1 SD | −0.115 | 0.044 | 0.009 | [−0.202, −0.038] | 0.022 | 0.010 | 0.031 | [ 0.007, 0.043] | |
| +1 SD | −0.035 | 0.037 | 0.348 | [−0.103, 0.036] | −0.002 | 0.005 | 0.700 | [−0.013, 0.007] | ||
| 东部 | −1 SD | −1 SD | −0.058 | 0.041 | 0.153 | [−0.140, 0.017] | 0.002 | 0.007 | 0.730 | [−0.011, 0.018] |
| +1 SD | 0.278 | 0.054 | <0.001 | [0.185, 0.407] | 0.010 | 0.009 | 0.264 | [−0.006, 0.028] | ||
| +1 SD | −1 SD | 0.099 | 0.052 | 0.059 | [−0.015, 0.213] | −0.018 | 0.010 | 0.058 | [−0.037, 0.001] | |
| +1 SD | 0.154 | 0.038 | <0.001 | [0.080, 0.218] | −0.039 | 0.010 | <0.001 | [−0.058, −0.019] | ||
附表1 并行中介效应的调节效应的时空异质性
| 子样本 | 人均GDP | 收入 | 中介变量:主观社会经济地位 | 中介变量:向上流动感知 | ||||||
|---|---|---|---|---|---|---|---|---|---|---|
| B | SE | p | [95% CI] | B | SE | p | [95% CI] | |||
| 2010~2012年 | −1 SD | −1 SD | −0.088 | 0.050 | 0.079 | [−0.189, 0.009] | −0.025 | 0.015 | 0.107 | [−0.055, 0.004] |
| +1 SD | 0.067 | 0.054 | 0.219 | [−0.040, 0.180] | −0.014 | 0.017 | 0.412 | [−0.043, 0.021] | ||
| +1 SD | −1 SD | −0.070 | 0.045 | 0.117 | [−0.156, 0.008] | 0.030 | 0.016 | 0.070 | [−0.002, 0.062] | |
| +1 SD | 0.067 | 0.032 | 0.038 | [ 0.013, 0.126] | 0.000 | 0.010 | 0.999 | [−0.021, 0.015] | ||
| 2013~2021年 | −1 SD | −1 SD | −0.022 | 0.027 | 0.425 | [−0.069, 0.038] | 0.006 | 0.004 | 0.105 | [−0.002, 0.015] |
| +1 SD | 0.109 | 0.034 | 0.001 | [0.050, 0.175] | −0.002 | 0.004 | 0.644 | [−0.010, 0.005] | ||
| +1 SD | −1 SD | −0.053 | 0.037 | 0.148 | [−0.127, 0.015] | 0.003 | 0.004 | 0.442 | [−0.004, 0.012] | |
| +1 SD | 0.172 | 0.024 | <0.001 | [0.127, 0.217] | −0.010 | 0.004 | 0.014 | [−0.018, −0.004] | ||
| 西部 | −1 SD | −1 SD | −0.105 | 0.040 | 0.009 | [−0.184, −0.031] | −0.007 | 0.008 | 0.408 | [−0.021, 0.007] |
| +1 SD | −0.091 | 0.041 | 0.026 | [−0.167, −0.014] | −0.011 | 0.010 | 0.268 | [−0.031, 0.005] | ||
| +1 SD | −1 SD | 0.066 | 0.047 | 0.157 | [−0.021, 0.152] | 0.019 | 0.012 | 0.119 | [−0.004, 0.043] | |
| +1 SD | 0.172 | 0.053 | 0.001 | [ 0.066, 0.276] | 0.008 | 0.010 | 0.410 | [−0.008, 0.029] | ||
| 中部 | −1 SD | −1 SD | −0.063 | 0.054 | 0.238 | [−0.163, 0.047] | 0.033 | 0.012 | 0.008 | [ 0.014, 0.057] |
| +1 SD | 0.009 | 0.058 | 0.884 | [−0.105, 0.108] | −0.001 | 0.010 | 0.960 | [−0.020, 0.019] | ||
| +1 SD | −1 SD | −0.115 | 0.044 | 0.009 | [−0.202, −0.038] | 0.022 | 0.010 | 0.031 | [ 0.007, 0.043] | |
| +1 SD | −0.035 | 0.037 | 0.348 | [−0.103, 0.036] | −0.002 | 0.005 | 0.700 | [−0.013, 0.007] | ||
| 东部 | −1 SD | −1 SD | −0.058 | 0.041 | 0.153 | [−0.140, 0.017] | 0.002 | 0.007 | 0.730 | [−0.011, 0.018] |
| +1 SD | 0.278 | 0.054 | <0.001 | [0.185, 0.407] | 0.010 | 0.009 | 0.264 | [−0.006, 0.028] | ||
| +1 SD | −1 SD | 0.099 | 0.052 | 0.059 | [−0.015, 0.213] | −0.018 | 0.010 | 0.058 | [−0.037, 0.001] | |
| +1 SD | 0.154 | 0.038 | <0.001 | [0.080, 0.218] | −0.039 | 0.010 | <0.001 | [−0.058, −0.019] | ||
| [1] | Chen Z. S. & Chen T. F. (2024). The measurement and trend analysis of the scale of China’s middle-income group. Changbai Journal, (4), 1-24. |
| [陈宗胜, 陈涛峰. (2024). 中国中等收入群体规模测度与变动趋势分析. 长白学刊, (4), 1-24.] | |
| [2] |
Diemer M. A., Mistry R. S., Wadsworth M. E., López I., & Reimers F. (2013). Best practices in conceptualizing and measuring social class in psychological research. Analyses of Social Issues and Public Policy, 13(1), 77-113.
doi: 10.1111/asap.2013.13.issue-1 URL |
| [3] | Gao W. J. (2018). The model of the development of subjective social status based on social comparison. Journal of Social Sciences of Hunan Normal University, (4), 90-100. |
| [高文珺. (2018). 基于社会比较的主观社会阶层过程模型. 湖南师范大学社会科学学报, (4), 90-100.] | |
| [4] | Gao W. J. (2020). Research on the current situation of social justice and its influencing factors. Journal of Guangxi Normal University: Philosophy and Social Sciences Edition, 56(5), 28-44. |
| [高文珺. (2020). 社会公平感现状及影响因素研究. 广西师范大学学报(哲学社会科学版), 56(5), 28-44.] | |
| [5] | Han K. (2022). China's model of common prosperity. Administration Reform, (4), 4-8. |
| [韩康. (2022). 共同富裕的中国模式. 行政管理改革, (4), 4-8.] | |
| [6] | Hayes A. F. (2013). Introduction to mediation, moderation and conditional process analysis. Guilford Press. |
| [7] |
Hirschman A. O., & Rothschild M. (1973). The changing tolerance for income inequality in the course of economic development. The Quarterly Journal of Economics, 87(4), 544-566.
doi: 10.2307/1882024 URL |
| [8] | Hoff E., & Laursen B. (2019). Socioeconomic status and parenting. In M. H. Bornstein (Ed.), Handbook of parenting (pp. 421-447). Routledge. |
| [9] | Huai M. T. (2009). Views of Chinese citizens on current inequalities.? Sociological Research, (1), 96-120. |
| [怀默霆. (2009). 中国民众如何看待当前的社会不平等. 社会学研究, (1), 96-120.] | |
| [10] | Huang Y. L. (2022). Social cognition change of middle-income group in the transitional period:Tendency and impact. Journal of Huazhong University of Science and Technology (Social Science Edition), 36(4), 102-111. |
| [黄永亮. (2022). 转型时期中等收入群体的社会认知变迁:趋势和影响. 华中科技大学学报(社会科学版), 36(4), 102-111.] | |
| [11] |
Kelley J., & Evans M. D. R. (2017). Societal inequality and individual subjective well-being: Results from 68 societies and over 200,000 individuals, 1981-2008. Social Science Research, 62, 1-23.
doi: S0049-089X(16)30221-6 pmid: 28126092 |
| [12] | Kuznets S. (1955). Economic growth and income inequality. The American Economic Review, 45(1), 1-28. |
| [13] | Li C. L. (2022). China's middle income group in the new stage of common prosperity:Growth status and policies design. Journal of Beijing University (Social Sciences Edition), 22(2), 38-48. |
| [李春玲. (2022). 迈向共同富裕阶段:我国中等收入群体成长和政策设计. 北京工业大学学报(社会科学版), 22(2), 38-48.] | |
| [14] | Li J. C., & Ren Z. Y. (2023). Research on the definition criteria and reasonable scale of middle-income groups in the context of common prosperity. Statistical and Information Forum, 38(2), 16-28. |
| [李金昌, 任志远. (2023). 共同富裕背景下中等收入群体的界定标准与合理规模研究. 统计与信息论坛, 38(2), 16-28.] | |
| [15] | Li J. C., Ren Z. Y., & Chen Y. Z. (2023). The logic and path of expanding middle-income group: Quantitative analysis based on international experience and Chinese practice. Statistical Research, 40(7), 3-16. |
| [李金昌, 任志远, 陈宜治. (2023). 扩大中等收入群体的内在逻辑与路径选择——基于国际经验与中国实践的定量分析. 统计研究, 40(7), 3-16.] | |
| [16] | Li P. L. (2020). Trends and hot issues in social stratification in China. In D. Y. Hong & S. J. Liu (Eds.), Sociology and Chinese social research: Record of Zheng Hangseng sociology lectures (Volume 1). Renmin University of China Press. |
| [李培林. (2020). 我国社会分层的变动趋势和热点问题. 见洪大用, 刘少杰(编), 社会学与中国社会研究——郑杭生社会学大讲堂实录(第一辑). 中国人民大学出版社.] | |
| [17] | Li P. L., Li Q., Xie L. Z., Zhang Y., & Li L. (2019). 40 years of reform and opening-up and social development in China. Financial Minds, 4(1), 33-63. |
| [李培林, 李强, 谢立中, 张翼, 李林. (2019). 改革开放40年与中国社会发展. 财经智库, 4(1), 33-63.] | |
| [18] | Li W. (2019). The sense of social fairness: Structure and trends of change (2006-2017). Journal of Huazhong University of Science and Technology (Social Science Edition), 33(6), 100-121. |
| [李炜. (2019). 社会公平感:结构与变动趋势(2006-2017年). 华中科技大学学报(社会科学版), 33(6), 100-121.] | |
| [19] | Liu N. (2013). International lessons from the middle-income trap and pathways for China’s advancement. Practice in Foreign Economic Relations and Trade, (9), 29-31. |
| [刘娜. (2013). 中等收入陷阱的国际借鉴及我国的提升路径. 对外经贸实务, (9), 29-31.] | |
| [20] | Liu S. J., Wang Z. H., Jiang S. J., & Zhao J. X. (2022). A study on the potential, timeframe and pathways of realizing the doubling of middle-income groups. Management World, (8), 54-66. |
| [刘世锦, 王子豪, 姜淑佳, 赵建翔. (2022). 实现中等收入群体倍增的潜力、时间与路径研究. 管理世界, (8), 54-66.] | |
| [21] |
Ng S. H., & Allen M. W. (2005). Perception of economic distributive justice: Exploring leading theories. Social Behavior and Personality, 33(5), 435-454.
doi: 10.2224/sbp.2005.33.5.435 URL |
| [22] | OECD. (2019). Society at a glance 2019: OECD social indicators. OECD Publishing. |
| [23] | Piketty T. (2014). Capital in the twenty-first century. CITIC. |
| [托马斯·皮凯蒂. (2014). 21世纪资本论. 中信出版社.] | |
| [24] |
Reyes G., & Gasparini L. (2022). Are fairness perceptions shaped by income inequality? Evidence from Latin America. Journal of Economic Inequality, 20(4), 893-913.
doi: 10.1007/s10888-022-09526-w |
| [25] | Su H. N. (2003). Strive to increase the proportion of middle- income population in China. Macroeconomics, (4), 12-14. |
| [苏海南. (2003). 努力扩大我国的中等收入者比重. 宏观经济研究, (4), 12-14.] | |
| [26] | Sun B. C. (2024). Towards common prosperity: A research on quantitative effect and influencing factors of expanding middle-income groups. Journal of Statistics and Information, 39(12), 112-125. |
| [孙伯驰. (2024). 走向共同富裕: 中国“扩中”量化效果及影响因素研究. 统计与信息论坛, 39(12), 112-125.] | |
| [27] | Trump K.-S. (2020). When and why is economic inequality seen as fair. Political Ideologies, 34, 46-51. |
| [28] | Wei Q. G., Zhang Y., & Li H. L. (2014). “The dual impression” in the development process: A study on the perception of income inequality among urban residents in China. Journal of Social Development, (3), 1-32. |
| [魏钦恭, 张彦, 李汉林. (2014). 发展进程中的“双重印象”:中国城市居民的收入不公平感研究. 社会发展研究, (3), 1-32.] | |
| [29] | Whyte M. K. (2010). Myth of the social volcano: Perceptions of inequality and distributive injustice in contemporary China. Stanford University Press. |
| [30] |
Wood J. V. (1996). What is social comparison and how should we study it? Personality and Social Psychology Bulletin, 22(5), 520-537.
doi: 10.1177/0146167296225009 URL |
| [31] | Xu Q., He G. Y., & Hu J. (2020). Marketization and change of perceptions about distributive justice in China: 2005-2015. Society, 40(3), 88-116. |
| [许琪, 贺光烨, 胡洁. (2020). 市场化与中国民众社会公平感的变迁:2005-2015. 社会, 40(3), 88-116.] | |
| [32] | Yang C. (2019). The identification and social attitude of middle class in China. Beijing Social Sciences, (4), 91-104. |
| [杨灿. (2019). 中等收入者主观认同感与社会态度研究. 北京社会科学, (4), 91-104.] | |
| [33] | Yang Y., Gu Y., & Wan H. (2016). Expanding the middle-income group to build a well-off society in an all-round way. Macroeconomic Management, (9), 11-14. |
| [杨宜勇, 顾严, 万海远. (2016). 扩大中等收入群体全面建成小康社会. 宏观经济管理, (9), 11-14.] | |
| [34] | Zhang W. H., Liu F., & Xiang J. (2023). Research on the public's subjective status identity in China under the background of common prosperity. Sociological Research, (4), 27-49. |
| [张文宏, 刘飞, 项军. (2023). 共同富裕背景下中国公众主观地位认同研究. 社会学研究, (4), 27-49.] | |
| [35] | Zhang Y. (2024). For a fair world: The sense of fairness among the Chinese people from the perspective of social change. China Social Sciences Press. |
| [张衍. (2024). 天下为公:社会变迁视角下中国民众的公平感. 中国社会科学出版社.] | |
| [36] | Zhang Y., & Wang J. X. (2023). Re-exploring the issue of misalignment between subjective and objective class: From identity to class. Journal of Jiangsu Administrative Institute, (1), 66-76. |
| [张衍, 王俊秀. (2023). 主客观阶层不对应问题再探讨:从身份到阶层. 江苏行政学院学报, (1), 66-76.] | |
| [37] | Zheng C., & Sun H. (2016). Income, expectations of social status mobility, and public perception of social equity: An empirical test using CGSS (2010, 2013) data. Western Forum, 26(5), 100-108. |
| [郑畅, 孙浩. (2016). 收入、社会地位流动预期与民众社会公平认知——采用CGSS (2010、2013)数据的实证检验. 西部论坛, 26(5), 100-108.] | |
| [38] | Zhou Y., Xu B. Y., Shi J. M., & Lin X. Y. (2023). Authoritarian parenting and physical bullying: The mediation effect of aggression attitudes and the dual moderation effects of low self-control and teacher support. Journal of Psychological Science, 46(5), 1228-1236. |
| [周由, 许博洋, 史敬敏, 蔺秀云. (2023). 专制教养与校园身体欺凌:攻击态度的中介作用与低自我控制和教师漠视的双重调节作用. 心理科学, 46(5), 1228-1236.] | |
| [39] | Zhu B. (2024). The growth mechanism and regional differences of the middle income group in China. Zhejiang Social Sciences, (4), 80-92. |
| [朱斌. (2024). 我国中等收入群体的成长机制及其区域差异. 浙江社会科学, (4), 80-92.] | |
| [40] | Zou Y. C. (2023). The power of the times: A trend analysis of the class identity bias of the middle-income group in china. Sociological Research, 38(3), 180-202. |
| [邹宇春. (2023). 时代之力:我国中等收入群体阶层认同偏差的趋势分析. 社会学研究, 38(3), 180-202.] |
| [1] | 江程铭, 杨小娟, 余淑琦, 陈李娜, 马家涛. 工作场所募捐: 上级与同事捐赠额信息对员工捐赠额的影响[J]. 心理学报, 2026, 58(2): 279-291. |
| [2] | 贾建锋, 刘伟鹏, 段锦云, 赵洋. 妒忌还是钦佩: 员工对同事被授权的心理与行为反应[J]. 心理学报, 2024, 56(10): 1401-1416. |
| [3] | 栾墨, 李俊澎. 失败的游戏玩家, 成功的广告:展示失败体验会令观察者更想尝试吗?[J]. 心理学报, 2022, 54(12): 1562-1578. |
| [4] | 宫秀双, 张红红. “别人家的孩子”vs.平庸的自己:社会比较对独特性寻求行为的影响[J]. 心理学报, 2020, 52(5): 645-658. |
| [5] | 丁瑛, 钟嘉琦. 社会拥挤对自我提升类产品偏好的影响[J]. 心理学报, 2020, 52(2): 216-228. |
| [6] | 王天鸿, 陈宇琦, 陆静怡. 差距知觉的泛化效应:我和你之间的差距有多大?[J]. 心理学报, 2020, 52(11): 1327-1339. |
| [7] | 连帅磊, 孙晓军, 牛更枫, 周宗奎. 社交网站中的上行社会比较与抑郁的关系: 一个有调节的中介模型及性别差异[J]. 心理学报, 2017, 49(7): 941-952. |
| [8] | 刘文, 张雪, 张玉, 俞睿玮. 4~8岁儿童公平认知与行为差距: 社会比较的作用[J]. 心理学报, 2017, 49(12): 1504-1512. |
| [9] | 刘庆奇;牛更枫;范翠英;周宗奎. 被动性社交网站使用与自尊和自我概念清晰性:有调节的中介模型[J]. 心理学报, 2017, 49(1): 60-71. |
| [10] | 黄婷婷; 刘莉倩;王大华;张文海. 经济地位和计量地位:社会地位比较对主观幸福感的影响及其年龄差异[J]. 心理学报, 2016, 48(9): 1163-1174. |
| [11] | 胡小勇;郭永玉;李静;杨沈龙. 社会公平感对不同阶层目标达成的影响及其过程[J]. 心理学报, 2016, 48(3): 271-289. |
| [12] | 牛更枫;孙晓军;周宗奎;孔繁昌;田媛. 基于QQ空间的社交网站使用对青少年抑郁的影响:上行社会比较和自尊的序列中介作用[J]. 心理学报, 2016, 48(10): 1282-1291. |
| [13] | 郑晓莹;彭泗清;彭璐珞. “达”则兼济天下?社会比较对亲社会行为的影响及心理机制[J]. 心理学报, 2015, 47(2): 243-250. |
| [14] | 窦炜;曲璐璐;曲琛. 社会比较对合作任务结果评价的影响:来自ERP的证据[J]. 心理学报, 2014, 46(3): 405-414. |
| 阅读次数 | ||||||
|
全文 |
|
|||||
|
摘要 |
|
|||||