ISSN 0439-755X
CN 11-1911/B
主办:中国心理学会
中国科学院心理研究所
出版:科学出版社
CN 11-1911/B
主办:中国心理学会
中国科学院心理研究所
出版:科学出版社
心理学报 ›› 2024, Vol. 56 ›› Issue (1): 124-138.doi: 10.3724/SP.J.1041.2024.00124 cstr: 32110.14.2024.00124
刘玥1, 徐雷1, 刘红云2,3( ), 韩雨婷4, 游晓锋5, 万志林1
收稿日期:2023-01-04
发布日期:2023-11-23
出版日期:2024-01-25
通讯作者:
刘红云, E-mail: hyliu@bnu.edu.cn基金资助:
LIU Yue1, XU Lei1, LIU Hongyun2,3(), HAN Yuting4, YOU Xiaofeng5, WAN Zhilin1
Received:2023-01-04
Online:2023-11-23
Published:2024-01-25
摘要:
线性混合效应模型在分析具有嵌套结构的心理学实验数据时具有明显优势。本文提出了置信区间宽度等高线图用于该模型的样本量规划。通过等高线图, 确定同时符合检验力、效应量准确性以及置信区间宽度要求的被试量和试次数。结合关注被试内实验效应和被试变量调节效应的两类典型模型, 通过两个模拟研究, 采用基于蒙特卡洛模拟方法, 探索效应量、随机效应大小和被试变量类型对置信区间宽度等高线图及样本量规划结果的影响。
中图分类号:
刘玥, 徐雷, 刘红云, 韩雨婷, 游晓锋, 万志林. (2024). 置信区间宽度等高线图在线性混合效应模型样本量规划中的应用. 心理学报, 56(1), 124-138.
LIU Yue, XU Lei, LIU Hongyun, HAN Yuting, YOU Xiaofeng, WAN Zhilin. (2024). Confidence interval width contours: Sample size planning for linear mixed-effects models. Acta Psychologica Sinica, 56(1), 124-138.
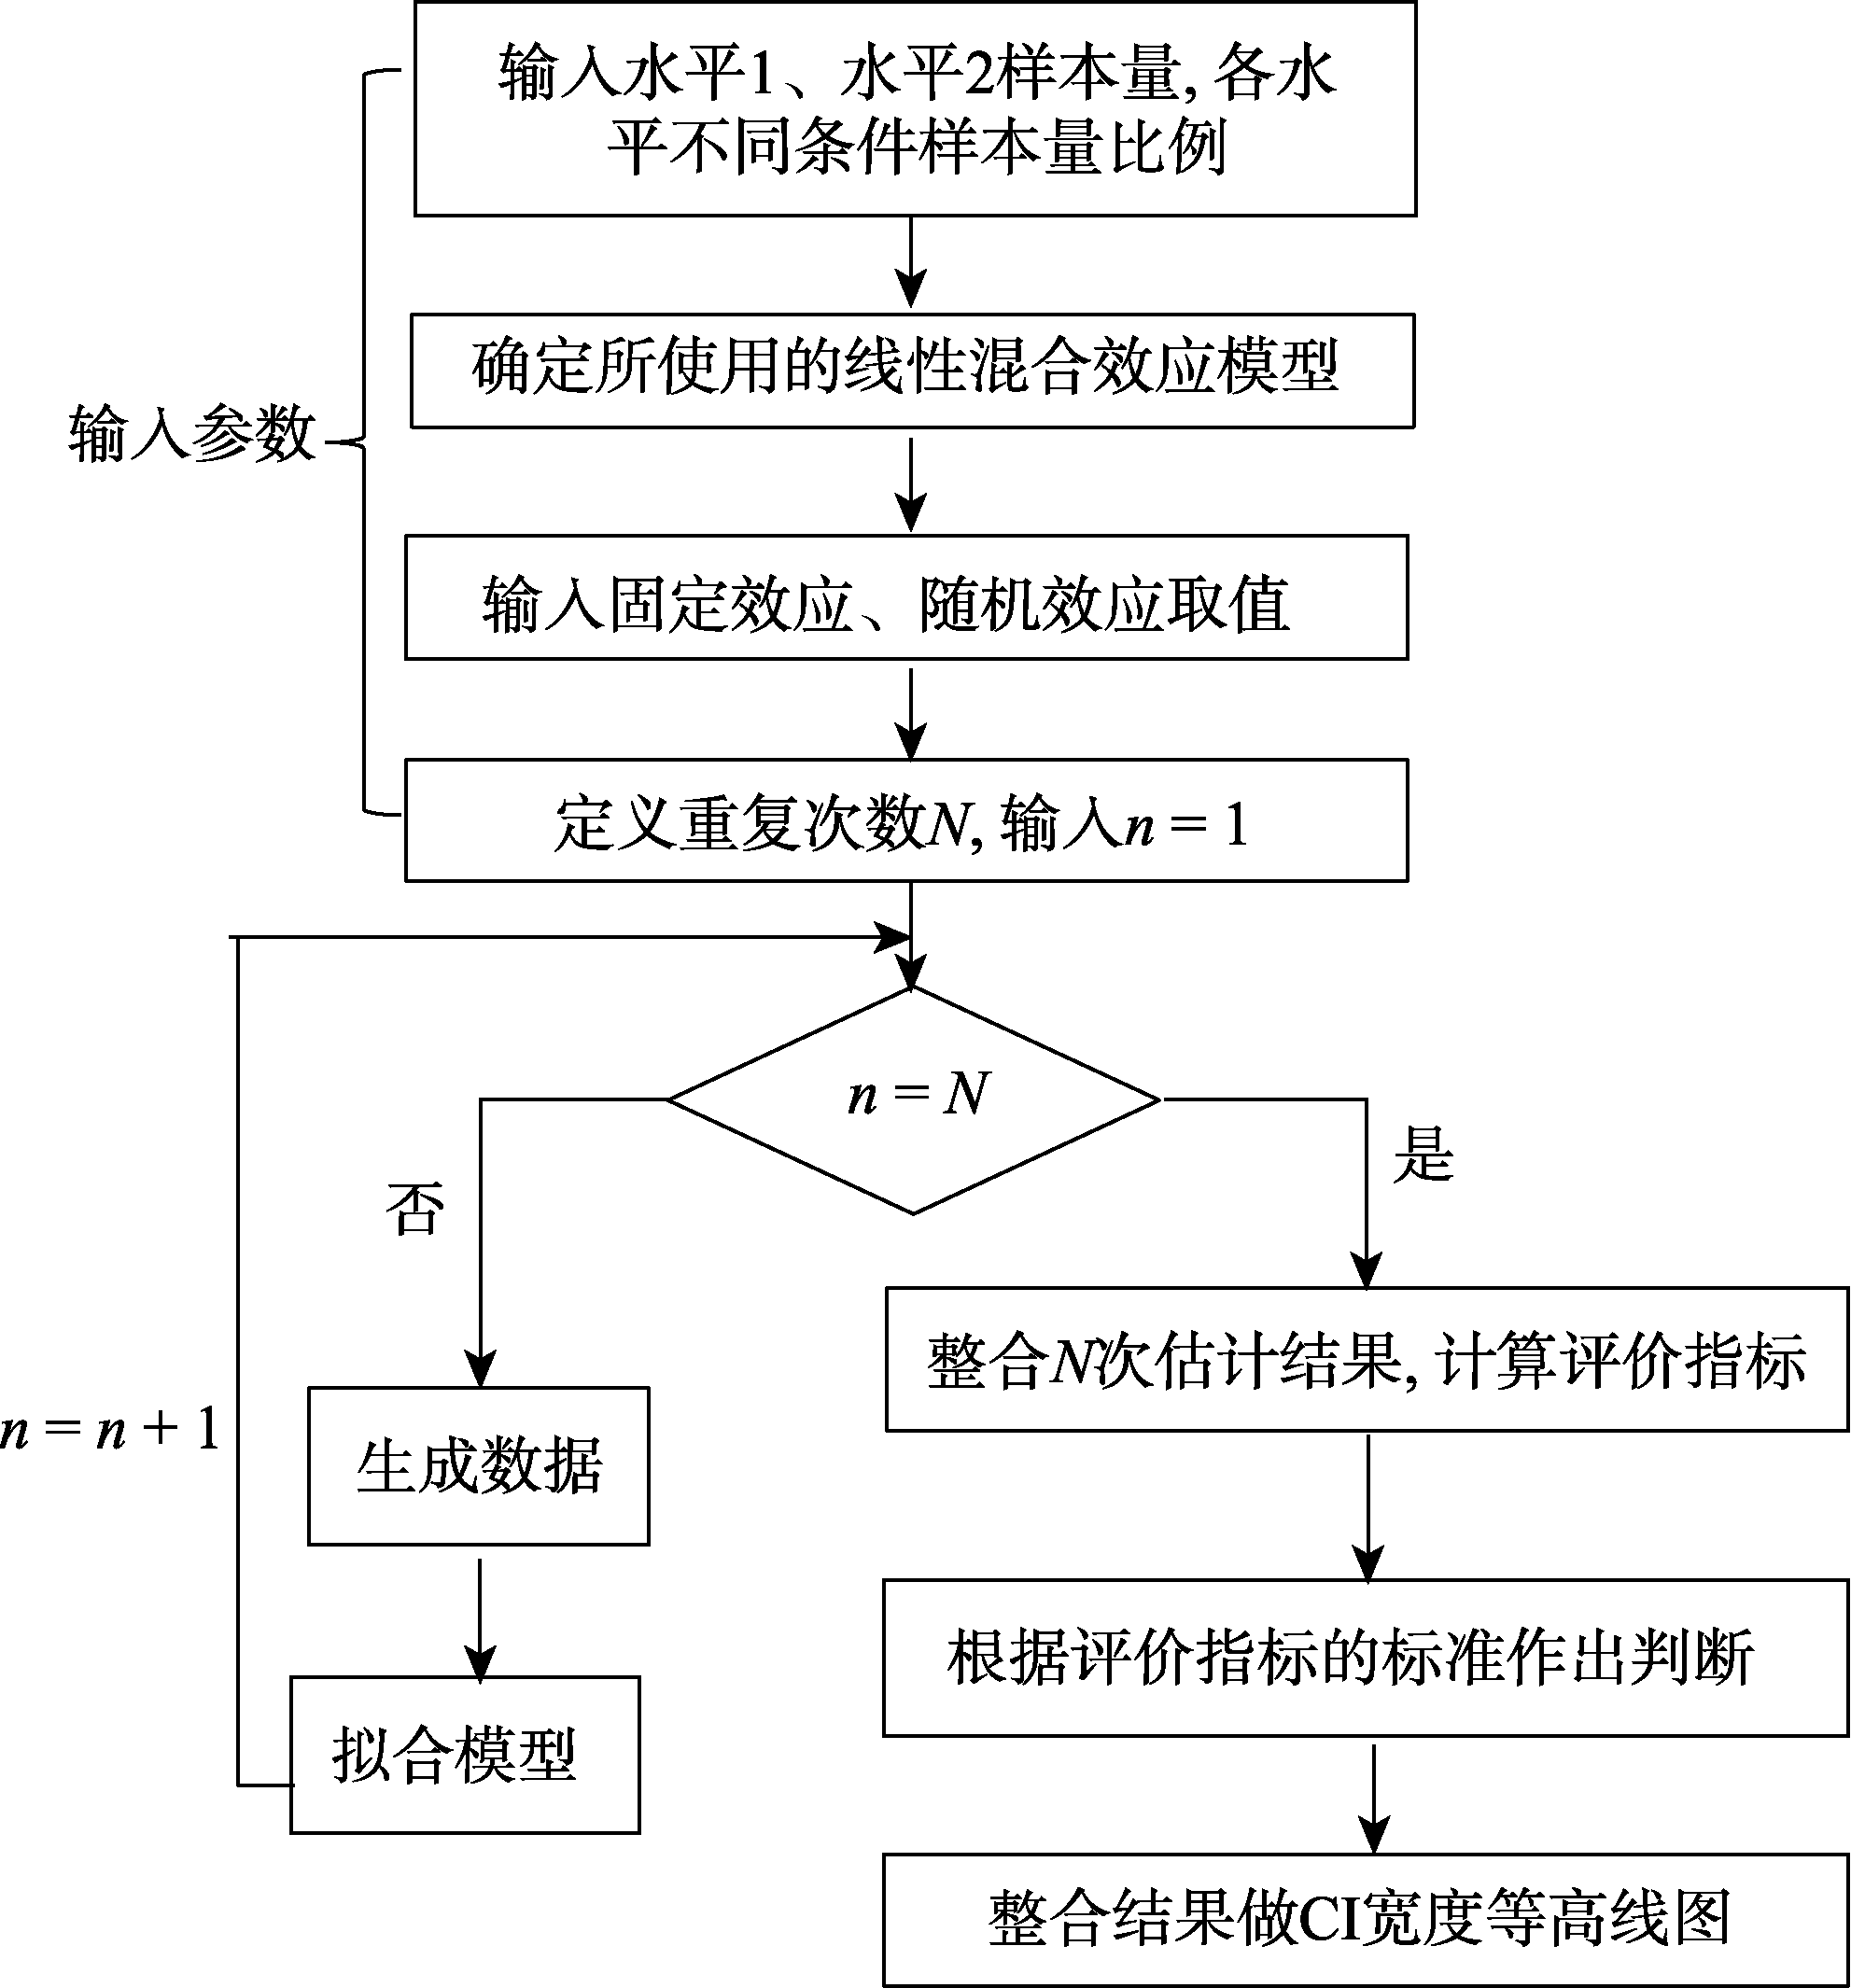
图1 CI宽度等高线图生成流程图
| ES | I | J | |||||||||
|---|---|---|---|---|---|---|---|---|---|---|---|
| 10 | 20 | 30 | 50 | 70 | 100 | 150 | 200 | 250 | 300 | ||
| 0.2 | 10 | 0.107 | 0.112 | 0.131 | 0.168 | 0.181 | 0.224 | 0.279 | 0.312 | 0.369 | 0.379 |
| 30 | 0.118 | 0.152 | 0.202 | 0.266 | 0.335 | 0.446 | 0.585 | 0.677 | 0.738 | 0.802 | |
| 50 | 0.170 | 0.175 | 0.224 | 0.278 | 0.409 | 0.490 | 0.677 | 0.756 | 0.832 | 0.888 | |
| 70 | 0.125 | 0.171 | 0.218 | 0.311 | 0.412 | 0.543 | 0.683 | 0.791 | 0.866 | 0.930 | |
| 100 | 0.133 | 0.169 | 0.233 | 0.335 | 0.420 | 0.535 | 0.701 | 0.816 | 0.893 | 0.935 | |
| 200 | 0.147 | 0.188 | 0.234 | 0.344 | 0.455 | 0.586 | 0.745 | 0.845 | 0.913 | 0.951 | |
| 400 | 0.115 | 0.194 | 0.232 | 0.345 | 0.433 | 0.574 | 0.766 | 0.852 | 0.918 | 0.958 | |
| 600 | 0.123 | 0.193 | 0.236 | 0.376 | 0.447 | 0.606 | 0.740 | 0.878 | 0.931 | 0.965 | |
| 800 | 0.147 | 0.202 | 0.245 | 0.377 | 0.480 | 0.549 | 0.764 | 0.909 | 0.948 | 0.969 | |
| 0.5 | 10 | 0.298 | 0.481 | 0.626 | 0.804 | 0.891 | 0.975 | 0.994 | 0.999 | 1.000 | 1.000 |
| 30 | 0.383 | 0.631 | 0.782 | 0.927 | 0.986 | 0.997 | 1.000 | 1.000 | 1.000 | 1.000 | |
| 50 | 0.438 | 0.659 | 0.810 | 0.959 | 0.992 | 1.000 | 1.000 | 1.000 | 1.000 | 1.000 | |
| 70 | 0.430 | 0.651 | 0.822 | 0.963 | 0.992 | 0.999 | 1.000 | 1.000 | 1.000 | 1.000 | |
| 100 | 0.453 | 0.659 | 0.845 | 0.967 | 0.996 | 0.999 | 1.000 | 1.000 | 1.000 | 1.000 | |
| 200 | 0.451 | 0.679 | 0.846 | 0.968 | 0.999 | 0.998 | 1.000 | 1.000 | 1.000 | 1.000 | |
| 400 | 0.453 | 0.714 | 0.856 | 0.976 | 0.997 | 1.000 | 1.000 | 1.000 | 1.000 | 1.000 | |
| 600 | 0.416 | 0.695 | 0.849 | 0.972 | 0.994 | 1.000 | 1.000 | 1.000 | 1.000 | 1.000 | |
| 800 | 0.464 | 0.715 | 0.850 | 0.972 | 0.999 | 1.000 | 1.000 | 1.000 | 1.000 | 1.000 | |
| 0.8 | 10 | 0.626 | 0.876 | 0.959 | 0.997 | 1.000 | 1.000 | 1.000 | 1.000 | 1.000 | 1.000 |
| 30 | 0.715 | 0.952 | 0.995 | 1.000 | 1.000 | 1.000 | 1.000 | 1.000 | 1.000 | 1.000 | |
| 50 | 0.747 | 0.956 | 0.993 | 1.000 | 1.000 | 1.000 | 1.000 | 1.000 | 1.000 | 1.000 | |
| 70 | 0.773 | 0.958 | 0.999 | 1.000 | 1.000 | 1.000 | 1.000 | 1.000 | 1.000 | 1.000 | |
| 100 | 0.766 | 0.968 | 0.997 | 1.000 | 1.000 | 1.000 | 1.000 | 1.000 | 1.000 | 1.000 | |
| 200 | 0.766 | 0.977 | 0.995 | 1.000 | 1.000 | 1.000 | 1.000 | 1.000 | 1.000 | 1.000 | |
| 400 | 0.799 | 0.970 | 0.999 | 1.000 | 1.000 | 1.000 | 1.000 | 1.000 | 1.000 | 1.000 | |
| 600 | 0.783 | 0.976 | 0.997 | 1.000 | 1.000 | 1.000 | 1.000 | 1.000 | 1.000 | 1.000 | |
| 800 | 0.805 | 0.973 | 0.997 | 1.000 | 1.000 | 1.000 | 1.000 | 1.000 | 1.000 | 1.000 | |
表1 研究1平衡设计各条件下线性混合效应模型水平1自变量效应的检验力
| ES | I | J | |||||||||
|---|---|---|---|---|---|---|---|---|---|---|---|
| 10 | 20 | 30 | 50 | 70 | 100 | 150 | 200 | 250 | 300 | ||
| 0.2 | 10 | 0.107 | 0.112 | 0.131 | 0.168 | 0.181 | 0.224 | 0.279 | 0.312 | 0.369 | 0.379 |
| 30 | 0.118 | 0.152 | 0.202 | 0.266 | 0.335 | 0.446 | 0.585 | 0.677 | 0.738 | 0.802 | |
| 50 | 0.170 | 0.175 | 0.224 | 0.278 | 0.409 | 0.490 | 0.677 | 0.756 | 0.832 | 0.888 | |
| 70 | 0.125 | 0.171 | 0.218 | 0.311 | 0.412 | 0.543 | 0.683 | 0.791 | 0.866 | 0.930 | |
| 100 | 0.133 | 0.169 | 0.233 | 0.335 | 0.420 | 0.535 | 0.701 | 0.816 | 0.893 | 0.935 | |
| 200 | 0.147 | 0.188 | 0.234 | 0.344 | 0.455 | 0.586 | 0.745 | 0.845 | 0.913 | 0.951 | |
| 400 | 0.115 | 0.194 | 0.232 | 0.345 | 0.433 | 0.574 | 0.766 | 0.852 | 0.918 | 0.958 | |
| 600 | 0.123 | 0.193 | 0.236 | 0.376 | 0.447 | 0.606 | 0.740 | 0.878 | 0.931 | 0.965 | |
| 800 | 0.147 | 0.202 | 0.245 | 0.377 | 0.480 | 0.549 | 0.764 | 0.909 | 0.948 | 0.969 | |
| 0.5 | 10 | 0.298 | 0.481 | 0.626 | 0.804 | 0.891 | 0.975 | 0.994 | 0.999 | 1.000 | 1.000 |
| 30 | 0.383 | 0.631 | 0.782 | 0.927 | 0.986 | 0.997 | 1.000 | 1.000 | 1.000 | 1.000 | |
| 50 | 0.438 | 0.659 | 0.810 | 0.959 | 0.992 | 1.000 | 1.000 | 1.000 | 1.000 | 1.000 | |
| 70 | 0.430 | 0.651 | 0.822 | 0.963 | 0.992 | 0.999 | 1.000 | 1.000 | 1.000 | 1.000 | |
| 100 | 0.453 | 0.659 | 0.845 | 0.967 | 0.996 | 0.999 | 1.000 | 1.000 | 1.000 | 1.000 | |
| 200 | 0.451 | 0.679 | 0.846 | 0.968 | 0.999 | 0.998 | 1.000 | 1.000 | 1.000 | 1.000 | |
| 400 | 0.453 | 0.714 | 0.856 | 0.976 | 0.997 | 1.000 | 1.000 | 1.000 | 1.000 | 1.000 | |
| 600 | 0.416 | 0.695 | 0.849 | 0.972 | 0.994 | 1.000 | 1.000 | 1.000 | 1.000 | 1.000 | |
| 800 | 0.464 | 0.715 | 0.850 | 0.972 | 0.999 | 1.000 | 1.000 | 1.000 | 1.000 | 1.000 | |
| 0.8 | 10 | 0.626 | 0.876 | 0.959 | 0.997 | 1.000 | 1.000 | 1.000 | 1.000 | 1.000 | 1.000 |
| 30 | 0.715 | 0.952 | 0.995 | 1.000 | 1.000 | 1.000 | 1.000 | 1.000 | 1.000 | 1.000 | |
| 50 | 0.747 | 0.956 | 0.993 | 1.000 | 1.000 | 1.000 | 1.000 | 1.000 | 1.000 | 1.000 | |
| 70 | 0.773 | 0.958 | 0.999 | 1.000 | 1.000 | 1.000 | 1.000 | 1.000 | 1.000 | 1.000 | |
| 100 | 0.766 | 0.968 | 0.997 | 1.000 | 1.000 | 1.000 | 1.000 | 1.000 | 1.000 | 1.000 | |
| 200 | 0.766 | 0.977 | 0.995 | 1.000 | 1.000 | 1.000 | 1.000 | 1.000 | 1.000 | 1.000 | |
| 400 | 0.799 | 0.970 | 0.999 | 1.000 | 1.000 | 1.000 | 1.000 | 1.000 | 1.000 | 1.000 | |
| 600 | 0.783 | 0.976 | 0.997 | 1.000 | 1.000 | 1.000 | 1.000 | 1.000 | 1.000 | 1.000 | |
| 800 | 0.805 | 0.973 | 0.997 | 1.000 | 1.000 | 1.000 | 1.000 | 1.000 | 1.000 | 1.000 | |
| criteria | I | J | |||||||||
|---|---|---|---|---|---|---|---|---|---|---|---|
| 10 | 20 | 30 | 50 | 70 | 100 | 150 | 200 | 250 | 300 | ||
| rbias | 10 | 0.008 | 0.009 | 0.001 | 0.007 | 0.001 | 0.012 | 0.001 | 0.001 | 0.001 | 0.000 |
| 30 | 0.007 | 0.002 | 0.006 | 0.017 | 0.003 | 0.003 | 0.007 | 0.001 | 0.001 | 0.003 | |
| 50 | 0.024 | 0.009 | 0.004 | 0.011 | 0.003 | 0.002 | 0.011 | 0.005 | 0.013 | 0.002 | |
| 70 | 0.003 | 0.004 | 0.019 | 0.001 | 0.017 | 0.001 | 0.001 | 0.001 | 0.004 | 0.005 | |
| 100 | 0.019 | 0.005 | 0.004 | 0.000 | 0.004 | 0.002 | 0.004 | 0.003 | 0.002 | 0.004 | |
| 200 | 0.013 | 0.007 | 0.015 | 0.007 | 0.014 | 0.010 | 0.001 | 0.001 | 0.002 | 0.003 | |
| 400 | 0.026 | 0.025 | 0.008 | 0.003 | 0.008 | 0.004 | 0.001 | 0.003 | 0.000 | 0.002 | |
| 600 | 0.016 | 0.011 | 0.007 | 0.003 | 0.005 | 0.005 | 0.004 | 0.002 | 0.003 | 0.006 | |
| 800 | 0.005 | 0.010 | 0.010 | 0.004 | 0.001 | 0.013 | 0.003 | 0.005 | 0.000 | 0.001 | |
| width | 10 | 1.411 | 1.036 | 0.861 | 0.709 | 0.633 | 0.565 | 0.506 | 0.476 | 0.458 | 0.444 |
| 30 | 1.197 | 0.860 | 0.713 | 0.573 | 0.498 | 0.434 | 0.376 | 0.343 | 0.321 | 0.306 | |
| 50 | 1.151 | 0.827 | 0.685 | 0.542 | 0.468 | 0.403 | 0.343 | 0.309 | 0.286 | 0.270 | |
| 70 | 1.125 | 0.817 | 0.669 | 0.530 | 0.453 | 0.389 | 0.328 | 0.293 | 0.269 | 0.252 | |
| 100 | 1.122 | 0.798 | 0.665 | 0.519 | 0.443 | 0.377 | 0.316 | 0.280 | 0.256 | 0.238 | |
| 200 | 1.091 | 0.786 | 0.649 | 0.505 | 0.431 | 0.362 | 0.301 | 0.265 | 0.240 | 0.221 | |
| 400 | 1.096 | 0.782 | 0.644 | 0.501 | 0.424 | 0.355 | 0.294 | 0.256 | 0.230 | 0.212 | |
| 600 | 1.086 | 0.778 | 0.643 | 0.497 | 0.422 | 0.353 | 0.290 | 0.254 | 0.227 | 0.209 | |
| 800 | 1.076 | 0.778 | 0.638 | 0.497 | 0.423 | 0.354 | 0.290 | 0.252 | 0.226 | 0.207 | |
| SE-SD bias | 10 | 0.006 | 0.024 | 0.023 | 0.027 | 0.025 | 0.032 | 0.035 | 0.046 | 0.048 | 0.047 |
| 30 | −0.006 | 0.005 | 0.007 | 0.008 | 0.013 | 0.015 | 0.017 | 0.020 | 0.019 | 0.022 | |
| 50 | −0.004 | 0.004 | 0.002 | 0.007 | 0.009 | 0.012 | 0.011 | 0.010 | 0.014 | 0.014 | |
| 70 | 0.004 | −0.006 | 0.006 | 0.003 | 0.006 | 0.006 | 0.010 | 0.009 | 0.012 | 0.011 | |
| 100 | −0.006 | −0.007 | 0.002 | 0.004 | 0.003 | 0.004 | 0.008 | 0.005 | 0.007 | 0.008 | |
| 200 | −0.002 | 0.006 | 0.000 | 0.000 | 0.004 | 0.005 | 0.002 | 0.002 | 0.003 | 0.004 | |
| 400 | 0.000 | −0.011 | 0.007 | 0.002 | 0.001 | 0.001 | 0.002 | 0.004 | 0.004 | 0.002 | |
| 600 | 0.000 | −0.002 | 0.000 | −0.007 | −0.004 | 0.001 | −0.002 | 0.001 | 0.002 | 0.003 | |
| 800 | −0.008 | 0.003 | 0.000 | 0.000 | 0.000 | 0.004 | 0.002 | 0.002 | 0.000 | 0.001 | |
表2 研究1平衡设计效应量为0.5时水平1自变量固定效应及其标准误估计准确性
| criteria | I | J | |||||||||
|---|---|---|---|---|---|---|---|---|---|---|---|
| 10 | 20 | 30 | 50 | 70 | 100 | 150 | 200 | 250 | 300 | ||
| rbias | 10 | 0.008 | 0.009 | 0.001 | 0.007 | 0.001 | 0.012 | 0.001 | 0.001 | 0.001 | 0.000 |
| 30 | 0.007 | 0.002 | 0.006 | 0.017 | 0.003 | 0.003 | 0.007 | 0.001 | 0.001 | 0.003 | |
| 50 | 0.024 | 0.009 | 0.004 | 0.011 | 0.003 | 0.002 | 0.011 | 0.005 | 0.013 | 0.002 | |
| 70 | 0.003 | 0.004 | 0.019 | 0.001 | 0.017 | 0.001 | 0.001 | 0.001 | 0.004 | 0.005 | |
| 100 | 0.019 | 0.005 | 0.004 | 0.000 | 0.004 | 0.002 | 0.004 | 0.003 | 0.002 | 0.004 | |
| 200 | 0.013 | 0.007 | 0.015 | 0.007 | 0.014 | 0.010 | 0.001 | 0.001 | 0.002 | 0.003 | |
| 400 | 0.026 | 0.025 | 0.008 | 0.003 | 0.008 | 0.004 | 0.001 | 0.003 | 0.000 | 0.002 | |
| 600 | 0.016 | 0.011 | 0.007 | 0.003 | 0.005 | 0.005 | 0.004 | 0.002 | 0.003 | 0.006 | |
| 800 | 0.005 | 0.010 | 0.010 | 0.004 | 0.001 | 0.013 | 0.003 | 0.005 | 0.000 | 0.001 | |
| width | 10 | 1.411 | 1.036 | 0.861 | 0.709 | 0.633 | 0.565 | 0.506 | 0.476 | 0.458 | 0.444 |
| 30 | 1.197 | 0.860 | 0.713 | 0.573 | 0.498 | 0.434 | 0.376 | 0.343 | 0.321 | 0.306 | |
| 50 | 1.151 | 0.827 | 0.685 | 0.542 | 0.468 | 0.403 | 0.343 | 0.309 | 0.286 | 0.270 | |
| 70 | 1.125 | 0.817 | 0.669 | 0.530 | 0.453 | 0.389 | 0.328 | 0.293 | 0.269 | 0.252 | |
| 100 | 1.122 | 0.798 | 0.665 | 0.519 | 0.443 | 0.377 | 0.316 | 0.280 | 0.256 | 0.238 | |
| 200 | 1.091 | 0.786 | 0.649 | 0.505 | 0.431 | 0.362 | 0.301 | 0.265 | 0.240 | 0.221 | |
| 400 | 1.096 | 0.782 | 0.644 | 0.501 | 0.424 | 0.355 | 0.294 | 0.256 | 0.230 | 0.212 | |
| 600 | 1.086 | 0.778 | 0.643 | 0.497 | 0.422 | 0.353 | 0.290 | 0.254 | 0.227 | 0.209 | |
| 800 | 1.076 | 0.778 | 0.638 | 0.497 | 0.423 | 0.354 | 0.290 | 0.252 | 0.226 | 0.207 | |
| SE-SD bias | 10 | 0.006 | 0.024 | 0.023 | 0.027 | 0.025 | 0.032 | 0.035 | 0.046 | 0.048 | 0.047 |
| 30 | −0.006 | 0.005 | 0.007 | 0.008 | 0.013 | 0.015 | 0.017 | 0.020 | 0.019 | 0.022 | |
| 50 | −0.004 | 0.004 | 0.002 | 0.007 | 0.009 | 0.012 | 0.011 | 0.010 | 0.014 | 0.014 | |
| 70 | 0.004 | −0.006 | 0.006 | 0.003 | 0.006 | 0.006 | 0.010 | 0.009 | 0.012 | 0.011 | |
| 100 | −0.006 | −0.007 | 0.002 | 0.004 | 0.003 | 0.004 | 0.008 | 0.005 | 0.007 | 0.008 | |
| 200 | −0.002 | 0.006 | 0.000 | 0.000 | 0.004 | 0.005 | 0.002 | 0.002 | 0.003 | 0.004 | |
| 400 | 0.000 | −0.011 | 0.007 | 0.002 | 0.001 | 0.001 | 0.002 | 0.004 | 0.004 | 0.002 | |
| 600 | 0.000 | −0.002 | 0.000 | −0.007 | −0.004 | 0.001 | −0.002 | 0.001 | 0.002 | 0.003 | |
| 800 | −0.008 | 0.003 | 0.000 | 0.000 | 0.000 | 0.004 | 0.002 | 0.002 | 0.000 | 0.001 | |

图2 研究1平衡设计水平1自变量效应量中情况下的CI宽度等高线图 注:图(a)中阴影区域表示符合检验力大于等于0.8标准的条件, 图(b)中阴影区域表示符合检验力大于等于0.8且所有随机效应估计值rbias小于0.1的条件。不同95% CI宽度用不同颜色的等高线表示。如图例所示从0.3到1.0间隔0.1, 在图中共有8条依次排列的等高线。例如, 0.3对应的等高线表示线条以上的区域95% CI宽度在0.3及其以下。后同。

图3 研究2平衡设计$\tau _{11}^{2}$中等且${{W}_{i}}$为分类变量时的CI宽度等高线图
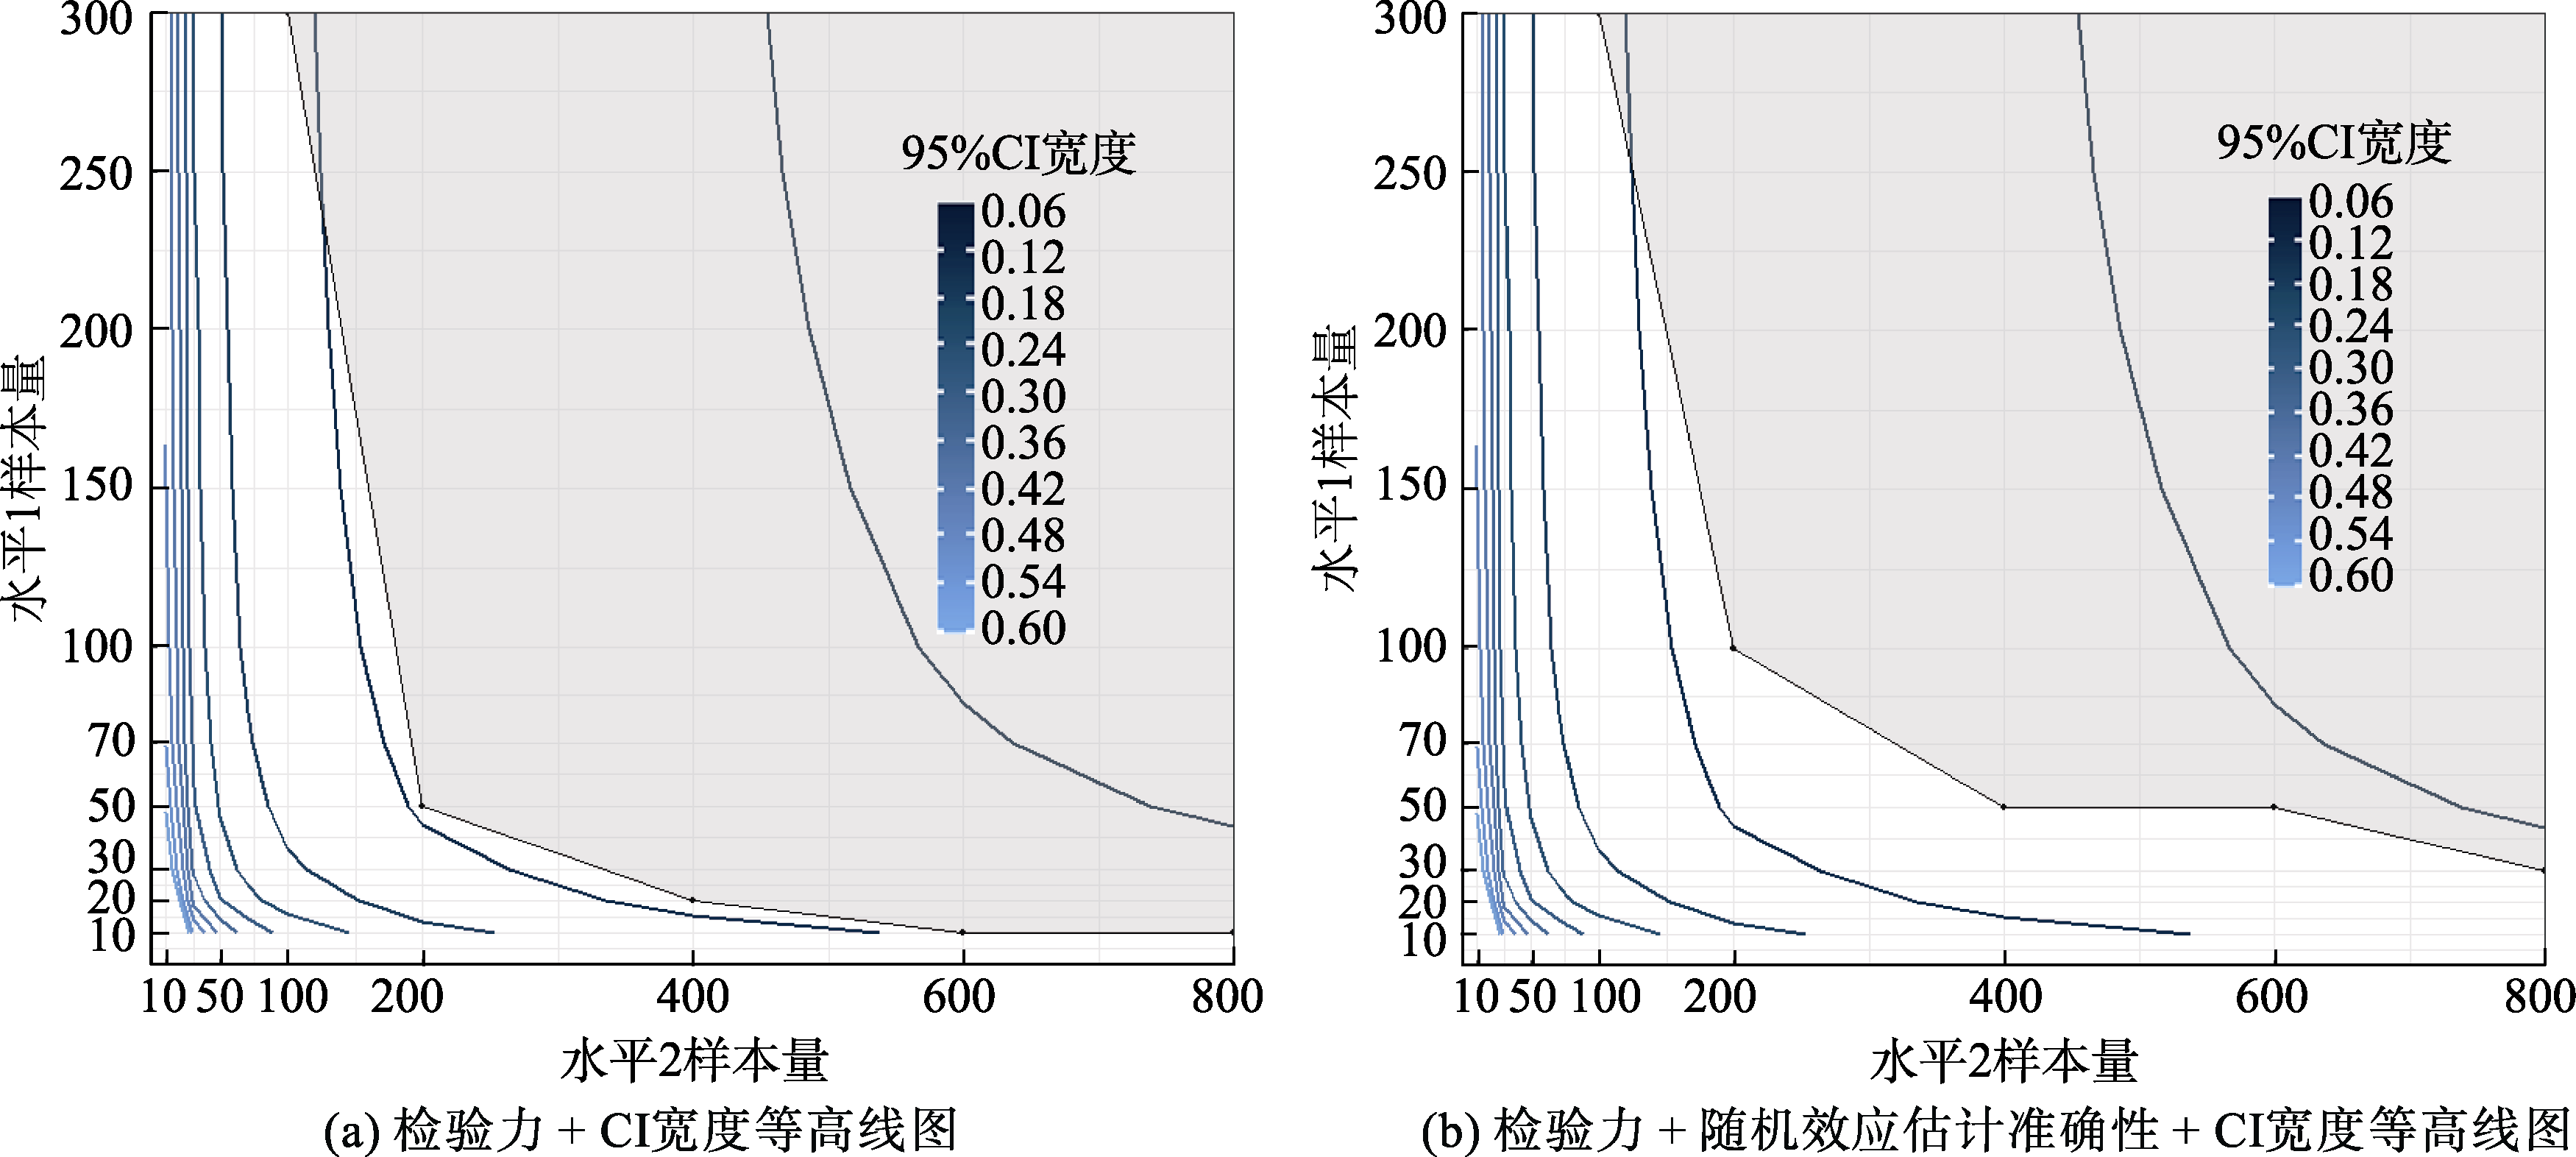
图4 研究1平衡设计$\tau _{11}^{2}$中等且${{W}_{i}}$为连续变量时的CI宽度等高线图
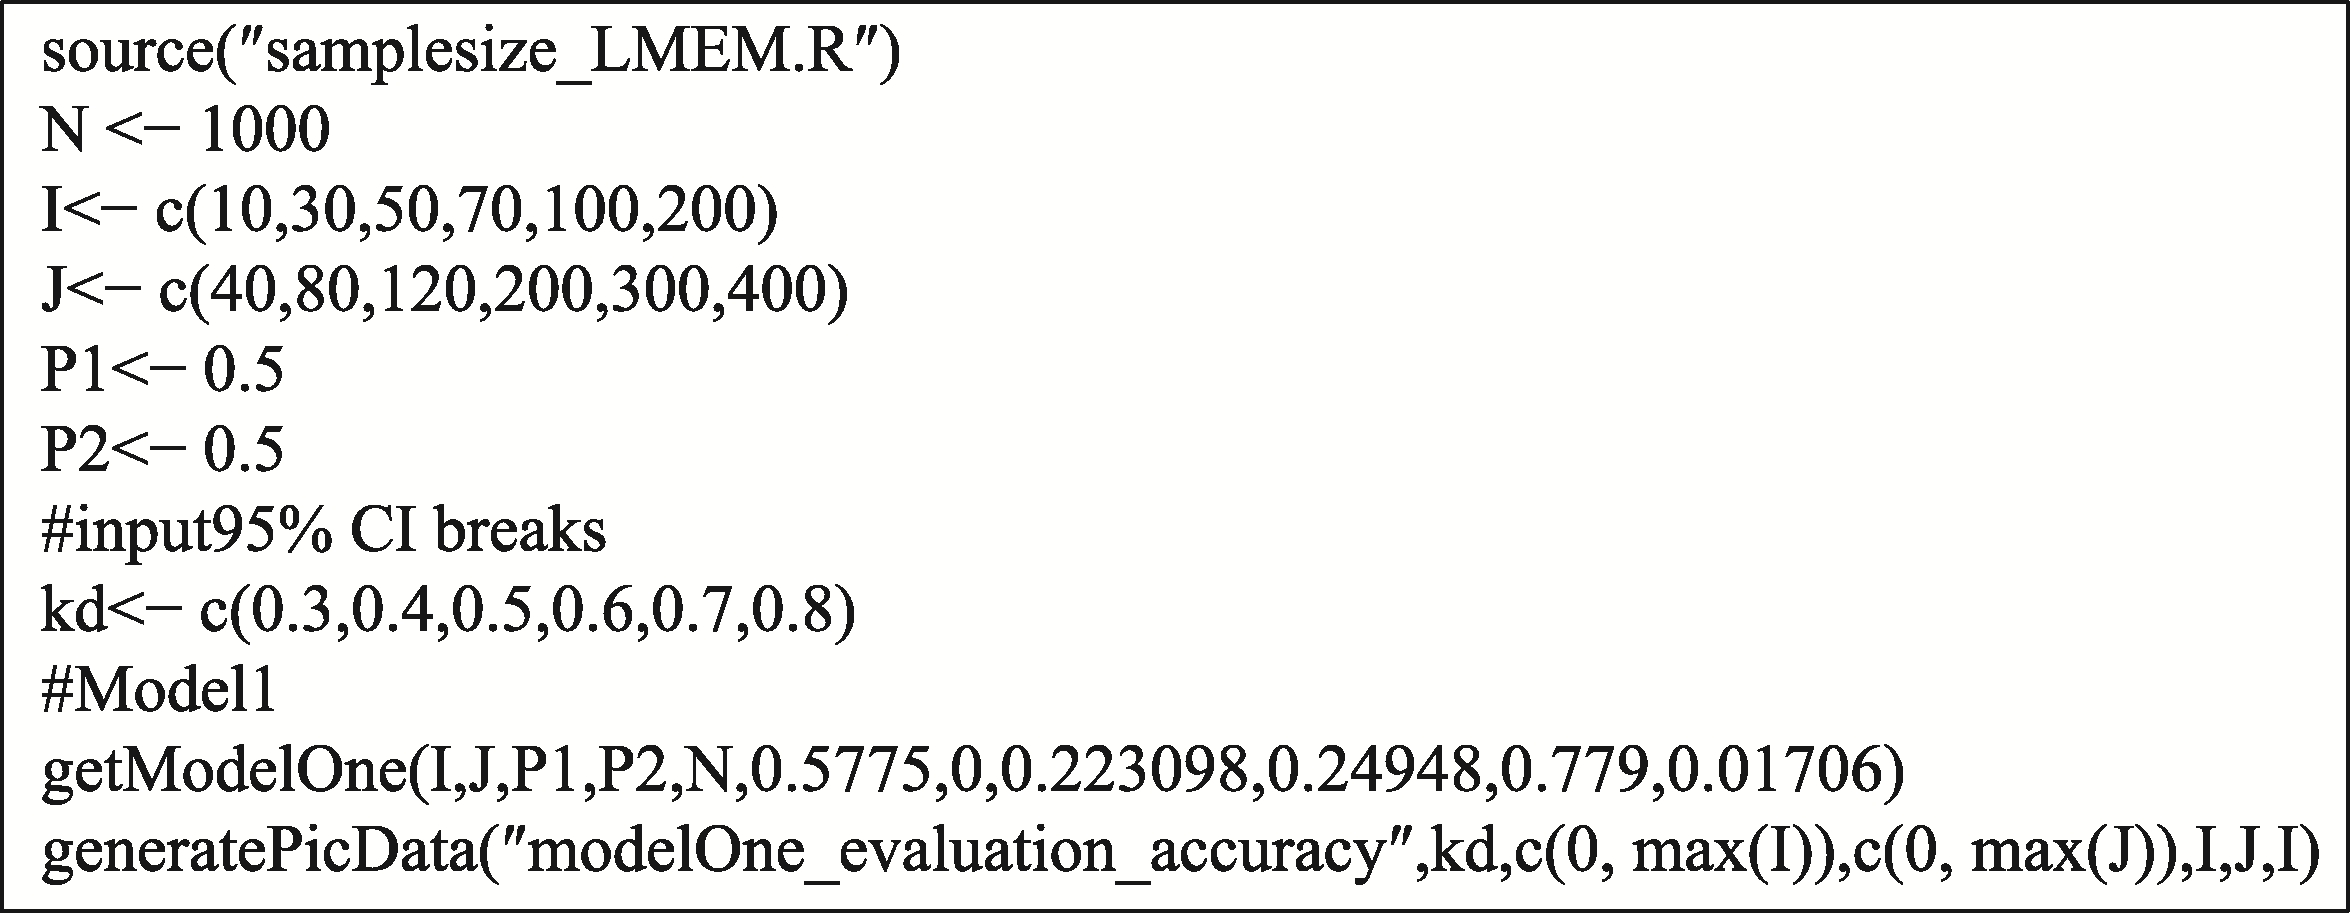
图5 实例演示调用函数开展样本量规划语句
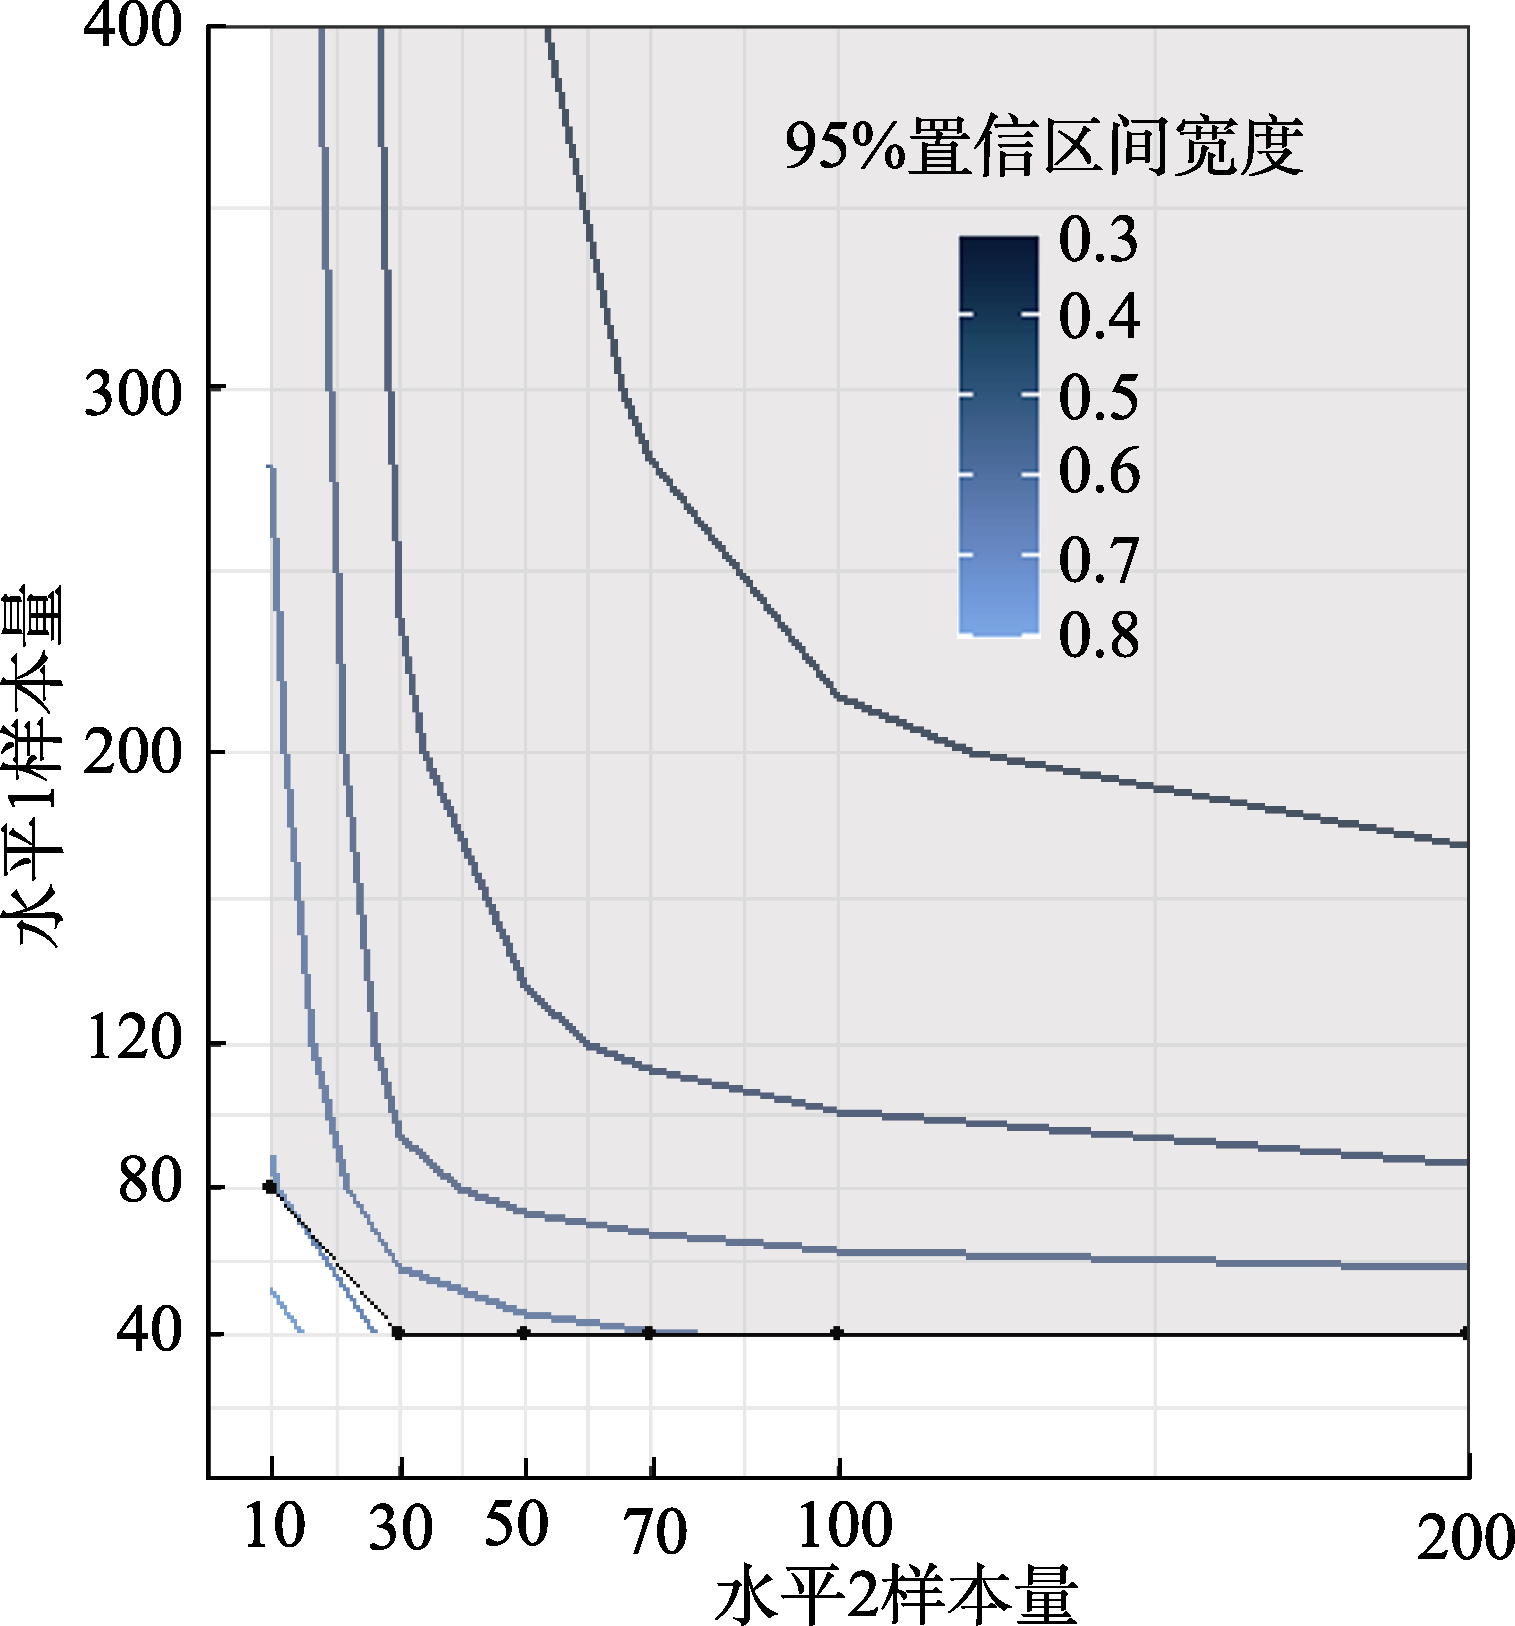
图6 实例演示检验力 + CI宽度等高线图
| ES | I | J | |||||||||
|---|---|---|---|---|---|---|---|---|---|---|---|
| 10 | 20 | 30 | 50 | 70 | 100 | 150 | 200 | 250 | 300 | ||
| 0.2 | 10 | 0.985 | 0.992 | 0.993 | 0.993 | 0.994 | 0.993 | 0.996 | 0.991 | 0.981 | 0.980 |
| 30 | 0.989 | 0.994 | 0.994 | 0.999 | 0.998 | 0.994 | 0.995 | 0.986 | 0.985 | 0.974 | |
| 50 | 0.990 | 0.996 | 0.997 | 0.994 | 0.995 | 0.983 | 0.982 | 0.977 | 0.964 | 0.961 | |
| 70 | 0.986 | 0.991 | 0.996 | 0.996 | 0.992 | 0.987 | 0.982 | 0.965 | 0.962 | 0.938 | |
| 100 | 0.983 | 0.986 | 0.995 | 0.991 | 0.988 | 0.993 | 0.971 | 0.964 | 0.948 | 0.932 | |
| 200 | 0.973 | 0.967 | 0.976 | 0.985 | 0.979 | 0.960 | 0.953 | 0.936 | 0.913 | 0.885 | |
| 400 | 0.962 | 0.949 | 0.957 | 0.965 | 0.949 | 0.929 | 0.907 | 0.894 | 0.880 | 0.878 | |
| 600 | 0.934 | 0.928 | 0.939 | 0.947 | 0.910 | 0.907 | 0.881 | 0.849 | 0.826 | 0.835 | |
| 800 | 0.918 | 0.991 | 0.912 | 0.897 | 0.863 | 0.864 | 0.846 | 0.820 | 0.791 | 0.772 | |
| 0.5 | 10 | 0.986 | 0.992 | 0.992 | 0.996 | 0.995 | 0.996 | 0.997 | 0.986 | 0.991 | 0.985 |
| 30 | 0.986 | 0.998 | 0.995 | 0.998 | 0.994 | 0.993 | 0.989 | 0.994 | 0.984 | 0.976 | |
| 50 | 0.983 | 0.993 | 0.996 | 0.993 | 0.993 | 0.987 | 0.983 | 0.971 | 0.960 | 0.959 | |
| 70 | 0.989 | 0.985 | 0.998 | 0.996 | 0.986 | 0.985 | 0.986 | 0.973 | 0.940 | 0.939 | |
| 100 | 0.984 | 0.965 | 0.993 | 0.994 | 0.989 | 0.990 | 0.982 | 0.962 | 0.937 | 0.919 | |
| 200 | 0.977 | 0.942 | 0.986 | 0.981 | 0.981 | 0.975 | 0.951 | 0.938 | 0.915 | 0.902 | |
| 400 | 0.962 | 0.927 | 0.962 | 0.961 | 0.955 | 0.946 | 0.913 | 0.891 | 0.871 | 0.864 | |
| 600 | 0.947 | 0.992 | 0.933 | 0.921 | 0.907 | 0.916 | 0.877 | 0.836 | 0.849 | 0.848 | |
| 800 | 0.925 | 0.994 | 0.929 | 0.900 | 0.879 | 0.865 | 0.874 | 0.818 | 0.784 | 0.760 | |
| 0.8 | 10 | 0.989 | 0.988 | 0.991 | 0.994 | 0.994 | 0.994 | 0.995 | 0.988 | 0.982 | 0.974 |
| 30 | 0.991 | 0.99 | 0.994 | 0.998 | 0.995 | 0.996 | 0.988 | 0.984 | 0.986 | 0.980 | |
| 50 | 0.984 | 0.987 | 1.000 | 0.998 | 0.986 | 0.985 | 0.977 | 0.973 | 0.959 | 0.942 | |
| 70 | 0.984 | 0.973 | 0.998 | 0.992 | 0.993 | 0.974 | 0.978 | 0.959 | 0.958 | 0.952 | |
| 100 | 0.981 | 0.942 | 0.992 | 0.995 | 0.994 | 0.991 | 0.980 | 0.960 | 0.941 | 0.928 | |
| 200 | 0.967 | 0.942 | 0.984 | 0.984 | 0.978 | 0.970 | 0.947 | 0.933 | 0.915 | 0.897 | |
| 400 | 0.959 | 0.992 | 0.947 | 0.951 | 0.947 | 0.940 | 0.903 | 0.887 | 0.886 | 0.871 | |
| 600 | 0.929 | 0.994 | 0.937 | 0.927 | 0.916 | 0.915 | 0.903 | 0.866 | 0.827 | 0.826 | |
| 800 | 0.929 | 0.994 | 0.913 | 0.910 | 0.885 | 0.876 | 0.859 | 0.823 | 0.799 | 0.770 | |
附表1 研究一平衡设计各条件下线性混合效应模型收敛率
| ES | I | J | |||||||||
|---|---|---|---|---|---|---|---|---|---|---|---|
| 10 | 20 | 30 | 50 | 70 | 100 | 150 | 200 | 250 | 300 | ||
| 0.2 | 10 | 0.985 | 0.992 | 0.993 | 0.993 | 0.994 | 0.993 | 0.996 | 0.991 | 0.981 | 0.980 |
| 30 | 0.989 | 0.994 | 0.994 | 0.999 | 0.998 | 0.994 | 0.995 | 0.986 | 0.985 | 0.974 | |
| 50 | 0.990 | 0.996 | 0.997 | 0.994 | 0.995 | 0.983 | 0.982 | 0.977 | 0.964 | 0.961 | |
| 70 | 0.986 | 0.991 | 0.996 | 0.996 | 0.992 | 0.987 | 0.982 | 0.965 | 0.962 | 0.938 | |
| 100 | 0.983 | 0.986 | 0.995 | 0.991 | 0.988 | 0.993 | 0.971 | 0.964 | 0.948 | 0.932 | |
| 200 | 0.973 | 0.967 | 0.976 | 0.985 | 0.979 | 0.960 | 0.953 | 0.936 | 0.913 | 0.885 | |
| 400 | 0.962 | 0.949 | 0.957 | 0.965 | 0.949 | 0.929 | 0.907 | 0.894 | 0.880 | 0.878 | |
| 600 | 0.934 | 0.928 | 0.939 | 0.947 | 0.910 | 0.907 | 0.881 | 0.849 | 0.826 | 0.835 | |
| 800 | 0.918 | 0.991 | 0.912 | 0.897 | 0.863 | 0.864 | 0.846 | 0.820 | 0.791 | 0.772 | |
| 0.5 | 10 | 0.986 | 0.992 | 0.992 | 0.996 | 0.995 | 0.996 | 0.997 | 0.986 | 0.991 | 0.985 |
| 30 | 0.986 | 0.998 | 0.995 | 0.998 | 0.994 | 0.993 | 0.989 | 0.994 | 0.984 | 0.976 | |
| 50 | 0.983 | 0.993 | 0.996 | 0.993 | 0.993 | 0.987 | 0.983 | 0.971 | 0.960 | 0.959 | |
| 70 | 0.989 | 0.985 | 0.998 | 0.996 | 0.986 | 0.985 | 0.986 | 0.973 | 0.940 | 0.939 | |
| 100 | 0.984 | 0.965 | 0.993 | 0.994 | 0.989 | 0.990 | 0.982 | 0.962 | 0.937 | 0.919 | |
| 200 | 0.977 | 0.942 | 0.986 | 0.981 | 0.981 | 0.975 | 0.951 | 0.938 | 0.915 | 0.902 | |
| 400 | 0.962 | 0.927 | 0.962 | 0.961 | 0.955 | 0.946 | 0.913 | 0.891 | 0.871 | 0.864 | |
| 600 | 0.947 | 0.992 | 0.933 | 0.921 | 0.907 | 0.916 | 0.877 | 0.836 | 0.849 | 0.848 | |
| 800 | 0.925 | 0.994 | 0.929 | 0.900 | 0.879 | 0.865 | 0.874 | 0.818 | 0.784 | 0.760 | |
| 0.8 | 10 | 0.989 | 0.988 | 0.991 | 0.994 | 0.994 | 0.994 | 0.995 | 0.988 | 0.982 | 0.974 |
| 30 | 0.991 | 0.99 | 0.994 | 0.998 | 0.995 | 0.996 | 0.988 | 0.984 | 0.986 | 0.980 | |
| 50 | 0.984 | 0.987 | 1.000 | 0.998 | 0.986 | 0.985 | 0.977 | 0.973 | 0.959 | 0.942 | |
| 70 | 0.984 | 0.973 | 0.998 | 0.992 | 0.993 | 0.974 | 0.978 | 0.959 | 0.958 | 0.952 | |
| 100 | 0.981 | 0.942 | 0.992 | 0.995 | 0.994 | 0.991 | 0.980 | 0.960 | 0.941 | 0.928 | |
| 200 | 0.967 | 0.942 | 0.984 | 0.984 | 0.978 | 0.970 | 0.947 | 0.933 | 0.915 | 0.897 | |
| 400 | 0.959 | 0.992 | 0.947 | 0.951 | 0.947 | 0.940 | 0.903 | 0.887 | 0.886 | 0.871 | |
| 600 | 0.929 | 0.994 | 0.937 | 0.927 | 0.916 | 0.915 | 0.903 | 0.866 | 0.827 | 0.826 | |
| 800 | 0.929 | 0.994 | 0.913 | 0.910 | 0.885 | 0.876 | 0.859 | 0.823 | 0.799 | 0.770 | |
| I | J | |||||||||
|---|---|---|---|---|---|---|---|---|---|---|
| 10 | 20 | 30 | 50 | 70 | 100 | 150 | 200 | 250 | 300 | |
| 10 | 0.929 | 0.973 | 0.988 | 0.988 | 0.990 | 0.990 | 0.990 | 0.985 | 0.977 | 0.978 |
| 30 | 0.964 | 0.985 | 0.992 | 0.997 | 0.996 | 0.997 | 0.985 | 0.972 | 0.992 | 0.985 |
| 50 | 0.974 | 0.982 | 0.985 | 0.991 | 0.997 | 0.994 | 0.988 | 0.982 | 0.974 | 0.978 |
| 70 | 0.966 | 0.979 | 0.989 | 0.987 | 0.986 | 0.981 | 0.985 | 0.982 | 0.967 | 0.953 |
| 100 | 0.956 | 0.972 | 0.992 | 0.988 | 0.983 | 0.973 | 0.963 | 0.972 | 0.955 | 0.951 |
| 200 | 0.925 | 0.955 | 0.963 | 0.974 | 0.964 | 0.970 | 0.965 | 0.936 | 0.943 | 0.927 |
| 400 | 0.911 | 0.910 | 0.942 | 0.943 | 0.934 | 0.929 | 0.918 | 0.925 | 0.916 | 0.897 |
| 600 | 0.891 | 0.879 | 0.914 | 0.898 | 0.919 | 0.917 | 0.901 | 0.886 | 0.853 | 0.847 |
| 800 | 0.879 | 0.879 | 0.873 | 0.867 | 0.854 | 0.892 | 0.877 | 0.861 | 0.844 | 0.782 |
附表2 研究一非平衡设计各条件下线性混合效应模型收敛率
| I | J | |||||||||
|---|---|---|---|---|---|---|---|---|---|---|
| 10 | 20 | 30 | 50 | 70 | 100 | 150 | 200 | 250 | 300 | |
| 10 | 0.929 | 0.973 | 0.988 | 0.988 | 0.990 | 0.990 | 0.990 | 0.985 | 0.977 | 0.978 |
| 30 | 0.964 | 0.985 | 0.992 | 0.997 | 0.996 | 0.997 | 0.985 | 0.972 | 0.992 | 0.985 |
| 50 | 0.974 | 0.982 | 0.985 | 0.991 | 0.997 | 0.994 | 0.988 | 0.982 | 0.974 | 0.978 |
| 70 | 0.966 | 0.979 | 0.989 | 0.987 | 0.986 | 0.981 | 0.985 | 0.982 | 0.967 | 0.953 |
| 100 | 0.956 | 0.972 | 0.992 | 0.988 | 0.983 | 0.973 | 0.963 | 0.972 | 0.955 | 0.951 |
| 200 | 0.925 | 0.955 | 0.963 | 0.974 | 0.964 | 0.970 | 0.965 | 0.936 | 0.943 | 0.927 |
| 400 | 0.911 | 0.910 | 0.942 | 0.943 | 0.934 | 0.929 | 0.918 | 0.925 | 0.916 | 0.897 |
| 600 | 0.891 | 0.879 | 0.914 | 0.898 | 0.919 | 0.917 | 0.901 | 0.886 | 0.853 | 0.847 |
| 800 | 0.879 | 0.879 | 0.873 | 0.867 | 0.854 | 0.892 | 0.877 | 0.861 | 0.844 | 0.782 |
| I | J | |||||||||
|---|---|---|---|---|---|---|---|---|---|---|
| 10 | 20 | 30 | 50 | 70 | 100 | 150 | 200 | 250 | 300 | |
| 10 | 0.211 | 0.307 | 0.446 | 0.653 | 0.796 | 0.914 | 0.972 | 0.995 | 0.995 | 1.000 |
| 30 | 0.296 | 0.472 | 0.596 | 0.835 | 0.913 | 0.974 | 1.000 | 1.000 | 1.000 | 1.000 |
| 50 | 0.316 | 0.464 | 0.640 | 0.830 | 0.940 | 0.983 | 0.999 | 1.000 | 1.000 | 1.000 |
| 70 | 0.320 | 0.487 | 0.642 | 0.850 | 0.942 | 0.991 | 1.000 | 1.000 | 1.000 | 1.000 |
| 100 | 0.297 | 0.506 | 0.660 | 0.867 | 0.951 | 0.987 | 0.999 | 1.000 | 1.000 | 1.000 |
| 200 | 0.329 | 0.517 | 0.658 | 0.877 | 0.952 | 0.989 | 1.000 | 1.000 | 1.000 | 1.000 |
| 400 | 0.353 | 0.527 | 0.660 | 0.876 | 0.964 | 0.992 | 0.999 | 1.000 | 1.000 | 1.000 |
| 600 | 0.315 | 0.547 | 0.660 | 0.875 | 0.958 | 0.995 | 1.000 | 1.000 | 1.000 | 1.000 |
| 800 | 0.308 | 0.529 | 0.686 | 0.895 | 0.963 | 0.992 | 1.000 | 1.000 | 1.000 | 1.000 |
附表3 研究一非平衡设计效应量为0.5时线性混合效应模型水平1自变量效应的检验力
| I | J | |||||||||
|---|---|---|---|---|---|---|---|---|---|---|
| 10 | 20 | 30 | 50 | 70 | 100 | 150 | 200 | 250 | 300 | |
| 10 | 0.211 | 0.307 | 0.446 | 0.653 | 0.796 | 0.914 | 0.972 | 0.995 | 0.995 | 1.000 |
| 30 | 0.296 | 0.472 | 0.596 | 0.835 | 0.913 | 0.974 | 1.000 | 1.000 | 1.000 | 1.000 |
| 50 | 0.316 | 0.464 | 0.640 | 0.830 | 0.940 | 0.983 | 0.999 | 1.000 | 1.000 | 1.000 |
| 70 | 0.320 | 0.487 | 0.642 | 0.850 | 0.942 | 0.991 | 1.000 | 1.000 | 1.000 | 1.000 |
| 100 | 0.297 | 0.506 | 0.660 | 0.867 | 0.951 | 0.987 | 0.999 | 1.000 | 1.000 | 1.000 |
| 200 | 0.329 | 0.517 | 0.658 | 0.877 | 0.952 | 0.989 | 1.000 | 1.000 | 1.000 | 1.000 |
| 400 | 0.353 | 0.527 | 0.660 | 0.876 | 0.964 | 0.992 | 0.999 | 1.000 | 1.000 | 1.000 |
| 600 | 0.315 | 0.547 | 0.660 | 0.875 | 0.958 | 0.995 | 1.000 | 1.000 | 1.000 | 1.000 |
| 800 | 0.308 | 0.529 | 0.686 | 0.895 | 0.963 | 0.992 | 1.000 | 1.000 | 1.000 | 1.000 |
| criteria | I | J | |||||||||
|---|---|---|---|---|---|---|---|---|---|---|---|
| 10 | 20 | 30 | 50 | 70 | 100 | 150 | 200 | 250 | 300 | ||
| bias | 10 | -0.004 | 0.005 | -0.001 | -0.004 | -0.001 | 0.006 | -0.001 | 0.000 | 0.000 | 0.000 |
| 30 | 0.004 | 0.001 | -0.003 | -0.008 | -0.002 | -0.002 | -0.003 | -0.001 | 0.001 | 0.001 | |
| 50 | 0.012 | 0.004 | 0.002 | 0.005 | -0.001 | -0.001 | 0.006 | -0.002 | -0.007 | -0.001 | |
| 70 | 0.001 | -0.002 | -0.010 | -0.001 | -0.009 | -0.001 | -0.001 | 0.001 | 0.002 | 0.002 | |
| 100 | 0.009 | -0.002 | 0.002 | 0.000 | -0.002 | 0.001 | -0.002 | 0.002 | 0.001 | -0.002 | |
| 200 | 0.006 | -0.003 | -0.007 | -0.004 | 0.007 | -0.005 | 0.000 | -0.001 | 0.001 | -0.001 | |
| 400 | 0.013 | 0.013 | -0.004 | -0.002 | 0.004 | -0.002 | -0.001 | -0.001 | 0.000 | 0.001 | |
| 600 | -0.008 | -0.005 | -0.003 | 0.002 | 0.002 | -0.002 | -0.002 | -0.001 | 0.001 | 0.003 | |
| 800 | -0.002 | 0.005 | -0.005 | 0.002 | 0.000 | -0.007 | 0.001 | -0.002 | 0.000 | 0.001 | |
| RMSE | 10 | 0.354 | 0.240 | 0.196 | 0.154 | 0.136 | 0.112 | 0.094 | 0.076 | 0.069 | 0.066 |
| 30 | 0.312 | 0.215 | 0.175 | 0.139 | 0.114 | 0.096 | 0.079 | 0.067 | 0.063 | 0.056 | |
| 50 | 0.297 | 0.207 | 0.173 | 0.132 | 0.110 | 0.091 | 0.077 | 0.069 | 0.059 | 0.055 | |
| 70 | 0.283 | 0.215 | 0.165 | 0.132 | 0.110 | 0.093 | 0.074 | 0.066 | 0.057 | 0.053 | |
| 100 | 0.292 | 0.211 | 0.167 | 0.128 | 0.110 | 0.092 | 0.073 | 0.066 | 0.058 | 0.053 | |
| 200 | 0.280 | 0.195 | 0.166 | 0.129 | 0.106 | 0.088 | 0.075 | 0.066 | 0.058 | 0.052 | |
| 400 | 0.280 | 0.211 | 0.158 | 0.125 | 0.107 | 0.090 | 0.073 | 0.061 | 0.054 | 0.052 | |
| 600 | 0.277 | 0.201 | 0.164 | 0.134 | 0.111 | 0.089 | 0.076 | 0.064 | 0.056 | 0.050 | |
| 800 | 0.282 | 0.195 | 0.162 | 0.127 | 0.108 | 0.087 | 0.072 | 0.063 | 0.058 | 0.052 | |
| CP | 10 | 0.927 | 0.958 | 0.965 | 0.972 | 0.984 | 0.990 | 0.986 | 0.997 | 0.997 | 0.999 |
| 30 | 0.921 | 0.935 | 0.952 | 0.957 | 0.967 | 0.972 | 0.979 | 0.989 | 0.992 | 0.994 | |
| 50 | 0.923 | 0.951 | 0.949 | 0.955 | 0.956 | 0.968 | 0.973 | 0.972 | 0.983 | 0.989 | |
| 70 | 0.927 | 0.943 | 0.942 | 0.953 | 0.957 | 0.971 | 0.973 | 0.976 | 0.983 | 0.983 | |
| 100 | 0.919 | 0.931 | 0.952 | 0.962 | 0.950 | 0.964 | 0.965 | 0.962 | 0.978 | 0.978 | |
| 200 | 0.916 | 0.947 | 0.943 | 0.941 | 0.953 | 0.958 | 0.960 | 0.950 | 0.963 | 0.968 | |
| 400 | 0.929 | 0.920 | 0.948 | 0.951 | 0.949 | 0.952 | 0.957 | 0.955 | 0.960 | 0.956 | |
| 600 | 0.936 | 0.937 | 0.951 | 0.932 | 0.937 | 0.953 | 0.940 | 0.956 | 0.954 | 0.963 | |
| 800 | 0.909 | 0.949 | 0.935 | 0.947 | 0.940 | 0.956 | 0.953 | 0.961 | 0.953 | 0.957 | |
附表4 研究一平衡设计效应量为0.5时线性混合效应模型水平1自变量固定效应估计准确性
| criteria | I | J | |||||||||
|---|---|---|---|---|---|---|---|---|---|---|---|
| 10 | 20 | 30 | 50 | 70 | 100 | 150 | 200 | 250 | 300 | ||
| bias | 10 | -0.004 | 0.005 | -0.001 | -0.004 | -0.001 | 0.006 | -0.001 | 0.000 | 0.000 | 0.000 |
| 30 | 0.004 | 0.001 | -0.003 | -0.008 | -0.002 | -0.002 | -0.003 | -0.001 | 0.001 | 0.001 | |
| 50 | 0.012 | 0.004 | 0.002 | 0.005 | -0.001 | -0.001 | 0.006 | -0.002 | -0.007 | -0.001 | |
| 70 | 0.001 | -0.002 | -0.010 | -0.001 | -0.009 | -0.001 | -0.001 | 0.001 | 0.002 | 0.002 | |
| 100 | 0.009 | -0.002 | 0.002 | 0.000 | -0.002 | 0.001 | -0.002 | 0.002 | 0.001 | -0.002 | |
| 200 | 0.006 | -0.003 | -0.007 | -0.004 | 0.007 | -0.005 | 0.000 | -0.001 | 0.001 | -0.001 | |
| 400 | 0.013 | 0.013 | -0.004 | -0.002 | 0.004 | -0.002 | -0.001 | -0.001 | 0.000 | 0.001 | |
| 600 | -0.008 | -0.005 | -0.003 | 0.002 | 0.002 | -0.002 | -0.002 | -0.001 | 0.001 | 0.003 | |
| 800 | -0.002 | 0.005 | -0.005 | 0.002 | 0.000 | -0.007 | 0.001 | -0.002 | 0.000 | 0.001 | |
| RMSE | 10 | 0.354 | 0.240 | 0.196 | 0.154 | 0.136 | 0.112 | 0.094 | 0.076 | 0.069 | 0.066 |
| 30 | 0.312 | 0.215 | 0.175 | 0.139 | 0.114 | 0.096 | 0.079 | 0.067 | 0.063 | 0.056 | |
| 50 | 0.297 | 0.207 | 0.173 | 0.132 | 0.110 | 0.091 | 0.077 | 0.069 | 0.059 | 0.055 | |
| 70 | 0.283 | 0.215 | 0.165 | 0.132 | 0.110 | 0.093 | 0.074 | 0.066 | 0.057 | 0.053 | |
| 100 | 0.292 | 0.211 | 0.167 | 0.128 | 0.110 | 0.092 | 0.073 | 0.066 | 0.058 | 0.053 | |
| 200 | 0.280 | 0.195 | 0.166 | 0.129 | 0.106 | 0.088 | 0.075 | 0.066 | 0.058 | 0.052 | |
| 400 | 0.280 | 0.211 | 0.158 | 0.125 | 0.107 | 0.090 | 0.073 | 0.061 | 0.054 | 0.052 | |
| 600 | 0.277 | 0.201 | 0.164 | 0.134 | 0.111 | 0.089 | 0.076 | 0.064 | 0.056 | 0.050 | |
| 800 | 0.282 | 0.195 | 0.162 | 0.127 | 0.108 | 0.087 | 0.072 | 0.063 | 0.058 | 0.052 | |
| CP | 10 | 0.927 | 0.958 | 0.965 | 0.972 | 0.984 | 0.990 | 0.986 | 0.997 | 0.997 | 0.999 |
| 30 | 0.921 | 0.935 | 0.952 | 0.957 | 0.967 | 0.972 | 0.979 | 0.989 | 0.992 | 0.994 | |
| 50 | 0.923 | 0.951 | 0.949 | 0.955 | 0.956 | 0.968 | 0.973 | 0.972 | 0.983 | 0.989 | |
| 70 | 0.927 | 0.943 | 0.942 | 0.953 | 0.957 | 0.971 | 0.973 | 0.976 | 0.983 | 0.983 | |
| 100 | 0.919 | 0.931 | 0.952 | 0.962 | 0.950 | 0.964 | 0.965 | 0.962 | 0.978 | 0.978 | |
| 200 | 0.916 | 0.947 | 0.943 | 0.941 | 0.953 | 0.958 | 0.960 | 0.950 | 0.963 | 0.968 | |
| 400 | 0.929 | 0.920 | 0.948 | 0.951 | 0.949 | 0.952 | 0.957 | 0.955 | 0.960 | 0.956 | |
| 600 | 0.936 | 0.937 | 0.951 | 0.932 | 0.937 | 0.953 | 0.940 | 0.956 | 0.954 | 0.963 | |
| 800 | 0.909 | 0.949 | 0.935 | 0.947 | 0.940 | 0.956 | 0.953 | 0.961 | 0.953 | 0.957 | |
| criteria | I | J | |||||||||
|---|---|---|---|---|---|---|---|---|---|---|---|
| 10 | 20 | 30 | 50 | 70 | 100 | 150 | 200 | 250 | 300 | ||
| bias | 10 | 0.002 | -0.013 | -0.003 | 0.003 | -0.001 | 0.000 | -0.001 | 0.000 | 0.002 | 0.000 |
| 30 | 0.010 | 0.001 | 0.007 | -0.004 | 0.003 | 0.001 | 0.006 | 0.001 | 0.000 | 0.002 | |
| 50 | 0.020 | 0.008 | 0.006 | -0.001 | 0.006 | -0.002 | 0.005 | -0.001 | -0.001 | 0.000 | |
| 70 | -0.001 | -0.007 | 0.002 | -0.009 | 0.001 | 0.005 | 0.001 | 0.002 | -0.003 | 0.002 | |
| 100 | -0.001 | -0.005 | 0.002 | 0.000 | 0.002 | -0.004 | -0.003 | -0.001 | -0.003 | -0.001 | |
| 200 | 0.004 | -0.002 | 0.001 | 0.001 | 0.004 | 0.000 | 0.000 | -0.001 | -0.001 | 0.000 | |
| 400 | -0.006 | 0.002 | -0.003 | 0.000 | -0.006 | -0.002 | 0.001 | 0.000 | -0.002 | 0.000 | |
| 600 | -0.014 | -0.002 | -0.001 | 0.009 | -0.007 | 0.003 | -0.003 | 0.002 | -0.002 | 0.002 | |
| 800 | 0.016 | 0.020 | -0.002 | 0.002 | 0.002 | -0.005 | -0.001 | 0.003 | 0.000 | -0.001 | |
| rbias | 10 | 0.012 | 0.064 | 0.017 | 0.016 | 0.005 | 0.002 | 0.007 | 0.000 | 0.008 | 0.000 |
| 30 | 0.050 | 0.004 | 0.033 | 0.021 | 0.017 | 0.004 | 0.030 | 0.007 | 0.001 | 0.008 | |
| 50 | 0.101 | 0.038 | 0.031 | 0.004 | 0.029 | 0.008 | 0.023 | 0.003 | 0.005 | 0.000 | |
| 70 | 0.003 | 0.033 | 0.009 | 0.047 | 0.005 | 0.024 | 0.005 | 0.012 | 0.016 | 0.012 | |
| 100 | 0.007 | 0.025 | 0.012 | 0.000 | 0.012 | 0.019 | 0.017 | 0.007 | 0.017 | 0.005 | |
| 200 | 0.019 | 0.010 | 0.007 | 0.006 | 0.019 | 0.002 | 0.002 | 0.007 | 0.006 | 0.001 | |
| 400 | 0.032 | 0.009 | 0.015 | 0.002 | 0.029 | 0.008 | 0.005 | 0.002 | 0.011 | 0.001 | |
| 600 | 0.072 | 0.009 | 0.003 | 0.046 | 0.034 | 0.015 | 0.014 | 0.011 | 0.011 | 0.011 | |
| 800 | 0.079 | 0.098 | 0.009 | 0.010 | 0.010 | 0.025 | 0.005 | 0.016 | 0.001 | 0.003 | |
| RMSE | 10 | 0.353 | 0.246 | 0.200 | 0.157 | 0.128 | 0.106 | 0.089 | 0.075 | 0.069 | 0.064 |
| 30 | 0.312 | 0.217 | 0.173 | 0.143 | 0.118 | 0.098 | 0.078 | 0.066 | 0.061 | 0.057 | |
| 50 | 0.308 | 0.208 | 0.172 | 0.131 | 0.113 | 0.093 | 0.078 | 0.069 | 0.058 | 0.054 | |
| 70 | 0.289 | 0.205 | 0.162 | 0.131 | 0.106 | 0.093 | 0.081 | 0.065 | 0.060 | 0.053 | |
| 100 | 0.286 | 0.203 | 0.167 | 0.125 | 0.109 | 0.091 | 0.075 | 0.065 | 0.058 | 0.053 | |
| 200 | 0.285 | 0.204 | 0.167 | 0.131 | 0.110 | 0.087 | 0.074 | 0.063 | 0.058 | 0.054 | |
| 400 | 0.277 | 0.200 | 0.170 | 0.124 | 0.109 | 0.090 | 0.075 | 0.066 | 0.058 | 0.053 | |
| 600 | 0.286 | 0.206 | 0.166 | 0.126 | 0.101 | 0.090 | 0.075 | 0.061 | 0.058 | 0.053 | |
| 800 | 0.280 | 0.201 | 0.167 | 0.131 | 0.107 | 0.085 | 0.075 | 0.060 | 0.055 | 0.053 | |
| width | 10 | 1.421 | 1.032 | 0.866 | 0.711 | 0.632 | 0.569 | 0.508 | 0.477 | 0.460 | 0.443 |
| 30 | 1.191 | 0.872 | 0.722 | 0.571 | 0.500 | 0.435 | 0.377 | 0.343 | 0.322 | 0.306 | |
| 50 | 1.135 | 0.829 | 0.684 | 0.543 | 0.467 | 0.404 | 0.343 | 0.308 | 0.286 | 0.270 | |
| 70 | 1.122 | 0.808 | 0.677 | 0.528 | 0.454 | 0.388 | 0.327 | 0.292 | 0.269 | 0.252 | |
| 100 | 1.118 | 0.795 | 0.665 | 0.518 | 0.445 | 0.377 | 0.316 | 0.279 | 0.255 | 0.239 | |
| 200 | 1.085 | 0.782 | 0.650 | 0.502 | 0.431 | 0.364 | 0.301 | 0.264 | 0.239 | 0.221 | |
| 400 | 1.097 | 0.782 | 0.646 | 0.500 | 0.425 | 0.355 | 0.292 | 0.256 | 0.230 | 0.212 | |
| 600 | 1.084 | 0.783 | 0.642 | 0.494 | 0.421 | 0.354 | 0.291 | 0.253 | 0.228 | 0.209 | |
| 800 | 1.106 | 0.781 | 0.633 | 0.497 | 0.420 | 0.351 | 0.290 | 0.252 | 0.226 | 0.207 | |
| CP | 10 | 0.920 | 0.941 | 0.969 | 0.976 | 0.985 | 0.989 | 0.992 | 0.999 | 0.999 | 1.000 |
| 30 | 0.929 | 0.947 | 0.962 | 0.947 | 0.963 | 0.973 | 0.979 | 0.990 | 0.986 | 0.992 | |
| 50 | 0.909 | 0.937 | 0.942 | 0.958 | 0.964 | 0.972 | 0.960 | 0.969 | 0.983 | 0.986 | |
| 70 | 0.922 | 0.944 | 0.959 | 0.956 | 0.969 | 0.958 | 0.955 | 0.977 | 0.969 | 0.986 | |
| 100 | 0.931 | 0.932 | 0.942 | 0.959 | 0.964 | 0.957 | 0.965 | 0.971 | 0.967 | 0.976 | |
| 200 | 0.916 | 0.935 | 0.942 | 0.944 | 0.946 | 0.967 | 0.962 | 0.968 | 0.957 | 0.959 | |
| 400 | 0.938 | 0.945 | 0.936 | 0.943 | 0.946 | 0.950 | 0.948 | 0.945 | 0.951 | 0.951 | |
| 600 | 0.909 | 0.937 | 0.944 | 0.947 | 0.954 | 0.949 | 0.952 | 0.959 | 0.953 | 0.947 | |
| 800 | 0.910 | 0.950 | 0.941 | 0.938 | 0.946 | 0.953 | 0.944 | 0.967 | 0.965 | 0.955 | |
| 10 | 20 | 30 | 50 | 70 | 100 | 150 | 200 | 250 | 300 | ||
| SE-SD bias | 10 | 0.010 | 0.017 | 0.021 | 0.024 | 0.033 | 0.039 | 0.041 | 0.046 | 0.048 | 0.049 |
| 30 | -0.008 | 0.005 | 0.011 | 0.003 | 0.010 | 0.013 | 0.018 | 0.022 | 0.021 | 0.021 | |
| 50 | -0.017 | 0.003 | 0.002 | 0.008 | 0.006 | 0.010 | 0.010 | 0.009 | 0.015 | 0.015 | |
| 70 | -0.002 | 0.001 | 0.011 | 0.004 | 0.009 | 0.006 | 0.002 | 0.009 | 0.009 | 0.011 | |
| 100 | -0.001 | 0.000 | 0.003 | 0.007 | 0.004 | 0.006 | 0.006 | 0.006 | 0.008 | 0.008 | |
| 200 | -0.008 | -0.005 | -0.002 | -0.003 | 0.000 | 0.005 | 0.003 | 0.004 | 0.003 | 0.002 | |
| 400 | 0.002 | 0.000 | -0.006 | 0.004 | 0.000 | 0.000 | 0.000 | -0.001 | 0.000 | 0.000 | |
| 600 | -0.009 | -0.006 | -0.002 | 0.000 | 0.007 | 0.000 | 0.000 | 0.004 | 0.000 | 0.000 | |
| 800 | 0.002 | -0.001 | -0.005 | -0.004 | 0.000 | 0.004 | -0.001 | 0.005 | 0.002 | 0.000 | |
附表5 研究一平衡设计效应量为0.2时线性混合效应模型水平1自变量固定效应及其标准误估计准确性
| criteria | I | J | |||||||||
|---|---|---|---|---|---|---|---|---|---|---|---|
| 10 | 20 | 30 | 50 | 70 | 100 | 150 | 200 | 250 | 300 | ||
| bias | 10 | 0.002 | -0.013 | -0.003 | 0.003 | -0.001 | 0.000 | -0.001 | 0.000 | 0.002 | 0.000 |
| 30 | 0.010 | 0.001 | 0.007 | -0.004 | 0.003 | 0.001 | 0.006 | 0.001 | 0.000 | 0.002 | |
| 50 | 0.020 | 0.008 | 0.006 | -0.001 | 0.006 | -0.002 | 0.005 | -0.001 | -0.001 | 0.000 | |
| 70 | -0.001 | -0.007 | 0.002 | -0.009 | 0.001 | 0.005 | 0.001 | 0.002 | -0.003 | 0.002 | |
| 100 | -0.001 | -0.005 | 0.002 | 0.000 | 0.002 | -0.004 | -0.003 | -0.001 | -0.003 | -0.001 | |
| 200 | 0.004 | -0.002 | 0.001 | 0.001 | 0.004 | 0.000 | 0.000 | -0.001 | -0.001 | 0.000 | |
| 400 | -0.006 | 0.002 | -0.003 | 0.000 | -0.006 | -0.002 | 0.001 | 0.000 | -0.002 | 0.000 | |
| 600 | -0.014 | -0.002 | -0.001 | 0.009 | -0.007 | 0.003 | -0.003 | 0.002 | -0.002 | 0.002 | |
| 800 | 0.016 | 0.020 | -0.002 | 0.002 | 0.002 | -0.005 | -0.001 | 0.003 | 0.000 | -0.001 | |
| rbias | 10 | 0.012 | 0.064 | 0.017 | 0.016 | 0.005 | 0.002 | 0.007 | 0.000 | 0.008 | 0.000 |
| 30 | 0.050 | 0.004 | 0.033 | 0.021 | 0.017 | 0.004 | 0.030 | 0.007 | 0.001 | 0.008 | |
| 50 | 0.101 | 0.038 | 0.031 | 0.004 | 0.029 | 0.008 | 0.023 | 0.003 | 0.005 | 0.000 | |
| 70 | 0.003 | 0.033 | 0.009 | 0.047 | 0.005 | 0.024 | 0.005 | 0.012 | 0.016 | 0.012 | |
| 100 | 0.007 | 0.025 | 0.012 | 0.000 | 0.012 | 0.019 | 0.017 | 0.007 | 0.017 | 0.005 | |
| 200 | 0.019 | 0.010 | 0.007 | 0.006 | 0.019 | 0.002 | 0.002 | 0.007 | 0.006 | 0.001 | |
| 400 | 0.032 | 0.009 | 0.015 | 0.002 | 0.029 | 0.008 | 0.005 | 0.002 | 0.011 | 0.001 | |
| 600 | 0.072 | 0.009 | 0.003 | 0.046 | 0.034 | 0.015 | 0.014 | 0.011 | 0.011 | 0.011 | |
| 800 | 0.079 | 0.098 | 0.009 | 0.010 | 0.010 | 0.025 | 0.005 | 0.016 | 0.001 | 0.003 | |
| RMSE | 10 | 0.353 | 0.246 | 0.200 | 0.157 | 0.128 | 0.106 | 0.089 | 0.075 | 0.069 | 0.064 |
| 30 | 0.312 | 0.217 | 0.173 | 0.143 | 0.118 | 0.098 | 0.078 | 0.066 | 0.061 | 0.057 | |
| 50 | 0.308 | 0.208 | 0.172 | 0.131 | 0.113 | 0.093 | 0.078 | 0.069 | 0.058 | 0.054 | |
| 70 | 0.289 | 0.205 | 0.162 | 0.131 | 0.106 | 0.093 | 0.081 | 0.065 | 0.060 | 0.053 | |
| 100 | 0.286 | 0.203 | 0.167 | 0.125 | 0.109 | 0.091 | 0.075 | 0.065 | 0.058 | 0.053 | |
| 200 | 0.285 | 0.204 | 0.167 | 0.131 | 0.110 | 0.087 | 0.074 | 0.063 | 0.058 | 0.054 | |
| 400 | 0.277 | 0.200 | 0.170 | 0.124 | 0.109 | 0.090 | 0.075 | 0.066 | 0.058 | 0.053 | |
| 600 | 0.286 | 0.206 | 0.166 | 0.126 | 0.101 | 0.090 | 0.075 | 0.061 | 0.058 | 0.053 | |
| 800 | 0.280 | 0.201 | 0.167 | 0.131 | 0.107 | 0.085 | 0.075 | 0.060 | 0.055 | 0.053 | |
| width | 10 | 1.421 | 1.032 | 0.866 | 0.711 | 0.632 | 0.569 | 0.508 | 0.477 | 0.460 | 0.443 |
| 30 | 1.191 | 0.872 | 0.722 | 0.571 | 0.500 | 0.435 | 0.377 | 0.343 | 0.322 | 0.306 | |
| 50 | 1.135 | 0.829 | 0.684 | 0.543 | 0.467 | 0.404 | 0.343 | 0.308 | 0.286 | 0.270 | |
| 70 | 1.122 | 0.808 | 0.677 | 0.528 | 0.454 | 0.388 | 0.327 | 0.292 | 0.269 | 0.252 | |
| 100 | 1.118 | 0.795 | 0.665 | 0.518 | 0.445 | 0.377 | 0.316 | 0.279 | 0.255 | 0.239 | |
| 200 | 1.085 | 0.782 | 0.650 | 0.502 | 0.431 | 0.364 | 0.301 | 0.264 | 0.239 | 0.221 | |
| 400 | 1.097 | 0.782 | 0.646 | 0.500 | 0.425 | 0.355 | 0.292 | 0.256 | 0.230 | 0.212 | |
| 600 | 1.084 | 0.783 | 0.642 | 0.494 | 0.421 | 0.354 | 0.291 | 0.253 | 0.228 | 0.209 | |
| 800 | 1.106 | 0.781 | 0.633 | 0.497 | 0.420 | 0.351 | 0.290 | 0.252 | 0.226 | 0.207 | |
| CP | 10 | 0.920 | 0.941 | 0.969 | 0.976 | 0.985 | 0.989 | 0.992 | 0.999 | 0.999 | 1.000 |
| 30 | 0.929 | 0.947 | 0.962 | 0.947 | 0.963 | 0.973 | 0.979 | 0.990 | 0.986 | 0.992 | |
| 50 | 0.909 | 0.937 | 0.942 | 0.958 | 0.964 | 0.972 | 0.960 | 0.969 | 0.983 | 0.986 | |
| 70 | 0.922 | 0.944 | 0.959 | 0.956 | 0.969 | 0.958 | 0.955 | 0.977 | 0.969 | 0.986 | |
| 100 | 0.931 | 0.932 | 0.942 | 0.959 | 0.964 | 0.957 | 0.965 | 0.971 | 0.967 | 0.976 | |
| 200 | 0.916 | 0.935 | 0.942 | 0.944 | 0.946 | 0.967 | 0.962 | 0.968 | 0.957 | 0.959 | |
| 400 | 0.938 | 0.945 | 0.936 | 0.943 | 0.946 | 0.950 | 0.948 | 0.945 | 0.951 | 0.951 | |
| 600 | 0.909 | 0.937 | 0.944 | 0.947 | 0.954 | 0.949 | 0.952 | 0.959 | 0.953 | 0.947 | |
| 800 | 0.910 | 0.950 | 0.941 | 0.938 | 0.946 | 0.953 | 0.944 | 0.967 | 0.965 | 0.955 | |
| 10 | 20 | 30 | 50 | 70 | 100 | 150 | 200 | 250 | 300 | ||
| SE-SD bias | 10 | 0.010 | 0.017 | 0.021 | 0.024 | 0.033 | 0.039 | 0.041 | 0.046 | 0.048 | 0.049 |
| 30 | -0.008 | 0.005 | 0.011 | 0.003 | 0.010 | 0.013 | 0.018 | 0.022 | 0.021 | 0.021 | |
| 50 | -0.017 | 0.003 | 0.002 | 0.008 | 0.006 | 0.010 | 0.010 | 0.009 | 0.015 | 0.015 | |
| 70 | -0.002 | 0.001 | 0.011 | 0.004 | 0.009 | 0.006 | 0.002 | 0.009 | 0.009 | 0.011 | |
| 100 | -0.001 | 0.000 | 0.003 | 0.007 | 0.004 | 0.006 | 0.006 | 0.006 | 0.008 | 0.008 | |
| 200 | -0.008 | -0.005 | -0.002 | -0.003 | 0.000 | 0.005 | 0.003 | 0.004 | 0.003 | 0.002 | |
| 400 | 0.002 | 0.000 | -0.006 | 0.004 | 0.000 | 0.000 | 0.000 | -0.001 | 0.000 | 0.000 | |
| 600 | -0.009 | -0.006 | -0.002 | 0.000 | 0.007 | 0.000 | 0.000 | 0.004 | 0.000 | 0.000 | |
| 800 | 0.002 | -0.001 | -0.005 | -0.004 | 0.000 | 0.004 | -0.001 | 0.005 | 0.002 | 0.000 | |
| criteria | I | J | |||||||||
|---|---|---|---|---|---|---|---|---|---|---|---|
| 10 | 20 | 30 | 50 | 70 | 100 | 150 | 200 | 250 | 300 | ||
| bias | 10 | 0.014 | 0.018 | -0.001 | 0.002 | 0.000 | -0.001 | 0.001 | -0.006 | 0.002 | 0.004 |
| 30 | -0.005 | 0.007 | -0.003 | 0.000 | 0.004 | 0.000 | 0.000 | 0.002 | 0.005 | 0.001 | |
| 50 | -0.005 | 0.006 | -0.003 | -0.002 | 0.000 | -0.002 | -0.002 | 0.006 | 0.001 | -0.001 | |
| 70 | 0.000 | 0.014 | -0.001 | 0.001 | 0.003 | -0.004 | -0.002 | 0.002 | -0.001 | 0.000 | |
| 100 | 0.004 | -0.001 | 0.014 | -0.003 | 0.000 | 0.004 | 0.001 | -0.001 | 0.000 | 0.000 | |
| 200 | -0.004 | 0.004 | -0.014 | -0.003 | -0.004 | 0.001 | -0.001 | 0.000 | -0.002 | -0.004 | |
| 400 | -0.003 | 0.004 | 0.004 | -0.005 | 0.003 | -0.001 | 0.000 | 0.000 | -0.001 | 0.000 | |
| 600 | -0.005 | 0.008 | 0.001 | -0.005 | 0.000 | 0.001 | -0.001 | -0.004 | 0.001 | -0.001 | |
| 800 | 0.011 | 0.000 | 0.000 | -0.004 | 0.006 | 0.000 | -0.005 | 0.003 | -0.002 | 0.003 | |
| rbias | 10 | 0.017 | 0.022 | 0.002 | 0.002 | 0.000 | 0.001 | 0.002 | 0.007 | 0.003 | 0.005 |
| 30 | 0.007 | 0.009 | 0.004 | 0.000 | 0.004 | 0.000 | 0.000 | 0.002 | 0.006 | 0.001 | |
| 50 | 0.006 | 0.008 | 0.003 | 0.003 | 0.000 | 0.002 | 0.003 | 0.007 | 0.001 | 0.002 | |
| 70 | 0.000 | 0.018 | 0.002 | 0.001 | 0.004 | 0.005 | 0.002 | 0.002 | 0.001 | 0.000 | |
| 100 | 0.005 | 0.001 | 0.018 | 0.004 | 0.000 | 0.005 | 0.001 | 0.001 | 0.001 | 0.000 | |
| 200 | 0.005 | 0.005 | 0.018 | 0.004 | 0.005 | 0.001 | 0.001 | 0.000 | 0.002 | 0.005 | |
| 400 | 0.004 | 0.005 | 0.005 | 0.007 | 0.003 | 0.001 | 0.000 | 0.000 | 0.001 | 0.001 | |
| 600 | 0.007 | 0.010 | 0.001 | 0.006 | 0.000 | 0.002 | 0.001 | 0.005 | 0.001 | 0.001 | |
| 800 | 0.013 | 0.000 | 0.000 | 0.005 | 0.007 | 0.000 | 0.006 | 0.004 | 0.002 | 0.004 | |
| RMSE | 10 | 0.334 | 0.247 | 0.195 | 0.154 | 0.126 | 0.107 | 0.087 | 0.077 | 0.069 | 0.062 |
| 30 | 0.316 | 0.216 | 0.175 | 0.139 | 0.116 | 0.099 | 0.081 | 0.068 | 0.060 | 0.056 | |
| 50 | 0.300 | 0.217 | 0.171 | 0.133 | 0.116 | 0.095 | 0.074 | 0.067 | 0.058 | 0.055 | |
| 70 | 0.289 | 0.214 | 0.165 | 0.125 | 0.114 | 0.095 | 0.076 | 0.066 | 0.058 | 0.054 | |
| 100 | 0.294 | 0.208 | 0.167 | 0.128 | 0.113 | 0.094 | 0.078 | 0.067 | 0.057 | 0.051 | |
| 200 | 0.286 | 0.206 | 0.168 | 0.130 | 0.112 | 0.091 | 0.071 | 0.065 | 0.058 | 0.052 | |
| 400 | 0.268 | 0.200 | 0.163 | 0.132 | 0.111 | 0.089 | 0.075 | 0.062 | 0.057 | 0.052 | |
| 600 | 0.283 | 0.198 | 0.164 | 0.127 | 0.113 | 0.087 | 0.075 | 0.063 | 0.055 | 0.052 | |
| 800 | 0.287 | 0.204 | 0.171 | 0.123 | 0.107 | 0.094 | 0.078 | 0.062 | 0.056 | 0.052 | |
| 10 | 20 | 30 | 50 | 70 | 100 | 150 | 200 | 250 | 300 | ||
| width | 10 | 1.405 | 1.030 | 0.868 | 0.709 | 0.627 | 0.561 | 0.508 | 0.481 | 0.458 | 0.447 |
| 30 | 1.405 | 0.872 | 0.868 | 0.709 | 0.627 | 0.561 | 0.508 | 0.481 | 0.458 | 0.447 | |
| 50 | 1.135 | 0.831 | 0.686 | 0.545 | 0.467 | 0.402 | 0.342 | 0.309 | 0.286 | 0.269 | |
| 70 | 1.130 | 0.820 | 0.671 | 0.531 | 0.453 | 0.389 | 0.327 | 0.292 | 0.269 | 0.252 | |
| 100 | 1.104 | 0.805 | 0.658 | 0.518 | 0.443 | 0.376 | 0.315 | 0.280 | 0.256 | 0.238 | |
| 200 | 1.102 | 0.784 | 0.648 | 0.510 | 0.428 | 0.363 | 0.302 | 0.264 | 0.239 | 0.221 | |
| 400 | 1.086 | 0.781 | 0.640 | 0.502 | 0.425 | 0.357 | 0.293 | 0.256 | 0.230 | 0.212 | |
| 600 | 1.096 | 0.781 | 0.641 | 0.498 | 0.423 | 0.354 | 0.292 | 0.253 | 0.227 | 0.209 | |
| 800 | 1.078 | 0.779 | 0.640 | 0.494 | 0.421 | 0.354 | 0.290 | 0.252 | 0.225 | 0.208 | |
| CP | 10 | 0.948 | 0.951 | 0.974 | 0.977 | 0.982 | 0.990 | 0.995 | 0.996 | 0.998 | 1.000 |
| 30 | 0.913 | 0.951 | 0.947 | 0.964 | 0.973 | 0.973 | 0.974 | 0.993 | 0.993 | 0.995 | |
| 50 | 0.918 | 0.929 | 0.947 | 0.948 | 0.960 | 0.968 | 0.976 | 0.984 | 0.987 | 0.983 | |
| 70 | 0.919 | 0.935 | 0.954 | 0.966 | 0.954 | 0.960 | 0.969 | 0.967 | 0.978 | 0.982 | |
| 100 | 0.901 | 0.937 | 0.933 | 0.943 | 0.955 | 0.954 | 0.958 | 0.958 | 0.979 | 0.984 | |
| 200 | 0.920 | 0.933 | 0.942 | 0.944 | 0.944 | 0.953 | 0.958 | 0.956 | 0.960 | 0.963 | |
| 400 | 0.937 | 0.940 | 0.938 | 0.939 | 0.943 | 0.949 | 0.958 | 0.955 | 0.956 | 0.962 | |
| 600 | 0.921 | 0.933 | 0.926 | 0.943 | 0.941 | 0.952 | 0.948 | 0.949 | 0.970 | 0.955 | |
| 800 | 0.916 | 0.924 | 0.941 | 0.953 | 0.953 | 0.935 | 0.930 | 0.950 | 0.959 | 0.956 | |
| SE-SD bias | 10 | 0.024 | 0.016 | 0.027 | 0.027 | 0.034 | 0.036 | 0.042 | 0.046 | 0.048 | 0.052 |
| 30 | -0.011 | 0.007 | 0.008 | 0.007 | 0.012 | 0.012 | 0.015 | 0.019 | 0.022 | 0.022 | |
| 50 | -0.010 | -0.005 | 0.004 | 0.005 | 0.003 | 0.007 | 0.013 | 0.013 | 0.015 | 0.014 | |
| 70 | 0.000 | -0.005 | 0.006 | 0.010 | 0.002 | 0.004 | 0.008 | 0.009 | 0.010 | 0.010 | |
| 100 | -0.013 | -0.002 | 0.001 | 0.004 | 0.000 | 0.002 | 0.003 | 0.004 | 0.009 | 0.010 | |
| 200 | -0.005 | -0.006 | -0.002 | 0.000 | -0.003 | 0.002 | 0.006 | 0.002 | 0.003 | 0.005 | |
| 400 | 0.009 | -0.001 | 0.000 | -0.005 | -0.003 | 0.002 | 0.000 | 0.003 | 0.001 | 0.002 | |
| 600 | -0.003 | 0.001 | -0.001 | 0.000 | -0.005 | 0.003 | -0.001 | 0.002 | 0.003 | 0.001 | |
| 800 | -0.012 | -0.005 | -0.008 | 0.003 | 0.001 | -0.003 | -0.004 | 0.002 | 0.001 | 0.001 | |
附表6 研究一平衡设计效应量为0.8时线性混合效应模型水平1自变量固定效应及其标准误估计准确性
| criteria | I | J | |||||||||
|---|---|---|---|---|---|---|---|---|---|---|---|
| 10 | 20 | 30 | 50 | 70 | 100 | 150 | 200 | 250 | 300 | ||
| bias | 10 | 0.014 | 0.018 | -0.001 | 0.002 | 0.000 | -0.001 | 0.001 | -0.006 | 0.002 | 0.004 |
| 30 | -0.005 | 0.007 | -0.003 | 0.000 | 0.004 | 0.000 | 0.000 | 0.002 | 0.005 | 0.001 | |
| 50 | -0.005 | 0.006 | -0.003 | -0.002 | 0.000 | -0.002 | -0.002 | 0.006 | 0.001 | -0.001 | |
| 70 | 0.000 | 0.014 | -0.001 | 0.001 | 0.003 | -0.004 | -0.002 | 0.002 | -0.001 | 0.000 | |
| 100 | 0.004 | -0.001 | 0.014 | -0.003 | 0.000 | 0.004 | 0.001 | -0.001 | 0.000 | 0.000 | |
| 200 | -0.004 | 0.004 | -0.014 | -0.003 | -0.004 | 0.001 | -0.001 | 0.000 | -0.002 | -0.004 | |
| 400 | -0.003 | 0.004 | 0.004 | -0.005 | 0.003 | -0.001 | 0.000 | 0.000 | -0.001 | 0.000 | |
| 600 | -0.005 | 0.008 | 0.001 | -0.005 | 0.000 | 0.001 | -0.001 | -0.004 | 0.001 | -0.001 | |
| 800 | 0.011 | 0.000 | 0.000 | -0.004 | 0.006 | 0.000 | -0.005 | 0.003 | -0.002 | 0.003 | |
| rbias | 10 | 0.017 | 0.022 | 0.002 | 0.002 | 0.000 | 0.001 | 0.002 | 0.007 | 0.003 | 0.005 |
| 30 | 0.007 | 0.009 | 0.004 | 0.000 | 0.004 | 0.000 | 0.000 | 0.002 | 0.006 | 0.001 | |
| 50 | 0.006 | 0.008 | 0.003 | 0.003 | 0.000 | 0.002 | 0.003 | 0.007 | 0.001 | 0.002 | |
| 70 | 0.000 | 0.018 | 0.002 | 0.001 | 0.004 | 0.005 | 0.002 | 0.002 | 0.001 | 0.000 | |
| 100 | 0.005 | 0.001 | 0.018 | 0.004 | 0.000 | 0.005 | 0.001 | 0.001 | 0.001 | 0.000 | |
| 200 | 0.005 | 0.005 | 0.018 | 0.004 | 0.005 | 0.001 | 0.001 | 0.000 | 0.002 | 0.005 | |
| 400 | 0.004 | 0.005 | 0.005 | 0.007 | 0.003 | 0.001 | 0.000 | 0.000 | 0.001 | 0.001 | |
| 600 | 0.007 | 0.010 | 0.001 | 0.006 | 0.000 | 0.002 | 0.001 | 0.005 | 0.001 | 0.001 | |
| 800 | 0.013 | 0.000 | 0.000 | 0.005 | 0.007 | 0.000 | 0.006 | 0.004 | 0.002 | 0.004 | |
| RMSE | 10 | 0.334 | 0.247 | 0.195 | 0.154 | 0.126 | 0.107 | 0.087 | 0.077 | 0.069 | 0.062 |
| 30 | 0.316 | 0.216 | 0.175 | 0.139 | 0.116 | 0.099 | 0.081 | 0.068 | 0.060 | 0.056 | |
| 50 | 0.300 | 0.217 | 0.171 | 0.133 | 0.116 | 0.095 | 0.074 | 0.067 | 0.058 | 0.055 | |
| 70 | 0.289 | 0.214 | 0.165 | 0.125 | 0.114 | 0.095 | 0.076 | 0.066 | 0.058 | 0.054 | |
| 100 | 0.294 | 0.208 | 0.167 | 0.128 | 0.113 | 0.094 | 0.078 | 0.067 | 0.057 | 0.051 | |
| 200 | 0.286 | 0.206 | 0.168 | 0.130 | 0.112 | 0.091 | 0.071 | 0.065 | 0.058 | 0.052 | |
| 400 | 0.268 | 0.200 | 0.163 | 0.132 | 0.111 | 0.089 | 0.075 | 0.062 | 0.057 | 0.052 | |
| 600 | 0.283 | 0.198 | 0.164 | 0.127 | 0.113 | 0.087 | 0.075 | 0.063 | 0.055 | 0.052 | |
| 800 | 0.287 | 0.204 | 0.171 | 0.123 | 0.107 | 0.094 | 0.078 | 0.062 | 0.056 | 0.052 | |
| 10 | 20 | 30 | 50 | 70 | 100 | 150 | 200 | 250 | 300 | ||
| width | 10 | 1.405 | 1.030 | 0.868 | 0.709 | 0.627 | 0.561 | 0.508 | 0.481 | 0.458 | 0.447 |
| 30 | 1.405 | 0.872 | 0.868 | 0.709 | 0.627 | 0.561 | 0.508 | 0.481 | 0.458 | 0.447 | |
| 50 | 1.135 | 0.831 | 0.686 | 0.545 | 0.467 | 0.402 | 0.342 | 0.309 | 0.286 | 0.269 | |
| 70 | 1.130 | 0.820 | 0.671 | 0.531 | 0.453 | 0.389 | 0.327 | 0.292 | 0.269 | 0.252 | |
| 100 | 1.104 | 0.805 | 0.658 | 0.518 | 0.443 | 0.376 | 0.315 | 0.280 | 0.256 | 0.238 | |
| 200 | 1.102 | 0.784 | 0.648 | 0.510 | 0.428 | 0.363 | 0.302 | 0.264 | 0.239 | 0.221 | |
| 400 | 1.086 | 0.781 | 0.640 | 0.502 | 0.425 | 0.357 | 0.293 | 0.256 | 0.230 | 0.212 | |
| 600 | 1.096 | 0.781 | 0.641 | 0.498 | 0.423 | 0.354 | 0.292 | 0.253 | 0.227 | 0.209 | |
| 800 | 1.078 | 0.779 | 0.640 | 0.494 | 0.421 | 0.354 | 0.290 | 0.252 | 0.225 | 0.208 | |
| CP | 10 | 0.948 | 0.951 | 0.974 | 0.977 | 0.982 | 0.990 | 0.995 | 0.996 | 0.998 | 1.000 |
| 30 | 0.913 | 0.951 | 0.947 | 0.964 | 0.973 | 0.973 | 0.974 | 0.993 | 0.993 | 0.995 | |
| 50 | 0.918 | 0.929 | 0.947 | 0.948 | 0.960 | 0.968 | 0.976 | 0.984 | 0.987 | 0.983 | |
| 70 | 0.919 | 0.935 | 0.954 | 0.966 | 0.954 | 0.960 | 0.969 | 0.967 | 0.978 | 0.982 | |
| 100 | 0.901 | 0.937 | 0.933 | 0.943 | 0.955 | 0.954 | 0.958 | 0.958 | 0.979 | 0.984 | |
| 200 | 0.920 | 0.933 | 0.942 | 0.944 | 0.944 | 0.953 | 0.958 | 0.956 | 0.960 | 0.963 | |
| 400 | 0.937 | 0.940 | 0.938 | 0.939 | 0.943 | 0.949 | 0.958 | 0.955 | 0.956 | 0.962 | |
| 600 | 0.921 | 0.933 | 0.926 | 0.943 | 0.941 | 0.952 | 0.948 | 0.949 | 0.970 | 0.955 | |
| 800 | 0.916 | 0.924 | 0.941 | 0.953 | 0.953 | 0.935 | 0.930 | 0.950 | 0.959 | 0.956 | |
| SE-SD bias | 10 | 0.024 | 0.016 | 0.027 | 0.027 | 0.034 | 0.036 | 0.042 | 0.046 | 0.048 | 0.052 |
| 30 | -0.011 | 0.007 | 0.008 | 0.007 | 0.012 | 0.012 | 0.015 | 0.019 | 0.022 | 0.022 | |
| 50 | -0.010 | -0.005 | 0.004 | 0.005 | 0.003 | 0.007 | 0.013 | 0.013 | 0.015 | 0.014 | |
| 70 | 0.000 | -0.005 | 0.006 | 0.010 | 0.002 | 0.004 | 0.008 | 0.009 | 0.010 | 0.010 | |
| 100 | -0.013 | -0.002 | 0.001 | 0.004 | 0.000 | 0.002 | 0.003 | 0.004 | 0.009 | 0.010 | |
| 200 | -0.005 | -0.006 | -0.002 | 0.000 | -0.003 | 0.002 | 0.006 | 0.002 | 0.003 | 0.005 | |
| 400 | 0.009 | -0.001 | 0.000 | -0.005 | -0.003 | 0.002 | 0.000 | 0.003 | 0.001 | 0.002 | |
| 600 | -0.003 | 0.001 | -0.001 | 0.000 | -0.005 | 0.003 | -0.001 | 0.002 | 0.003 | 0.001 | |
| 800 | -0.012 | -0.005 | -0.008 | 0.003 | 0.001 | -0.003 | -0.004 | 0.002 | 0.001 | 0.001 | |
| criteria | I | J | |||||||||
|---|---|---|---|---|---|---|---|---|---|---|---|
| 10 | 20 | 30 | 50 | 70 | 100 | 150 | 200 | 250 | 300 | ||
| bias | 10 | -0.012 | -0.009 | 0.000 | 0.001 | 0.004 | 0.003 | 0.004 | 0.001 | -0.004 | -0.002 |
| 30 | 0.001 | 0.008 | -0.004 | 0.004 | 0.000 | 0.001 | 0.002 | -0.001 | 0.005 | -0.002 | |
| 50 | -0.001 | -0.004 | -0.001 | -0.003 | 0.002 | 0.000 | -0.002 | 0.001 | 0.001 | -0.003 | |
| 70 | 0.007 | -0.003 | -0.005 | -0.002 | 0.002 | 0.000 | 0.003 | 0.004 | 0.000 | -0.002 | |
| 100 | -0.005 | -0.003 | -0.002 | -0.002 | 0.002 | -0.005 | -0.005 | 0.001 | 0.002 | 0.003 | |
| 200 | 0.005 | 0.000 | -0.008 | -0.004 | -0.003 | -0.002 | 0.002 | -0.003 | 0.003 | 0.001 | |
| 400 | 0.026 | -0.010 | 0.002 | 0.001 | 0.002 | 0.000 | 0.001 | -0.005 | 0.002 | -0.001 | |
| 600 | 0.010 | 0.010 | -0.006 | 0.000 | -0.003 | 0.003 | 0.000 | 0.000 | -0.001 | 0.000 | |
| 800 | -0.016 | 0.003 | 0.001 | 0.003 | 0.000 | 0.003 | 0.005 | -0.002 | 0.000 | -0.005 | |
| rbias | 10 | 0.024 | 0.018 | 0.000 | 0.002 | 0.009 | 0.006 | 0.009 | 0.002 | 0.008 | 0.003 |
| 30 | 0.001 | 0.015 | 0.008 | 0.009 | 0.000 | 0.003 | 0.005 | 0.002 | 0.009 | 0.003 | |
| 50 | 0.002 | 0.008 | 0.001 | 0.007 | 0.004 | 0.001 | 0.003 | 0.003 | 0.001 | 0.006 | |
| 70 | 0.014 | 0.005 | 0.009 | 0.004 | 0.003 | 0.001 | 0.007 | 0.008 | 0.001 | 0.004 | |
| 100 | 0.011 | 0.007 | 0.004 | 0.004 | 0.003 | 0.010 | 0.010 | 0.003 | 0.004 | 0.005 | |
| 200 | 0.011 | 0.001 | 0.017 | 0.007 | 0.007 | 0.003 | 0.004 | 0.006 | 0.005 | 0.001 | |
| 400 | 0.052 | 0.019 | 0.004 | 0.002 | 0.003 | 0.000 | 0.002 | 0.010 | 0.003 | 0.002 | |
| 600 | 0.020 | 0.019 | 0.013 | 0.001 | 0.006 | 0.005 | 0.000 | 0.000 | 0.002 | 0.001 | |
| 800 | 0.033 | 0.007 | 0.001 | 0.006 | 0.001 | 0.006 | 0.009 | 0.005 | 0.001 | 0.009 | |
| RMSE | 10 | 0.424 | 0.311 | 0.248 | 0.180 | 0.162 | 0.134 | 0.113 | 0.097 | 0.087 | 0.078 |
| 30 | 0.390 | 0.269 | 0.221 | 0.173 | 0.146 | 0.121 | 0.095 | 0.071 | 0.075 | 0.069 | |
| 50 | 0.375 | 0.259 | 0.205 | 0.167 | 0.139 | 0.117 | 0.096 | 0.084 | 0.072 | 0.066 | |
| 70 | 0.363 | 0.255 | 0.213 | 0.164 | 0.137 | 0.111 | 0.097 | 0.079 | 0.072 | 0.065 | |
| 100 | 0.344 | 0.251 | 0.205 | 0.161 | 0.134 | 0.116 | 0.092 | 0.080 | 0.072 | 0.068 | |
| 200 | 0.358 | 0.254 | 0.212 | 0.153 | 0.136 | 0.113 | 0.094 | 0.077 | 0.072 | 0.061 | |
| 400 | 0.366 | 0.254 | 0.204 | 0.158 | 0.133 | 0.114 | 0.093 | 0.081 | 0.070 | 0.066 | |
| 600 | 0.355 | 0.254 | 0.208 | 0.162 | 0.138 | 0.110 | 0.091 | 0.079 | 0.068 | 0.066 | |
| 800 | 0.355 | 0.245 | 0.208 | 0.154 | 0.132 | 0.111 | 0.086 | 0.077 | 0.069 | 0.064 | |
| width | 10 | 1.736 | 1.272 | 1.056 | 0.846 | 0.740 | 0.649 | 0.575 | 0.525 | 0.501 | 0.480 |
| 30 | 1.488 | 1.071 | 0.879 | 0.698 | 0.604 | 0.520 | 0.440 | 0.347 | 0.368 | 0.347 | |
| 50 | 1.395 | 1.027 | 0.849 | 0.668 | 0.573 | 0.487 | 0.410 | 0.365 | 0.335 | 0.313 | |
| 70 | 1.402 | 1.008 | 0.834 | 0.654 | 0.557 | 0.474 | 0.396 | 0.349 | 0.319 | 0.297 | |
| 100 | 1.393 | 0.990 | 0.822 | 0.643 | 0.548 | 0.464 | 0.384 | 0.337 | 0.307 | 0.284 | |
| 200 | 1.352 | 0.993 | 0.804 | 0.629 | 0.534 | 0.451 | 0.369 | 0.324 | 0.292 | 0.270 | |
| 400 | 1.363 | 0.969 | 0.807 | 0.620 | 0.525 | 0.442 | 0.364 | 0.317 | 0.284 | 0.261 | |
| 600 | 1.364 | 0.975 | 0.796 | 0.623 | 0.527 | 0.441 | 0.363 | 0.314 | 0.282 | 0.258 | |
| 800 | 1.357 | 0.975 | 0.793 | 0.622 | 0.524 | 0.442 | 0.361 | 0.313 | 0.280 | 0.256 | |
| CP | 10 | 0.944 | 0.947 | 0.961 | 0.979 | 0.972 | 0.977 | 0.984 | 0.989 | 0.993 | 1.000 |
| 30 | 0.917 | 0.944 | 0.947 | 0.957 | 0.963 | 0.971 | 0.979 | 0.985 | 0.988 | 0.988 | |
| 50 | 0.909 | 0.948 | 0.951 | 0.953 | 0.957 | 0.962 | 0.965 | 0.968 | 0.980 | 0.979 | |
| 70 | 0.915 | 0.938 | 0.940 | 0.955 | 0.960 | 0.973 | 0.963 | 0.974 | 0.974 | 0.976 | |
| 100 | 0.927 | 0.936 | 0.951 | 0.946 | 0.952 | 0.948 | 0.965 | 0.959 | 0.970 | 0.964 | |
| 200 | 0.917 | 0.941 | 0.925 | 0.953 | 0.954 | 0.949 | 0.943 | 0.969 | 0.949 | 0.973 | |
| 400 | 0.921 | 0.937 | 0.947 | 0.941 | 0.956 | 0.947 | 0.949 | 0.947 | 0.951 | 0.952 | |
| 600 | 0.914 | 0.928 | 0.941 | 0.931 | 0.938 | 0.955 | 0.949 | 0.946 | 0.950 | 0.942 | |
| 800 | 0.904 | 0.932 | 0.930 | 0.952 | 0.946 | 0.953 | 0.965 | 0.956 | 0.950 | 0.954 | |
| SE-SD bias | 10 | 0.019 | 0.014 | 0.021 | 0.036 | 0.027 | 0.032 | 0.034 | 0.036 | 0.041 | 0.045 |
| 30 | -0.011 | 0.004 | 0.003 | 0.005 | 0.008 | 0.011 | 0.017 | 0.018 | 0.019 | 0.020 | |
| 50 | -0.020 | 0.003 | 0.012 | 0.003 | 0.007 | 0.007 | 0.009 | 0.009 | 0.014 | 0.014 | |
| 70 | -0.006 | 0.002 | -0.001 | 0.002 | 0.005 | 0.010 | 0.004 | 0.010 | 0.009 | 0.010 | |
| 100 | 0.012 | 0.002 | 0.004 | 0.003 | 0.005 | 0.002 | 0.006 | 0.006 | 0.007 | 0.005 | |
| 200 | -0.013 | -0.001 | -0.007 | 0.008 | 0.001 | 0.002 | 0.001 | 0.005 | 0.002 | 0.008 | |
| 400 | -0.017 | -0.007 | 0.001 | 0.000 | 0.001 | -0.001 | -0.001 | 0.000 | 0.002 | 0.001 | |
| 600 | -0.007 | -0.006 | -0.004 | -0.003 | -0.003 | 0.002 | 0.002 | 0.001 | 0.004 | 0.000 | |
| 800 | -0.008 | 0.003 | -0.006 | 0.005 | 0.001 | 0.002 | 0.006 | 0.003 | 0.003 | 0.001 | |
附表7 研究一非平衡设计效应量为0.5时线性混合效应模型水平1自变量固定效应及其标准误估计准确性
| criteria | I | J | |||||||||
|---|---|---|---|---|---|---|---|---|---|---|---|
| 10 | 20 | 30 | 50 | 70 | 100 | 150 | 200 | 250 | 300 | ||
| bias | 10 | -0.012 | -0.009 | 0.000 | 0.001 | 0.004 | 0.003 | 0.004 | 0.001 | -0.004 | -0.002 |
| 30 | 0.001 | 0.008 | -0.004 | 0.004 | 0.000 | 0.001 | 0.002 | -0.001 | 0.005 | -0.002 | |
| 50 | -0.001 | -0.004 | -0.001 | -0.003 | 0.002 | 0.000 | -0.002 | 0.001 | 0.001 | -0.003 | |
| 70 | 0.007 | -0.003 | -0.005 | -0.002 | 0.002 | 0.000 | 0.003 | 0.004 | 0.000 | -0.002 | |
| 100 | -0.005 | -0.003 | -0.002 | -0.002 | 0.002 | -0.005 | -0.005 | 0.001 | 0.002 | 0.003 | |
| 200 | 0.005 | 0.000 | -0.008 | -0.004 | -0.003 | -0.002 | 0.002 | -0.003 | 0.003 | 0.001 | |
| 400 | 0.026 | -0.010 | 0.002 | 0.001 | 0.002 | 0.000 | 0.001 | -0.005 | 0.002 | -0.001 | |
| 600 | 0.010 | 0.010 | -0.006 | 0.000 | -0.003 | 0.003 | 0.000 | 0.000 | -0.001 | 0.000 | |
| 800 | -0.016 | 0.003 | 0.001 | 0.003 | 0.000 | 0.003 | 0.005 | -0.002 | 0.000 | -0.005 | |
| rbias | 10 | 0.024 | 0.018 | 0.000 | 0.002 | 0.009 | 0.006 | 0.009 | 0.002 | 0.008 | 0.003 |
| 30 | 0.001 | 0.015 | 0.008 | 0.009 | 0.000 | 0.003 | 0.005 | 0.002 | 0.009 | 0.003 | |
| 50 | 0.002 | 0.008 | 0.001 | 0.007 | 0.004 | 0.001 | 0.003 | 0.003 | 0.001 | 0.006 | |
| 70 | 0.014 | 0.005 | 0.009 | 0.004 | 0.003 | 0.001 | 0.007 | 0.008 | 0.001 | 0.004 | |
| 100 | 0.011 | 0.007 | 0.004 | 0.004 | 0.003 | 0.010 | 0.010 | 0.003 | 0.004 | 0.005 | |
| 200 | 0.011 | 0.001 | 0.017 | 0.007 | 0.007 | 0.003 | 0.004 | 0.006 | 0.005 | 0.001 | |
| 400 | 0.052 | 0.019 | 0.004 | 0.002 | 0.003 | 0.000 | 0.002 | 0.010 | 0.003 | 0.002 | |
| 600 | 0.020 | 0.019 | 0.013 | 0.001 | 0.006 | 0.005 | 0.000 | 0.000 | 0.002 | 0.001 | |
| 800 | 0.033 | 0.007 | 0.001 | 0.006 | 0.001 | 0.006 | 0.009 | 0.005 | 0.001 | 0.009 | |
| RMSE | 10 | 0.424 | 0.311 | 0.248 | 0.180 | 0.162 | 0.134 | 0.113 | 0.097 | 0.087 | 0.078 |
| 30 | 0.390 | 0.269 | 0.221 | 0.173 | 0.146 | 0.121 | 0.095 | 0.071 | 0.075 | 0.069 | |
| 50 | 0.375 | 0.259 | 0.205 | 0.167 | 0.139 | 0.117 | 0.096 | 0.084 | 0.072 | 0.066 | |
| 70 | 0.363 | 0.255 | 0.213 | 0.164 | 0.137 | 0.111 | 0.097 | 0.079 | 0.072 | 0.065 | |
| 100 | 0.344 | 0.251 | 0.205 | 0.161 | 0.134 | 0.116 | 0.092 | 0.080 | 0.072 | 0.068 | |
| 200 | 0.358 | 0.254 | 0.212 | 0.153 | 0.136 | 0.113 | 0.094 | 0.077 | 0.072 | 0.061 | |
| 400 | 0.366 | 0.254 | 0.204 | 0.158 | 0.133 | 0.114 | 0.093 | 0.081 | 0.070 | 0.066 | |
| 600 | 0.355 | 0.254 | 0.208 | 0.162 | 0.138 | 0.110 | 0.091 | 0.079 | 0.068 | 0.066 | |
| 800 | 0.355 | 0.245 | 0.208 | 0.154 | 0.132 | 0.111 | 0.086 | 0.077 | 0.069 | 0.064 | |
| width | 10 | 1.736 | 1.272 | 1.056 | 0.846 | 0.740 | 0.649 | 0.575 | 0.525 | 0.501 | 0.480 |
| 30 | 1.488 | 1.071 | 0.879 | 0.698 | 0.604 | 0.520 | 0.440 | 0.347 | 0.368 | 0.347 | |
| 50 | 1.395 | 1.027 | 0.849 | 0.668 | 0.573 | 0.487 | 0.410 | 0.365 | 0.335 | 0.313 | |
| 70 | 1.402 | 1.008 | 0.834 | 0.654 | 0.557 | 0.474 | 0.396 | 0.349 | 0.319 | 0.297 | |
| 100 | 1.393 | 0.990 | 0.822 | 0.643 | 0.548 | 0.464 | 0.384 | 0.337 | 0.307 | 0.284 | |
| 200 | 1.352 | 0.993 | 0.804 | 0.629 | 0.534 | 0.451 | 0.369 | 0.324 | 0.292 | 0.270 | |
| 400 | 1.363 | 0.969 | 0.807 | 0.620 | 0.525 | 0.442 | 0.364 | 0.317 | 0.284 | 0.261 | |
| 600 | 1.364 | 0.975 | 0.796 | 0.623 | 0.527 | 0.441 | 0.363 | 0.314 | 0.282 | 0.258 | |
| 800 | 1.357 | 0.975 | 0.793 | 0.622 | 0.524 | 0.442 | 0.361 | 0.313 | 0.280 | 0.256 | |
| CP | 10 | 0.944 | 0.947 | 0.961 | 0.979 | 0.972 | 0.977 | 0.984 | 0.989 | 0.993 | 1.000 |
| 30 | 0.917 | 0.944 | 0.947 | 0.957 | 0.963 | 0.971 | 0.979 | 0.985 | 0.988 | 0.988 | |
| 50 | 0.909 | 0.948 | 0.951 | 0.953 | 0.957 | 0.962 | 0.965 | 0.968 | 0.980 | 0.979 | |
| 70 | 0.915 | 0.938 | 0.940 | 0.955 | 0.960 | 0.973 | 0.963 | 0.974 | 0.974 | 0.976 | |
| 100 | 0.927 | 0.936 | 0.951 | 0.946 | 0.952 | 0.948 | 0.965 | 0.959 | 0.970 | 0.964 | |
| 200 | 0.917 | 0.941 | 0.925 | 0.953 | 0.954 | 0.949 | 0.943 | 0.969 | 0.949 | 0.973 | |
| 400 | 0.921 | 0.937 | 0.947 | 0.941 | 0.956 | 0.947 | 0.949 | 0.947 | 0.951 | 0.952 | |
| 600 | 0.914 | 0.928 | 0.941 | 0.931 | 0.938 | 0.955 | 0.949 | 0.946 | 0.950 | 0.942 | |
| 800 | 0.904 | 0.932 | 0.930 | 0.952 | 0.946 | 0.953 | 0.965 | 0.956 | 0.950 | 0.954 | |
| SE-SD bias | 10 | 0.019 | 0.014 | 0.021 | 0.036 | 0.027 | 0.032 | 0.034 | 0.036 | 0.041 | 0.045 |
| 30 | -0.011 | 0.004 | 0.003 | 0.005 | 0.008 | 0.011 | 0.017 | 0.018 | 0.019 | 0.020 | |
| 50 | -0.020 | 0.003 | 0.012 | 0.003 | 0.007 | 0.007 | 0.009 | 0.009 | 0.014 | 0.014 | |
| 70 | -0.006 | 0.002 | -0.001 | 0.002 | 0.005 | 0.010 | 0.004 | 0.010 | 0.009 | 0.010 | |
| 100 | 0.012 | 0.002 | 0.004 | 0.003 | 0.005 | 0.002 | 0.006 | 0.006 | 0.007 | 0.005 | |
| 200 | -0.013 | -0.001 | -0.007 | 0.008 | 0.001 | 0.002 | 0.001 | 0.005 | 0.002 | 0.008 | |
| 400 | -0.017 | -0.007 | 0.001 | 0.000 | 0.001 | -0.001 | -0.001 | 0.000 | 0.002 | 0.001 | |
| 600 | -0.007 | -0.006 | -0.004 | -0.003 | -0.003 | 0.002 | 0.002 | 0.001 | 0.004 | 0.000 | |
| 800 | -0.008 | 0.003 | -0.006 | 0.005 | 0.001 | 0.002 | 0.006 | 0.003 | 0.003 | 0.001 | |
| Parameter | I | J | |||||||||
|---|---|---|---|---|---|---|---|---|---|---|---|
| 10 | 20 | 30 | 50 | 70 | 100 | 150 | 200 | 250 | 300 | ||
| 10 | 0.063 | 0.036 | 0.028 | 0.019 | 0.016 | 0.013 | 0.010 | 0.009 | 0.008 | 0.007 | |
| 30 | 0.033 | 0.017 | 0.012 | 0.008 | 0.006 | 0.005 | 0.004 | 0.003 | 0.003 | 0.003 | |
| 50 | 0.024 | 0.013 | 0.009 | 0.006 | 0.004 | 0.003 | 0.002 | 0.002 | 0.002 | 0.002 | |
| 70 | 0.021 | 0.011 | 0.007 | 0.005 | 0.003 | 0.003 | 0.002 | 0.001 | 0.001 | 0.001 | |
| 100 | 0.017 | 0.008 | 0.006 | 0.004 | 0.003 | 0.002 | 0.001 | 0.001 | 0.001 | 0.001 | |
| 200 | 0.013 | 0.006 | 0.004 | 0.002 | 0.002 | 0.001 | 0.001 | 0.001 | 0.001 | 0.000 | |
| 400 | 0.009 | 0.004 | 0.003 | 0.002 | 0.001 | 0.001 | 0.001 | 0.000 | 0.000 | 0.000 | |
| 600 | 0.008 | 0.004 | 0.002 | 0.001 | 0.001 | 0.001 | 0.000 | 0.000 | 0.000 | 0.000 | |
| 800 | 0.006 | 0.003 | 0.002 | 0.001 | 0.001 | 0.001 | 0.000 | 0.000 | 0.000 | 0.000 | |
| 10 | 0.405 | 0.283 | 0.212 | 0.174 | 0.149 | 0.129 | 0.111 | 0.092 | 0.086 | 0.081 | |
| 30 | 0.227 | 0.156 | 0.130 | 0.107 | 0.089 | 0.078 | 0.067 | 0.065 | 0.059 | 0.059 | |
| 50 | 0.175 | 0.130 | 0.102 | 0.086 | 0.072 | 0.066 | 0.063 | 0.057 | 0.056 | 0.055 | |
| 70 | 0.154 | 0.112 | 0.094 | 0.076 | 0.068 | 0.064 | 0.057 | 0.055 | 0.055 | 0.054 | |
| 100 | 0.129 | 0.095 | 0.079 | 0.068 | 0.061 | 0.058 | 0.053 | 0.051 | 0.052 | 0.053 | |
| 200 | 0.101 | 0.076 | 0.063 | 0.056 | 0.055 | 0.055 | 0.053 | 0.054 | 0.052 | 0.053 | |
| 400 | 0.074 | 0.063 | 0.058 | 0.052 | 0.054 | 0.052 | 0.052 | 0.053 | 0.051 | 0.052 | |
| 600 | 0.067 | 0.058 | 0.055 | 0.054 | 0.053 | 0.053 | 0.053 | 0.052 | 0.052 | 0.052 | |
| 800 | 0.062 | 0.057 | 0.056 | 0.053 | 0.052 | 0.053 | 0.052 | 0.052 | 0.053 | 0.053 | |
| 10 | 1.444 | 0.961 | 0.745 | 0.593 | 0.469 | 0.387 | 0.328 | 0.265 | 0.233 | 0.212 | |
| 30 | 0.967 | 0.612 | 0.480 | 0.332 | 0.274 | 0.222 | 0.176 | 0.151 | 0.130 | 0.121 | |
| 50 | 0.719 | 0.495 | 0.384 | 0.261 | 0.211 | 0.170 | 0.135 | 0.114 | 0.101 | 0.090 | |
| 70 | 0.689 | 0.417 | 0.314 | 0.215 | 0.168 | 0.146 | 0.112 | 0.095 | 0.086 | 0.075 | |
| 100 | 0.598 | 0.340 | 0.267 | 0.182 | 0.146 | 0.116 | 0.095 | 0.082 | 0.068 | 0.065 | |
| 200 | 0.431 | 0.251 | 0.188 | 0.126 | 0.106 | 0.086 | 0.068 | 0.057 | 0.050 | 0.041 | |
| 400 | 0.309 | 0.176 | 0.132 | 0.090 | 0.073 | 0.059 | 0.046 | 0.041 | 0.035 | 0.031 | |
| 600 | 0.258 | 0.145 | 0.109 | 0.077 | 0.059 | 0.047 | 0.039 | 0.031 | 0.029 | 0.026 | |
| 800 | 0.211 | 0.122 | 0.090 | 0.066 | 0.052 | 0.042 | 0.034 | 0.029 | 0.025 | 0.023 | |
| 10 | 0.522 | 0.326 | 0.252 | 0.189 | 0.159 | 0.128 | 0.105 | 0.089 | 0.084 | 0.078 | |
| 30 | 0.286 | 0.171 | 0.139 | 0.104 | 0.083 | 0.070 | 0.056 | 0.049 | 0.043 | 0.039 | |
| 50 | 0.232 | 0.139 | 0.107 | 0.080 | 0.062 | 0.053 | 0.042 | 0.037 | 0.032 | 0.029 | |
| 70 | 0.206 | 0.121 | 0.092 | 0.067 | 0.056 | 0.046 | 0.037 | 0.032 | 0.028 | 0.026 | |
| 100 | 0.176 | 0.109 | 0.080 | 0.059 | 0.047 | 0.039 | 0.031 | 0.027 | 0.024 | 0.021 | |
| 200 | 0.151 | 0.083 | 0.059 | 0.045 | 0.036 | 0.029 | 0.022 | 0.018 | 0.017 | 0.015 | |
| 400 | 0.129 | 0.065 | 0.050 | 0.032 | 0.026 | 0.021 | 0.016 | 0.014 | 0.013 | 0.011 | |
| 600 | 0.125 | 0.065 | 0.046 | 0.030 | 0.022 | 0.019 | 0.014 | 0.011 | 0.010 | 0.009 | |
| 800 | 0.123 | 0.059 | 0.043 | 0.028 | 0.021 | 0.016 | 0.013 | 0.010 | 0.009 | 0.008 | |
附表8 研究一平衡设计效应量为0.2时线性混合效应模型随机效应估计rbias
| Parameter | I | J | |||||||||
|---|---|---|---|---|---|---|---|---|---|---|---|
| 10 | 20 | 30 | 50 | 70 | 100 | 150 | 200 | 250 | 300 | ||
| 10 | 0.063 | 0.036 | 0.028 | 0.019 | 0.016 | 0.013 | 0.010 | 0.009 | 0.008 | 0.007 | |
| 30 | 0.033 | 0.017 | 0.012 | 0.008 | 0.006 | 0.005 | 0.004 | 0.003 | 0.003 | 0.003 | |
| 50 | 0.024 | 0.013 | 0.009 | 0.006 | 0.004 | 0.003 | 0.002 | 0.002 | 0.002 | 0.002 | |
| 70 | 0.021 | 0.011 | 0.007 | 0.005 | 0.003 | 0.003 | 0.002 | 0.001 | 0.001 | 0.001 | |
| 100 | 0.017 | 0.008 | 0.006 | 0.004 | 0.003 | 0.002 | 0.001 | 0.001 | 0.001 | 0.001 | |
| 200 | 0.013 | 0.006 | 0.004 | 0.002 | 0.002 | 0.001 | 0.001 | 0.001 | 0.001 | 0.000 | |
| 400 | 0.009 | 0.004 | 0.003 | 0.002 | 0.001 | 0.001 | 0.001 | 0.000 | 0.000 | 0.000 | |
| 600 | 0.008 | 0.004 | 0.002 | 0.001 | 0.001 | 0.001 | 0.000 | 0.000 | 0.000 | 0.000 | |
| 800 | 0.006 | 0.003 | 0.002 | 0.001 | 0.001 | 0.001 | 0.000 | 0.000 | 0.000 | 0.000 | |
| 10 | 0.405 | 0.283 | 0.212 | 0.174 | 0.149 | 0.129 | 0.111 | 0.092 | 0.086 | 0.081 | |
| 30 | 0.227 | 0.156 | 0.130 | 0.107 | 0.089 | 0.078 | 0.067 | 0.065 | 0.059 | 0.059 | |
| 50 | 0.175 | 0.130 | 0.102 | 0.086 | 0.072 | 0.066 | 0.063 | 0.057 | 0.056 | 0.055 | |
| 70 | 0.154 | 0.112 | 0.094 | 0.076 | 0.068 | 0.064 | 0.057 | 0.055 | 0.055 | 0.054 | |
| 100 | 0.129 | 0.095 | 0.079 | 0.068 | 0.061 | 0.058 | 0.053 | 0.051 | 0.052 | 0.053 | |
| 200 | 0.101 | 0.076 | 0.063 | 0.056 | 0.055 | 0.055 | 0.053 | 0.054 | 0.052 | 0.053 | |
| 400 | 0.074 | 0.063 | 0.058 | 0.052 | 0.054 | 0.052 | 0.052 | 0.053 | 0.051 | 0.052 | |
| 600 | 0.067 | 0.058 | 0.055 | 0.054 | 0.053 | 0.053 | 0.053 | 0.052 | 0.052 | 0.052 | |
| 800 | 0.062 | 0.057 | 0.056 | 0.053 | 0.052 | 0.053 | 0.052 | 0.052 | 0.053 | 0.053 | |
| 10 | 1.444 | 0.961 | 0.745 | 0.593 | 0.469 | 0.387 | 0.328 | 0.265 | 0.233 | 0.212 | |
| 30 | 0.967 | 0.612 | 0.480 | 0.332 | 0.274 | 0.222 | 0.176 | 0.151 | 0.130 | 0.121 | |
| 50 | 0.719 | 0.495 | 0.384 | 0.261 | 0.211 | 0.170 | 0.135 | 0.114 | 0.101 | 0.090 | |
| 70 | 0.689 | 0.417 | 0.314 | 0.215 | 0.168 | 0.146 | 0.112 | 0.095 | 0.086 | 0.075 | |
| 100 | 0.598 | 0.340 | 0.267 | 0.182 | 0.146 | 0.116 | 0.095 | 0.082 | 0.068 | 0.065 | |
| 200 | 0.431 | 0.251 | 0.188 | 0.126 | 0.106 | 0.086 | 0.068 | 0.057 | 0.050 | 0.041 | |
| 400 | 0.309 | 0.176 | 0.132 | 0.090 | 0.073 | 0.059 | 0.046 | 0.041 | 0.035 | 0.031 | |
| 600 | 0.258 | 0.145 | 0.109 | 0.077 | 0.059 | 0.047 | 0.039 | 0.031 | 0.029 | 0.026 | |
| 800 | 0.211 | 0.122 | 0.090 | 0.066 | 0.052 | 0.042 | 0.034 | 0.029 | 0.025 | 0.023 | |
| 10 | 0.522 | 0.326 | 0.252 | 0.189 | 0.159 | 0.128 | 0.105 | 0.089 | 0.084 | 0.078 | |
| 30 | 0.286 | 0.171 | 0.139 | 0.104 | 0.083 | 0.070 | 0.056 | 0.049 | 0.043 | 0.039 | |
| 50 | 0.232 | 0.139 | 0.107 | 0.080 | 0.062 | 0.053 | 0.042 | 0.037 | 0.032 | 0.029 | |
| 70 | 0.206 | 0.121 | 0.092 | 0.067 | 0.056 | 0.046 | 0.037 | 0.032 | 0.028 | 0.026 | |
| 100 | 0.176 | 0.109 | 0.080 | 0.059 | 0.047 | 0.039 | 0.031 | 0.027 | 0.024 | 0.021 | |
| 200 | 0.151 | 0.083 | 0.059 | 0.045 | 0.036 | 0.029 | 0.022 | 0.018 | 0.017 | 0.015 | |
| 400 | 0.129 | 0.065 | 0.050 | 0.032 | 0.026 | 0.021 | 0.016 | 0.014 | 0.013 | 0.011 | |
| 600 | 0.125 | 0.065 | 0.046 | 0.030 | 0.022 | 0.019 | 0.014 | 0.011 | 0.010 | 0.009 | |
| 800 | 0.123 | 0.059 | 0.043 | 0.028 | 0.021 | 0.016 | 0.013 | 0.010 | 0.009 | 0.008 | |
| Parameter | I | J | |||||||||
|---|---|---|---|---|---|---|---|---|---|---|---|
| 10 | 20 | 30 | 50 | 70 | 100 | 150 | 200 | 250 | 300 | ||
| 10 | 0.063 | 0.037 | 0.027 | 0.020 | 0.015 | 0.013 | 0.011 | 0.009 | 0.008 | 0.007 | |
| 30 | 0.033 | 0.017 | 0.012 | 0.008 | 0.006 | 0.005 | 0.004 | 0.003 | 0.003 | 0.003 | |
| 50 | 0.024 | 0.013 | 0.009 | 0.006 | 0.004 | 0.003 | 0.002 | 0.002 | 0.002 | 0.002 | |
| 70 | 0.020 | 0.011 | 0.007 | 0.005 | 0.003 | 0.003 | 0.002 | 0.001 | 0.001 | 0.001 | |
| 100 | 0.017 | 0.009 | 0.005 | 0.004 | 0.003 | 0.002 | 0.001 | 0.001 | 0.001 | 0.001 | |
| 200 | 0.012 | 0.006 | 0.004 | 0.002 | 0.002 | 0.001 | 0.001 | 0.001 | 0.001 | 0.000 | |
| 400 | 0.009 | 0.004 | 0.003 | 0.002 | 0.001 | 0.001 | 0.001 | 0.000 | 0.000 | 0.000 | |
| 600 | 0.007 | 0.003 | 0.002 | 0.001 | 0.001 | 0.001 | 0.000 | 0.000 | 0.000 | 0.000 | |
| 800 | 0.006 | 0.003 | 0.002 | 0.001 | 0.001 | 0.001 | 0.000 | 0.000 | 0.000 | 0.000 | |
| 10 | 0.409 | 0.272 | 0.224 | 0.169 | 0.149 | 0.124 | 0.104 | 0.093 | 0.085 | 0.080 | |
| 30 | 0.218 | 0.154 | 0.129 | 0.101 | 0.089 | 0.078 | 0.067 | 0.065 | 0.061 | 0.058 | |
| 50 | 0.183 | 0.126 | 0.100 | 0.085 | 0.073 | 0.068 | 0.059 | 0.058 | 0.056 | 0.054 | |
| 70 | 0.151 | 0.103 | 0.089 | 0.074 | 0.067 | 0.062 | 0.058 | 0.054 | 0.054 | 0.055 | |
| 100 | 0.130 | 0.095 | 0.079 | 0.067 | 0.061 | 0.057 | 0.056 | 0.053 | 0.053 | 0.052 | |
| 200 | 0.101 | 0.072 | 0.066 | 0.057 | 0.053 | 0.055 | 0.054 | 0.052 | 0.052 | 0.053 | |
| 400 | 0.077 | 0.059 | 0.056 | 0.054 | 0.053 | 0.052 | 0.053 | 0.053 | 0.053 | 0.052 | |
| 600 | 0.065 | 0.056 | 0.054 | 0.054 | 0.053 | 0.052 | 0.053 | 0.053 | 0.053 | 0.052 | |
| 800 | 0.063 | 0.054 | 0.054 | 0.054 | 0.052 | 0.052 | 0.053 | 0.052 | 0.052 | 0.052 | |
| 10 | 1.396 | 0.937 | 0.756 | 0.573 | 0.470 | 0.403 | 0.299 | 0.266 | 0.233 | 0.206 | |
| 30 | 0.912 | 0.578 | 0.455 | 0.334 | 0.265 | 0.214 | 0.172 | 0.145 | 0.131 | 0.123 | |
| 50 | 0.785 | 0.477 | 0.367 | 0.267 | 0.211 | 0.166 | 0.135 | 0.108 | 0.104 | 0.092 | |
| 70 | 0.671 | 0.424 | 0.294 | 0.226 | 0.174 | 0.145 | 0.110 | 0.095 | 0.083 | 0.077 | |
| 100 | 0.570 | 0.339 | 0.262 | 0.184 | 0.144 | 0.112 | 0.091 | 0.078 | 0.069 | 0.067 | |
| 200 | 0.423 | 0.257 | 0.179 | 0.131 | 0.106 | 0.083 | 0.067 | 0.058 | 0.051 | 0.045 | |
| 400 | 0.316 | 0.181 | 0.135 | 0.090 | 0.075 | 0.056 | 0.046 | 0.039 | 0.036 | 0.033 | |
| 600 | 0.262 | 0.139 | 0.107 | 0.072 | 0.059 | 0.049 | 0.037 | 0.032 | 0.028 | 0.026 | |
| 800 | 0.221 | 0.130 | 0.092 | 0.065 | 0.052 | 0.043 | 0.034 | 0.027 | 0.025 | 0.023 | |
| 10 | 0.519 | 0.319 | 0.246 | 0.188 | 0.161 | 0.127 | 0.105 | 0.089 | 0.084 | 0.075 | |
| 30 | 0.286 | 0.177 | 0.137 | 0.101 | 0.086 | 0.070 | 0.055 | 0.048 | 0.044 | 0.040 | |
| 50 | 0.234 | 0.137 | 0.106 | 0.078 | 0.067 | 0.054 | 0.044 | 0.038 | 0.035 | 0.031 | |
| 70 | 0.202 | 0.122 | 0.089 | 0.068 | 0.055 | 0.047 | 0.037 | 0.032 | 0.028 | 0.026 | |
| 100 | 0.179 | 0.105 | 0.076 | 0.053 | 0.046 | 0.038 | 0.030 | 0.027 | 0.024 | 0.022 | |
| 200 | 0.150 | 0.081 | 0.061 | 0.044 | 0.036 | 0.029 | 0.023 | 0.020 | 0.017 | 0.015 | |
| 400 | 0.128 | 0.071 | 0.049 | 0.033 | 0.027 | 0.021 | 0.016 | 0.014 | 0.012 | 0.011 | |
| 600 | 0.119 | 0.063 | 0.044 | 0.031 | 0.024 | 0.018 | 0.014 | 0.012 | 0.010 | 0.009 | |
| 800 | 0.126 | 0.057 | 0.042 | 0.027 | 0.021 | 0.016 | 0.012 | 0.011 | 0.009 | 0.008 | |
附表9 研究一平衡设计效应量为0.5时线性混合效应模型随机效应估计rbias
| Parameter | I | J | |||||||||
|---|---|---|---|---|---|---|---|---|---|---|---|
| 10 | 20 | 30 | 50 | 70 | 100 | 150 | 200 | 250 | 300 | ||
| 10 | 0.063 | 0.037 | 0.027 | 0.020 | 0.015 | 0.013 | 0.011 | 0.009 | 0.008 | 0.007 | |
| 30 | 0.033 | 0.017 | 0.012 | 0.008 | 0.006 | 0.005 | 0.004 | 0.003 | 0.003 | 0.003 | |
| 50 | 0.024 | 0.013 | 0.009 | 0.006 | 0.004 | 0.003 | 0.002 | 0.002 | 0.002 | 0.002 | |
| 70 | 0.020 | 0.011 | 0.007 | 0.005 | 0.003 | 0.003 | 0.002 | 0.001 | 0.001 | 0.001 | |
| 100 | 0.017 | 0.009 | 0.005 | 0.004 | 0.003 | 0.002 | 0.001 | 0.001 | 0.001 | 0.001 | |
| 200 | 0.012 | 0.006 | 0.004 | 0.002 | 0.002 | 0.001 | 0.001 | 0.001 | 0.001 | 0.000 | |
| 400 | 0.009 | 0.004 | 0.003 | 0.002 | 0.001 | 0.001 | 0.001 | 0.000 | 0.000 | 0.000 | |
| 600 | 0.007 | 0.003 | 0.002 | 0.001 | 0.001 | 0.001 | 0.000 | 0.000 | 0.000 | 0.000 | |
| 800 | 0.006 | 0.003 | 0.002 | 0.001 | 0.001 | 0.001 | 0.000 | 0.000 | 0.000 | 0.000 | |
| 10 | 0.409 | 0.272 | 0.224 | 0.169 | 0.149 | 0.124 | 0.104 | 0.093 | 0.085 | 0.080 | |
| 30 | 0.218 | 0.154 | 0.129 | 0.101 | 0.089 | 0.078 | 0.067 | 0.065 | 0.061 | 0.058 | |
| 50 | 0.183 | 0.126 | 0.100 | 0.085 | 0.073 | 0.068 | 0.059 | 0.058 | 0.056 | 0.054 | |
| 70 | 0.151 | 0.103 | 0.089 | 0.074 | 0.067 | 0.062 | 0.058 | 0.054 | 0.054 | 0.055 | |
| 100 | 0.130 | 0.095 | 0.079 | 0.067 | 0.061 | 0.057 | 0.056 | 0.053 | 0.053 | 0.052 | |
| 200 | 0.101 | 0.072 | 0.066 | 0.057 | 0.053 | 0.055 | 0.054 | 0.052 | 0.052 | 0.053 | |
| 400 | 0.077 | 0.059 | 0.056 | 0.054 | 0.053 | 0.052 | 0.053 | 0.053 | 0.053 | 0.052 | |
| 600 | 0.065 | 0.056 | 0.054 | 0.054 | 0.053 | 0.052 | 0.053 | 0.053 | 0.053 | 0.052 | |
| 800 | 0.063 | 0.054 | 0.054 | 0.054 | 0.052 | 0.052 | 0.053 | 0.052 | 0.052 | 0.052 | |
| 10 | 1.396 | 0.937 | 0.756 | 0.573 | 0.470 | 0.403 | 0.299 | 0.266 | 0.233 | 0.206 | |
| 30 | 0.912 | 0.578 | 0.455 | 0.334 | 0.265 | 0.214 | 0.172 | 0.145 | 0.131 | 0.123 | |
| 50 | 0.785 | 0.477 | 0.367 | 0.267 | 0.211 | 0.166 | 0.135 | 0.108 | 0.104 | 0.092 | |
| 70 | 0.671 | 0.424 | 0.294 | 0.226 | 0.174 | 0.145 | 0.110 | 0.095 | 0.083 | 0.077 | |
| 100 | 0.570 | 0.339 | 0.262 | 0.184 | 0.144 | 0.112 | 0.091 | 0.078 | 0.069 | 0.067 | |
| 200 | 0.423 | 0.257 | 0.179 | 0.131 | 0.106 | 0.083 | 0.067 | 0.058 | 0.051 | 0.045 | |
| 400 | 0.316 | 0.181 | 0.135 | 0.090 | 0.075 | 0.056 | 0.046 | 0.039 | 0.036 | 0.033 | |
| 600 | 0.262 | 0.139 | 0.107 | 0.072 | 0.059 | 0.049 | 0.037 | 0.032 | 0.028 | 0.026 | |
| 800 | 0.221 | 0.130 | 0.092 | 0.065 | 0.052 | 0.043 | 0.034 | 0.027 | 0.025 | 0.023 | |
| 10 | 0.519 | 0.319 | 0.246 | 0.188 | 0.161 | 0.127 | 0.105 | 0.089 | 0.084 | 0.075 | |
| 30 | 0.286 | 0.177 | 0.137 | 0.101 | 0.086 | 0.070 | 0.055 | 0.048 | 0.044 | 0.040 | |
| 50 | 0.234 | 0.137 | 0.106 | 0.078 | 0.067 | 0.054 | 0.044 | 0.038 | 0.035 | 0.031 | |
| 70 | 0.202 | 0.122 | 0.089 | 0.068 | 0.055 | 0.047 | 0.037 | 0.032 | 0.028 | 0.026 | |
| 100 | 0.179 | 0.105 | 0.076 | 0.053 | 0.046 | 0.038 | 0.030 | 0.027 | 0.024 | 0.022 | |
| 200 | 0.150 | 0.081 | 0.061 | 0.044 | 0.036 | 0.029 | 0.023 | 0.020 | 0.017 | 0.015 | |
| 400 | 0.128 | 0.071 | 0.049 | 0.033 | 0.027 | 0.021 | 0.016 | 0.014 | 0.012 | 0.011 | |
| 600 | 0.119 | 0.063 | 0.044 | 0.031 | 0.024 | 0.018 | 0.014 | 0.012 | 0.010 | 0.009 | |
| 800 | 0.126 | 0.057 | 0.042 | 0.027 | 0.021 | 0.016 | 0.012 | 0.011 | 0.009 | 0.008 | |
| Parameter | I | J | |||||||||
|---|---|---|---|---|---|---|---|---|---|---|---|
| 10 | 20 | 30 | 50 | 70 | 100 | 150 | 200 | 250 | 300 | ||
| 10 | 0.065 | 0.035 | 0.028 | 0.020 | 0.017 | 0.013 | 0.010 | 0.009 | 0.008 | 0.007 | |
| 30 | 0.032 | 0.018 | 0.012 | 0.008 | 0.006 | 0.005 | 0.004 | 0.003 | 0.003 | 0.002 | |
| 50 | 0.026 | 0.012 | 0.009 | 0.006 | 0.004 | 0.003 | 0.002 | 0.002 | 0.002 | 0.001 | |
| 70 | 0.021 | 0.010 | 0.007 | 0.004 | 0.004 | 0.002 | 0.002 | 0.002 | 0.001 | 0.001 | |
| 100 | 0.017 | 0.009 | 0.006 | 0.004 | 0.003 | 0.002 | 0.001 | 0.001 | 0.001 | 0.001 | |
| 200 | 0.013 | 0.006 | 0.004 | 0.003 | 0.002 | 0.001 | 0.001 | 0.001 | 0.001 | 0.001 | |
| 400 | 0.009 | 0.004 | 0.003 | 0.002 | 0.001 | 0.001 | 0.001 | 0.000 | 0.000 | 0.000 | |
| 600 | 0.007 | 0.003 | 0.002 | 0.001 | 0.001 | 0.001 | 0.000 | 0.000 | 0.000 | 0.000 | |
| 800 | 0.006 | 0.003 | 0.002 | 0.001 | 0.001 | 0.001 | 0.000 | 0.000 | 0.000 | 0.000 | |
| 10 | 0.394 | 0.278 | 0.221 | 0.177 | 0.148 | 0.124 | 0.107 | 0.093 | 0.084 | 0.081 | |
| 30 | 0.225 | 0.162 | 0.136 | 0.102 | 0.088 | 0.080 | 0.067 | 0.064 | 0.060 | 0.059 | |
| 50 | 0.176 | 0.126 | 0.105 | 0.079 | 0.077 | 0.067 | 0.063 | 0.056 | 0.058 | 0.054 | |
| 70 | 0.157 | 0.108 | 0.093 | 0.075 | 0.066 | 0.059 | 0.056 | 0.055 | 0.056 | 0.055 | |
| 100 | 0.130 | 0.093 | 0.081 | 0.068 | 0.061 | 0.058 | 0.056 | 0.054 | 0.053 | 0.054 | |
| 200 | 0.098 | 0.073 | 0.064 | 0.060 | 0.054 | 0.055 | 0.053 | 0.052 | 0.053 | 0.053 | |
| 400 | 0.071 | 0.060 | 0.056 | 0.054 | 0.052 | 0.053 | 0.053 | 0.052 | 0.053 | 0.052 | |
| 600 | 0.067 | 0.058 | 0.054 | 0.054 | 0.053 | 0.053 | 0.052 | 0.053 | 0.052 | 0.053 | |
| 800 | 0.064 | 0.057 | 0.053 | 0.053 | 0.053 | 0.051 | 0.053 | 0.052 | 0.052 | 0.052 | |
| 10 | 1.413 | 0.913 | 0.785 | 0.566 | 0.466 | 0.403 | 0.309 | 0.278 | 0.238 | 0.214 | |
| 30 | 0.922 | 0.615 | 0.470 | 0.326 | 0.273 | 0.218 | 0.176 | 0.152 | 0.128 | 0.117 | |
| 50 | 0.799 | 0.467 | 0.389 | 0.258 | 0.217 | 0.170 | 0.129 | 0.114 | 0.100 | 0.092 | |
| 70 | 0.694 | 0.416 | 0.323 | 0.225 | 0.181 | 0.143 | 0.113 | 0.093 | 0.086 | 0.079 | |
| 100 | 0.571 | 0.346 | 0.263 | 0.181 | 0.146 | 0.122 | 0.093 | 0.082 | 0.070 | 0.062 | |
| 200 | 0.440 | 0.242 | 0.185 | 0.130 | 0.102 | 0.080 | 0.064 | 0.058 | 0.048 | 0.046 | |
| 400 | 0.310 | 0.173 | 0.129 | 0.094 | 0.074 | 0.060 | 0.047 | 0.041 | 0.036 | 0.031 | |
| 600 | 0.253 | 0.147 | 0.104 | 0.073 | 0.061 | 0.048 | 0.038 | 0.032 | 0.028 | 0.026 | |
| 800 | 0.210 | 0.126 | 0.092 | 0.064 | 0.051 | 0.043 | 0.034 | 0.027 | 0.025 | 0.023 | |
| 10 | 0.513 | 0.309 | 0.256 | 0.179 | 0.165 | 0.135 | 0.104 | 0.091 | 0.083 | 0.075 | |
| 30 | 0.288 | 0.181 | 0.140 | 0.105 | 0.087 | 0.069 | 0.056 | 0.048 | 0.042 | 0.040 | |
| 50 | 0.247 | 0.145 | 0.105 | 0.081 | 0.063 | 0.056 | 0.044 | 0.035 | 0.033 | 0.030 | |
| 70 | 0.209 | 0.122 | 0.091 | 0.070 | 0.056 | 0.044 | 0.036 | 0.030 | 0.027 | 0.025 | |
| 100 | 0.190 | 0.105 | 0.084 | 0.059 | 0.048 | 0.039 | 0.032 | 0.027 | 0.023 | 0.022 | |
| 200 | 0.153 | 0.082 | 0.061 | 0.043 | 0.036 | 0.027 | 0.021 | 0.019 | 0.017 | 0.015 | |
| 400 | 0.128 | 0.068 | 0.051 | 0.033 | 0.026 | 0.021 | 0.017 | 0.013 | 0.012 | 0.011 | |
| 600 | 0.126 | 0.062 | 0.045 | 0.030 | 0.023 | 0.018 | 0.014 | 0.012 | 0.010 | 0.009 | |
| 800 | 0.127 | 0.064 | 0.043 | 0.028 | 0.021 | 0.016 | 0.013 | 0.011 | 0.009 | 0.008 | |
附表10 研究一平衡设计效应量为0.8时线性混合效应模型随机效应估计rbias
| Parameter | I | J | |||||||||
|---|---|---|---|---|---|---|---|---|---|---|---|
| 10 | 20 | 30 | 50 | 70 | 100 | 150 | 200 | 250 | 300 | ||
| 10 | 0.065 | 0.035 | 0.028 | 0.020 | 0.017 | 0.013 | 0.010 | 0.009 | 0.008 | 0.007 | |
| 30 | 0.032 | 0.018 | 0.012 | 0.008 | 0.006 | 0.005 | 0.004 | 0.003 | 0.003 | 0.002 | |
| 50 | 0.026 | 0.012 | 0.009 | 0.006 | 0.004 | 0.003 | 0.002 | 0.002 | 0.002 | 0.001 | |
| 70 | 0.021 | 0.010 | 0.007 | 0.004 | 0.004 | 0.002 | 0.002 | 0.002 | 0.001 | 0.001 | |
| 100 | 0.017 | 0.009 | 0.006 | 0.004 | 0.003 | 0.002 | 0.001 | 0.001 | 0.001 | 0.001 | |
| 200 | 0.013 | 0.006 | 0.004 | 0.003 | 0.002 | 0.001 | 0.001 | 0.001 | 0.001 | 0.001 | |
| 400 | 0.009 | 0.004 | 0.003 | 0.002 | 0.001 | 0.001 | 0.001 | 0.000 | 0.000 | 0.000 | |
| 600 | 0.007 | 0.003 | 0.002 | 0.001 | 0.001 | 0.001 | 0.000 | 0.000 | 0.000 | 0.000 | |
| 800 | 0.006 | 0.003 | 0.002 | 0.001 | 0.001 | 0.001 | 0.000 | 0.000 | 0.000 | 0.000 | |
| 10 | 0.394 | 0.278 | 0.221 | 0.177 | 0.148 | 0.124 | 0.107 | 0.093 | 0.084 | 0.081 | |
| 30 | 0.225 | 0.162 | 0.136 | 0.102 | 0.088 | 0.080 | 0.067 | 0.064 | 0.060 | 0.059 | |
| 50 | 0.176 | 0.126 | 0.105 | 0.079 | 0.077 | 0.067 | 0.063 | 0.056 | 0.058 | 0.054 | |
| 70 | 0.157 | 0.108 | 0.093 | 0.075 | 0.066 | 0.059 | 0.056 | 0.055 | 0.056 | 0.055 | |
| 100 | 0.130 | 0.093 | 0.081 | 0.068 | 0.061 | 0.058 | 0.056 | 0.054 | 0.053 | 0.054 | |
| 200 | 0.098 | 0.073 | 0.064 | 0.060 | 0.054 | 0.055 | 0.053 | 0.052 | 0.053 | 0.053 | |
| 400 | 0.071 | 0.060 | 0.056 | 0.054 | 0.052 | 0.053 | 0.053 | 0.052 | 0.053 | 0.052 | |
| 600 | 0.067 | 0.058 | 0.054 | 0.054 | 0.053 | 0.053 | 0.052 | 0.053 | 0.052 | 0.053 | |
| 800 | 0.064 | 0.057 | 0.053 | 0.053 | 0.053 | 0.051 | 0.053 | 0.052 | 0.052 | 0.052 | |
| 10 | 1.413 | 0.913 | 0.785 | 0.566 | 0.466 | 0.403 | 0.309 | 0.278 | 0.238 | 0.214 | |
| 30 | 0.922 | 0.615 | 0.470 | 0.326 | 0.273 | 0.218 | 0.176 | 0.152 | 0.128 | 0.117 | |
| 50 | 0.799 | 0.467 | 0.389 | 0.258 | 0.217 | 0.170 | 0.129 | 0.114 | 0.100 | 0.092 | |
| 70 | 0.694 | 0.416 | 0.323 | 0.225 | 0.181 | 0.143 | 0.113 | 0.093 | 0.086 | 0.079 | |
| 100 | 0.571 | 0.346 | 0.263 | 0.181 | 0.146 | 0.122 | 0.093 | 0.082 | 0.070 | 0.062 | |
| 200 | 0.440 | 0.242 | 0.185 | 0.130 | 0.102 | 0.080 | 0.064 | 0.058 | 0.048 | 0.046 | |
| 400 | 0.310 | 0.173 | 0.129 | 0.094 | 0.074 | 0.060 | 0.047 | 0.041 | 0.036 | 0.031 | |
| 600 | 0.253 | 0.147 | 0.104 | 0.073 | 0.061 | 0.048 | 0.038 | 0.032 | 0.028 | 0.026 | |
| 800 | 0.210 | 0.126 | 0.092 | 0.064 | 0.051 | 0.043 | 0.034 | 0.027 | 0.025 | 0.023 | |
| 10 | 0.513 | 0.309 | 0.256 | 0.179 | 0.165 | 0.135 | 0.104 | 0.091 | 0.083 | 0.075 | |
| 30 | 0.288 | 0.181 | 0.140 | 0.105 | 0.087 | 0.069 | 0.056 | 0.048 | 0.042 | 0.040 | |
| 50 | 0.247 | 0.145 | 0.105 | 0.081 | 0.063 | 0.056 | 0.044 | 0.035 | 0.033 | 0.030 | |
| 70 | 0.209 | 0.122 | 0.091 | 0.070 | 0.056 | 0.044 | 0.036 | 0.030 | 0.027 | 0.025 | |
| 100 | 0.190 | 0.105 | 0.084 | 0.059 | 0.048 | 0.039 | 0.032 | 0.027 | 0.023 | 0.022 | |
| 200 | 0.153 | 0.082 | 0.061 | 0.043 | 0.036 | 0.027 | 0.021 | 0.019 | 0.017 | 0.015 | |
| 400 | 0.128 | 0.068 | 0.051 | 0.033 | 0.026 | 0.021 | 0.017 | 0.013 | 0.012 | 0.011 | |
| 600 | 0.126 | 0.062 | 0.045 | 0.030 | 0.023 | 0.018 | 0.014 | 0.012 | 0.010 | 0.009 | |
| 800 | 0.127 | 0.064 | 0.043 | 0.028 | 0.021 | 0.016 | 0.013 | 0.011 | 0.009 | 0.008 | |
| Parameter | I | J | |||||||||
|---|---|---|---|---|---|---|---|---|---|---|---|
| 10 | 20 | 30 | 50 | 70 | 100 | 150 | 200 | 250 | 300 | ||
| 10 | 0.065 | 0.037 | 0.028 | 0.019 | 0.016 | 0.013 | 0.010 | 0.009 | 0.007 | 0.007 | |
| 30 | 0.032 | 0.017 | 0.012 | 0.008 | 0.006 | 0.005 | 0.004 | 0.002 | 0.003 | 0.002 | |
| 50 | 0.024 | 0.012 | 0.008 | 0.006 | 0.004 | 0.003 | 0.003 | 0.002 | 0.002 | 0.002 | |
| 70 | 0.020 | 0.010 | 0.007 | 0.004 | 0.003 | 0.003 | 0.002 | 0.002 | 0.001 | 0.001 | |
| 100 | 0.017 | 0.008 | 0.006 | 0.004 | 0.003 | 0.002 | 0.001 | 0.001 | 0.001 | 0.001 | |
| 200 | 0.012 | 0.006 | 0.004 | 0.002 | 0.002 | 0.001 | 0.001 | 0.001 | 0.001 | 0.001 | |
| 400 | 0.009 | 0.004 | 0.003 | 0.002 | 0.001 | 0.001 | 0.001 | 0.000 | 0.000 | 0.000 | |
| 600 | 0.007 | 0.003 | 0.002 | 0.001 | 0.001 | 0.001 | 0.000 | 0.000 | 0.000 | 0.000 | |
| 800 | 0.006 | 0.003 | 0.002 | 0.001 | 0.001 | 0.001 | 0.000 | 0.000 | 0.000 | 0.000 | |
| 10 | 0.634 | 0.433 | 0.353 | 0.273 | 0.229 | 0.196 | 0.164 | 0.136 | 0.125 | 0.113 | |
| 30 | 0.385 | 0.250 | 0.203 | 0.157 | 0.134 | 0.110 | 0.093 | 0.072 | 0.080 | 0.075 | |
| 50 | 0.279 | 0.204 | 0.164 | 0.125 | 0.107 | 0.092 | 0.081 | 0.073 | 0.069 | 0.065 | |
| 70 | 0.266 | 0.173 | 0.138 | 0.107 | 0.097 | 0.081 | 0.068 | 0.067 | 0.062 | 0.061 | |
| 100 | 0.220 | 0.146 | 0.120 | 0.095 | 0.082 | 0.070 | 0.064 | 0.061 | 0.059 | 0.056 | |
| 200 | 0.163 | 0.108 | 0.089 | 0.072 | 0.066 | 0.060 | 0.056 | 0.054 | 0.054 | 0.054 | |
| 400 | 0.122 | 0.082 | 0.070 | 0.059 | 0.057 | 0.055 | 0.051 | 0.051 | 0.053 | 0.053 | |
| 600 | 0.100 | 0.072 | 0.063 | 0.060 | 0.055 | 0.054 | 0.054 | 0.053 | 0.053 | 0.052 | |
| 800 | 0.086 | 0.068 | 0.059 | 0.055 | 0.053 | 0.052 | 0.053 | 0.053 | 0.052 | 0.052 | |
| 10 | 1.875 | 1.240 | 0.949 | 0.720 | 0.602 | 0.511 | 0.402 | 0.342 | 0.303 | 0.276 | |
| 30 | 1.246 | 0.794 | 0.628 | 0.437 | 0.359 | 0.289 | 0.218 | 0.150 | 0.168 | 0.152 | |
| 50 | 1.044 | 0.662 | 0.504 | 0.345 | 0.283 | 0.228 | 0.175 | 0.143 | 0.130 | 0.116 | |
| 70 | 0.943 | 0.566 | 0.426 | 0.304 | 0.237 | 0.191 | 0.141 | 0.123 | 0.110 | 0.102 | |
| 100 | 0.807 | 0.483 | 0.343 | 0.242 | 0.197 | 0.155 | 0.117 | 0.105 | 0.089 | 0.083 | |
| 200 | 0.598 | 0.345 | 0.249 | 0.174 | 0.138 | 0.112 | 0.086 | 0.070 | 0.064 | 0.057 | |
| 400 | 0.468 | 0.250 | 0.180 | 0.124 | 0.100 | 0.080 | 0.060 | 0.053 | 0.043 | 0.042 | |
| 600 | 0.375 | 0.196 | 0.152 | 0.098 | 0.083 | 0.062 | 0.049 | 0.042 | 0.036 | 0.034 | |
| 800 | 0.314 | 0.182 | 0.123 | 0.086 | 0.070 | 0.055 | 0.043 | 0.036 | 0.032 | 0.028 | |
| 10 | 0.510 | 0.318 | 0.255 | 0.180 | 0.155 | 0.133 | 0.108 | 0.090 | 0.081 | 0.073 | |
| 30 | 0.286 | 0.176 | 0.133 | 0.100 | 0.086 | 0.071 | 0.057 | 0.041 | 0.042 | 0.042 | |
| 50 | 0.248 | 0.141 | 0.101 | 0.079 | 0.066 | 0.056 | 0.043 | 0.038 | 0.033 | 0.030 | |
| 70 | 0.203 | 0.125 | 0.096 | 0.070 | 0.056 | 0.044 | 0.036 | 0.030 | 0.028 | 0.025 | |
| 100 | 0.178 | 0.104 | 0.082 | 0.059 | 0.047 | 0.037 | 0.031 | 0.026 | 0.023 | 0.021 | |
| 200 | 0.156 | 0.081 | 0.062 | 0.042 | 0.035 | 0.028 | 0.022 | 0.020 | 0.017 | 0.016 | |
| 400 | 0.131 | 0.070 | 0.049 | 0.036 | 0.027 | 0.021 | 0.017 | 0.014 | 0.012 | 0.011 | |
| 600 | 0.127 | 0.065 | 0.045 | 0.029 | 0.024 | 0.018 | 0.014 | 0.012 | 0.010 | 0.009 | |
| 800 | 0.124 | 0.061 | 0.042 | 0.027 | 0.021 | 0.016 | 0.012 | 0.010 | 0.009 | 0.009 | |
附表11 研究一非平衡设计效应量为0.5时线性混合效应模型随机效应估计rbias
| Parameter | I | J | |||||||||
|---|---|---|---|---|---|---|---|---|---|---|---|
| 10 | 20 | 30 | 50 | 70 | 100 | 150 | 200 | 250 | 300 | ||
| 10 | 0.065 | 0.037 | 0.028 | 0.019 | 0.016 | 0.013 | 0.010 | 0.009 | 0.007 | 0.007 | |
| 30 | 0.032 | 0.017 | 0.012 | 0.008 | 0.006 | 0.005 | 0.004 | 0.002 | 0.003 | 0.002 | |
| 50 | 0.024 | 0.012 | 0.008 | 0.006 | 0.004 | 0.003 | 0.003 | 0.002 | 0.002 | 0.002 | |
| 70 | 0.020 | 0.010 | 0.007 | 0.004 | 0.003 | 0.003 | 0.002 | 0.002 | 0.001 | 0.001 | |
| 100 | 0.017 | 0.008 | 0.006 | 0.004 | 0.003 | 0.002 | 0.001 | 0.001 | 0.001 | 0.001 | |
| 200 | 0.012 | 0.006 | 0.004 | 0.002 | 0.002 | 0.001 | 0.001 | 0.001 | 0.001 | 0.001 | |
| 400 | 0.009 | 0.004 | 0.003 | 0.002 | 0.001 | 0.001 | 0.001 | 0.000 | 0.000 | 0.000 | |
| 600 | 0.007 | 0.003 | 0.002 | 0.001 | 0.001 | 0.001 | 0.000 | 0.000 | 0.000 | 0.000 | |
| 800 | 0.006 | 0.003 | 0.002 | 0.001 | 0.001 | 0.001 | 0.000 | 0.000 | 0.000 | 0.000 | |
| 10 | 0.634 | 0.433 | 0.353 | 0.273 | 0.229 | 0.196 | 0.164 | 0.136 | 0.125 | 0.113 | |
| 30 | 0.385 | 0.250 | 0.203 | 0.157 | 0.134 | 0.110 | 0.093 | 0.072 | 0.080 | 0.075 | |
| 50 | 0.279 | 0.204 | 0.164 | 0.125 | 0.107 | 0.092 | 0.081 | 0.073 | 0.069 | 0.065 | |
| 70 | 0.266 | 0.173 | 0.138 | 0.107 | 0.097 | 0.081 | 0.068 | 0.067 | 0.062 | 0.061 | |
| 100 | 0.220 | 0.146 | 0.120 | 0.095 | 0.082 | 0.070 | 0.064 | 0.061 | 0.059 | 0.056 | |
| 200 | 0.163 | 0.108 | 0.089 | 0.072 | 0.066 | 0.060 | 0.056 | 0.054 | 0.054 | 0.054 | |
| 400 | 0.122 | 0.082 | 0.070 | 0.059 | 0.057 | 0.055 | 0.051 | 0.051 | 0.053 | 0.053 | |
| 600 | 0.100 | 0.072 | 0.063 | 0.060 | 0.055 | 0.054 | 0.054 | 0.053 | 0.053 | 0.052 | |
| 800 | 0.086 | 0.068 | 0.059 | 0.055 | 0.053 | 0.052 | 0.053 | 0.053 | 0.052 | 0.052 | |
| 10 | 1.875 | 1.240 | 0.949 | 0.720 | 0.602 | 0.511 | 0.402 | 0.342 | 0.303 | 0.276 | |
| 30 | 1.246 | 0.794 | 0.628 | 0.437 | 0.359 | 0.289 | 0.218 | 0.150 | 0.168 | 0.152 | |
| 50 | 1.044 | 0.662 | 0.504 | 0.345 | 0.283 | 0.228 | 0.175 | 0.143 | 0.130 | 0.116 | |
| 70 | 0.943 | 0.566 | 0.426 | 0.304 | 0.237 | 0.191 | 0.141 | 0.123 | 0.110 | 0.102 | |
| 100 | 0.807 | 0.483 | 0.343 | 0.242 | 0.197 | 0.155 | 0.117 | 0.105 | 0.089 | 0.083 | |
| 200 | 0.598 | 0.345 | 0.249 | 0.174 | 0.138 | 0.112 | 0.086 | 0.070 | 0.064 | 0.057 | |
| 400 | 0.468 | 0.250 | 0.180 | 0.124 | 0.100 | 0.080 | 0.060 | 0.053 | 0.043 | 0.042 | |
| 600 | 0.375 | 0.196 | 0.152 | 0.098 | 0.083 | 0.062 | 0.049 | 0.042 | 0.036 | 0.034 | |
| 800 | 0.314 | 0.182 | 0.123 | 0.086 | 0.070 | 0.055 | 0.043 | 0.036 | 0.032 | 0.028 | |
| 10 | 0.510 | 0.318 | 0.255 | 0.180 | 0.155 | 0.133 | 0.108 | 0.090 | 0.081 | 0.073 | |
| 30 | 0.286 | 0.176 | 0.133 | 0.100 | 0.086 | 0.071 | 0.057 | 0.041 | 0.042 | 0.042 | |
| 50 | 0.248 | 0.141 | 0.101 | 0.079 | 0.066 | 0.056 | 0.043 | 0.038 | 0.033 | 0.030 | |
| 70 | 0.203 | 0.125 | 0.096 | 0.070 | 0.056 | 0.044 | 0.036 | 0.030 | 0.028 | 0.025 | |
| 100 | 0.178 | 0.104 | 0.082 | 0.059 | 0.047 | 0.037 | 0.031 | 0.026 | 0.023 | 0.021 | |
| 200 | 0.156 | 0.081 | 0.062 | 0.042 | 0.035 | 0.028 | 0.022 | 0.020 | 0.017 | 0.016 | |
| 400 | 0.131 | 0.070 | 0.049 | 0.036 | 0.027 | 0.021 | 0.017 | 0.014 | 0.012 | 0.011 | |
| 600 | 0.127 | 0.065 | 0.045 | 0.029 | 0.024 | 0.018 | 0.014 | 0.012 | 0.010 | 0.009 | |
| 800 | 0.124 | 0.061 | 0.042 | 0.027 | 0.021 | 0.016 | 0.012 | 0.010 | 0.009 | 0.009 | |
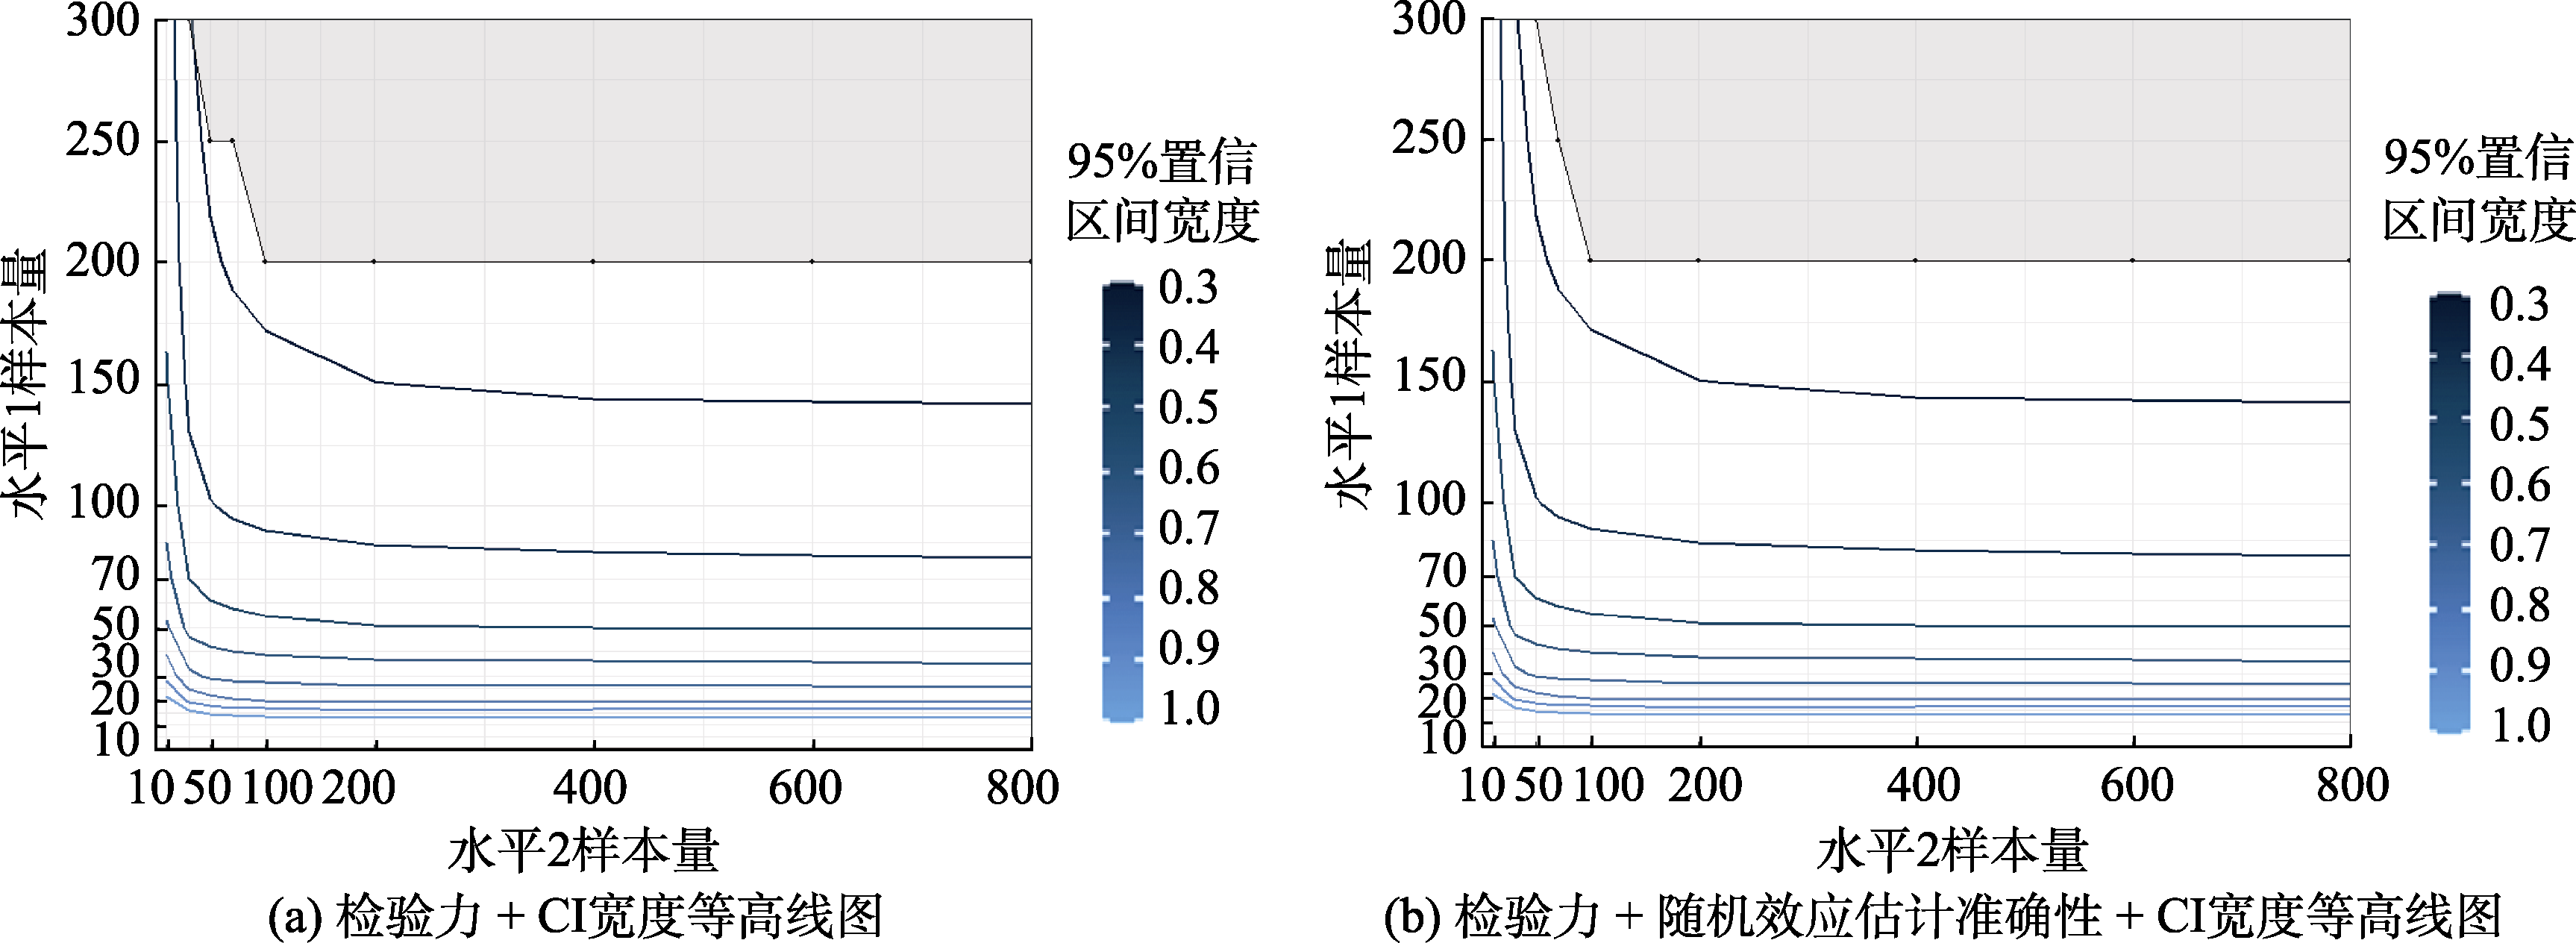
附图1 研究一平衡设计水平1自变量效应量小情况下的CI宽度等高线图 注:图(a)中阴影区域表示符合检验力大于等于0.8标准的条件,图(b)中阴影区域表示符合检验力大于等于0.8并且所有随机效应估计值rbias小于0.1的条件。不同95%CI宽度用不同颜色的等高线表示。如图例所示从0.3到1.0间隔0.1,在图中共有8条依次排列的等高线。例如,0.3对应的等高线表示线条以上的区域95%CI宽度在0.3及其以下。后同。
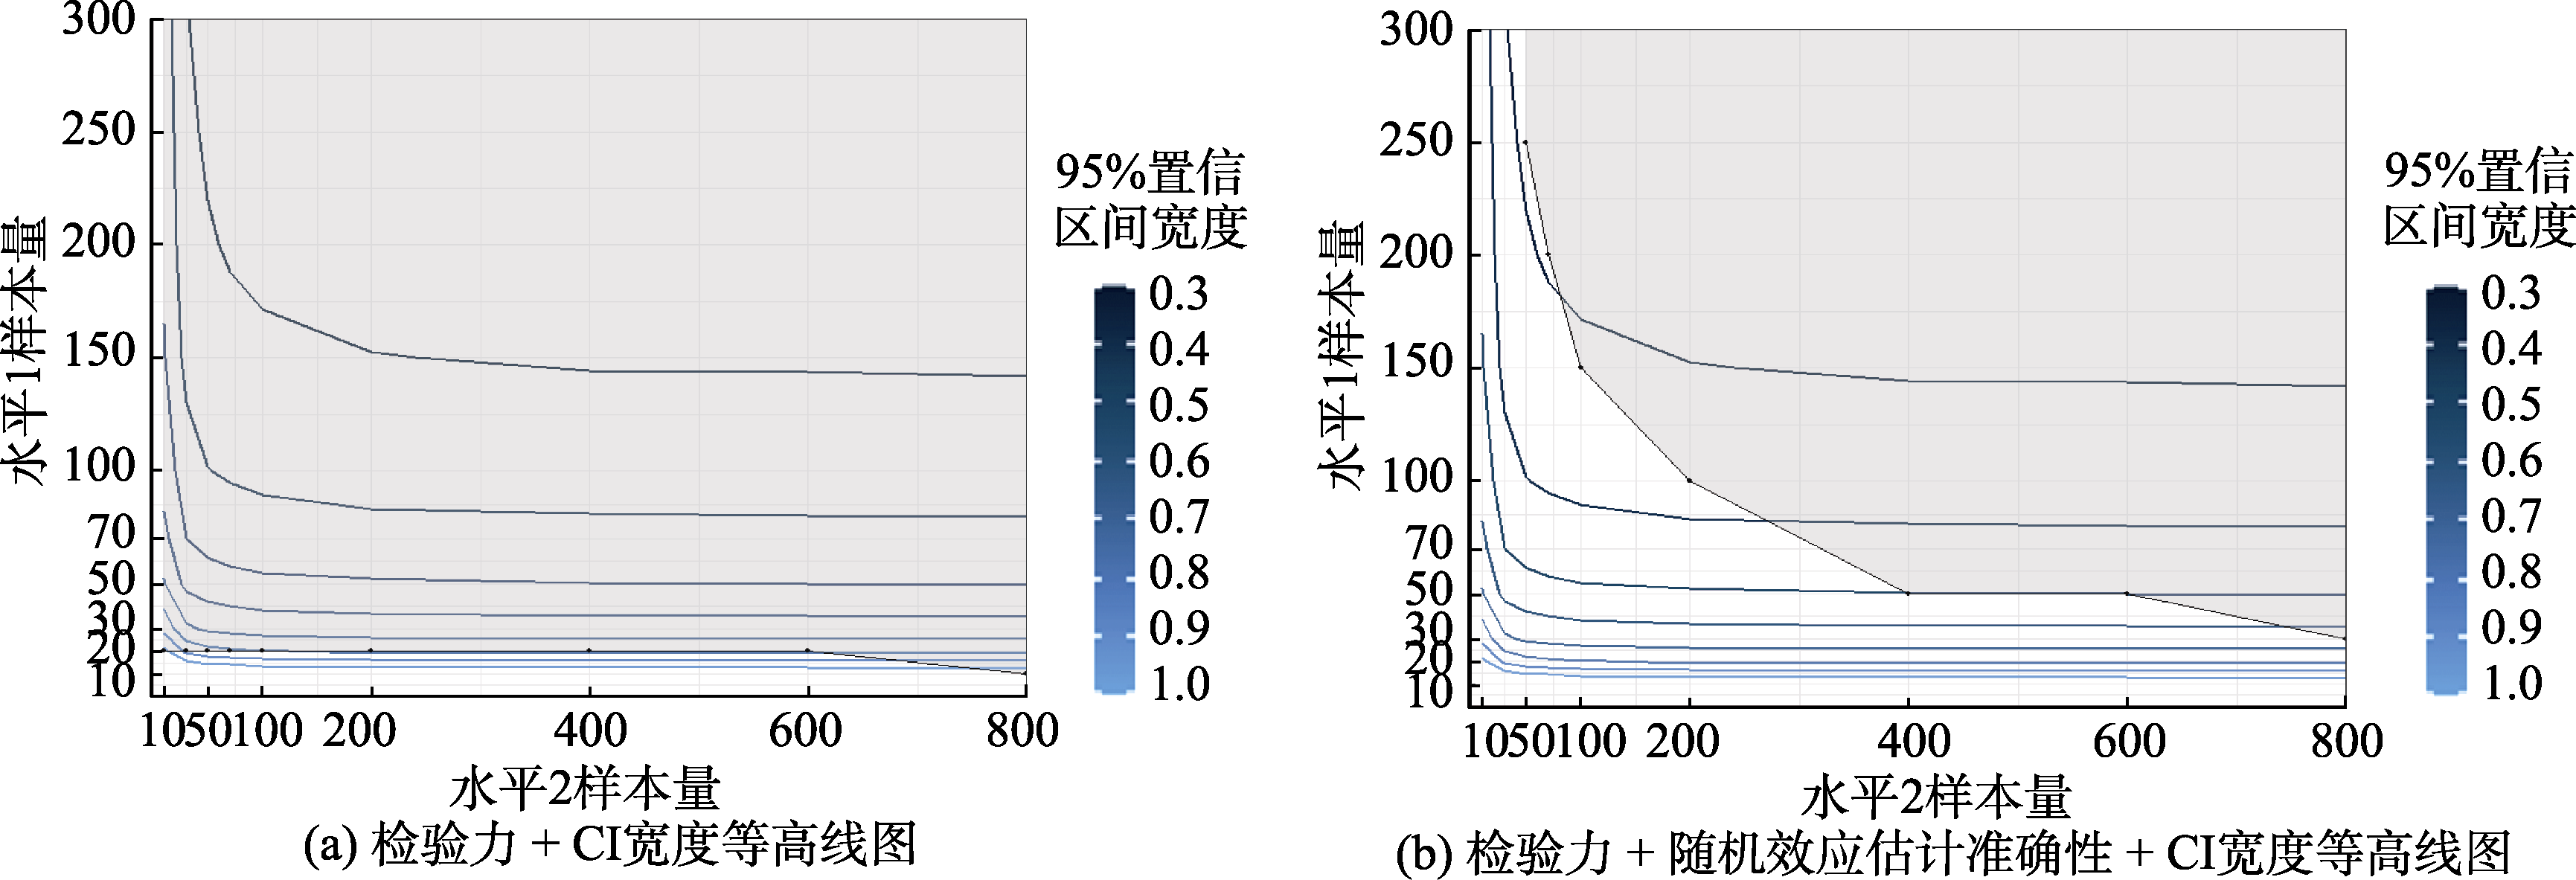
附图2 研究一平衡设计水平1自变量效应量大情况下的CI宽度等高线图
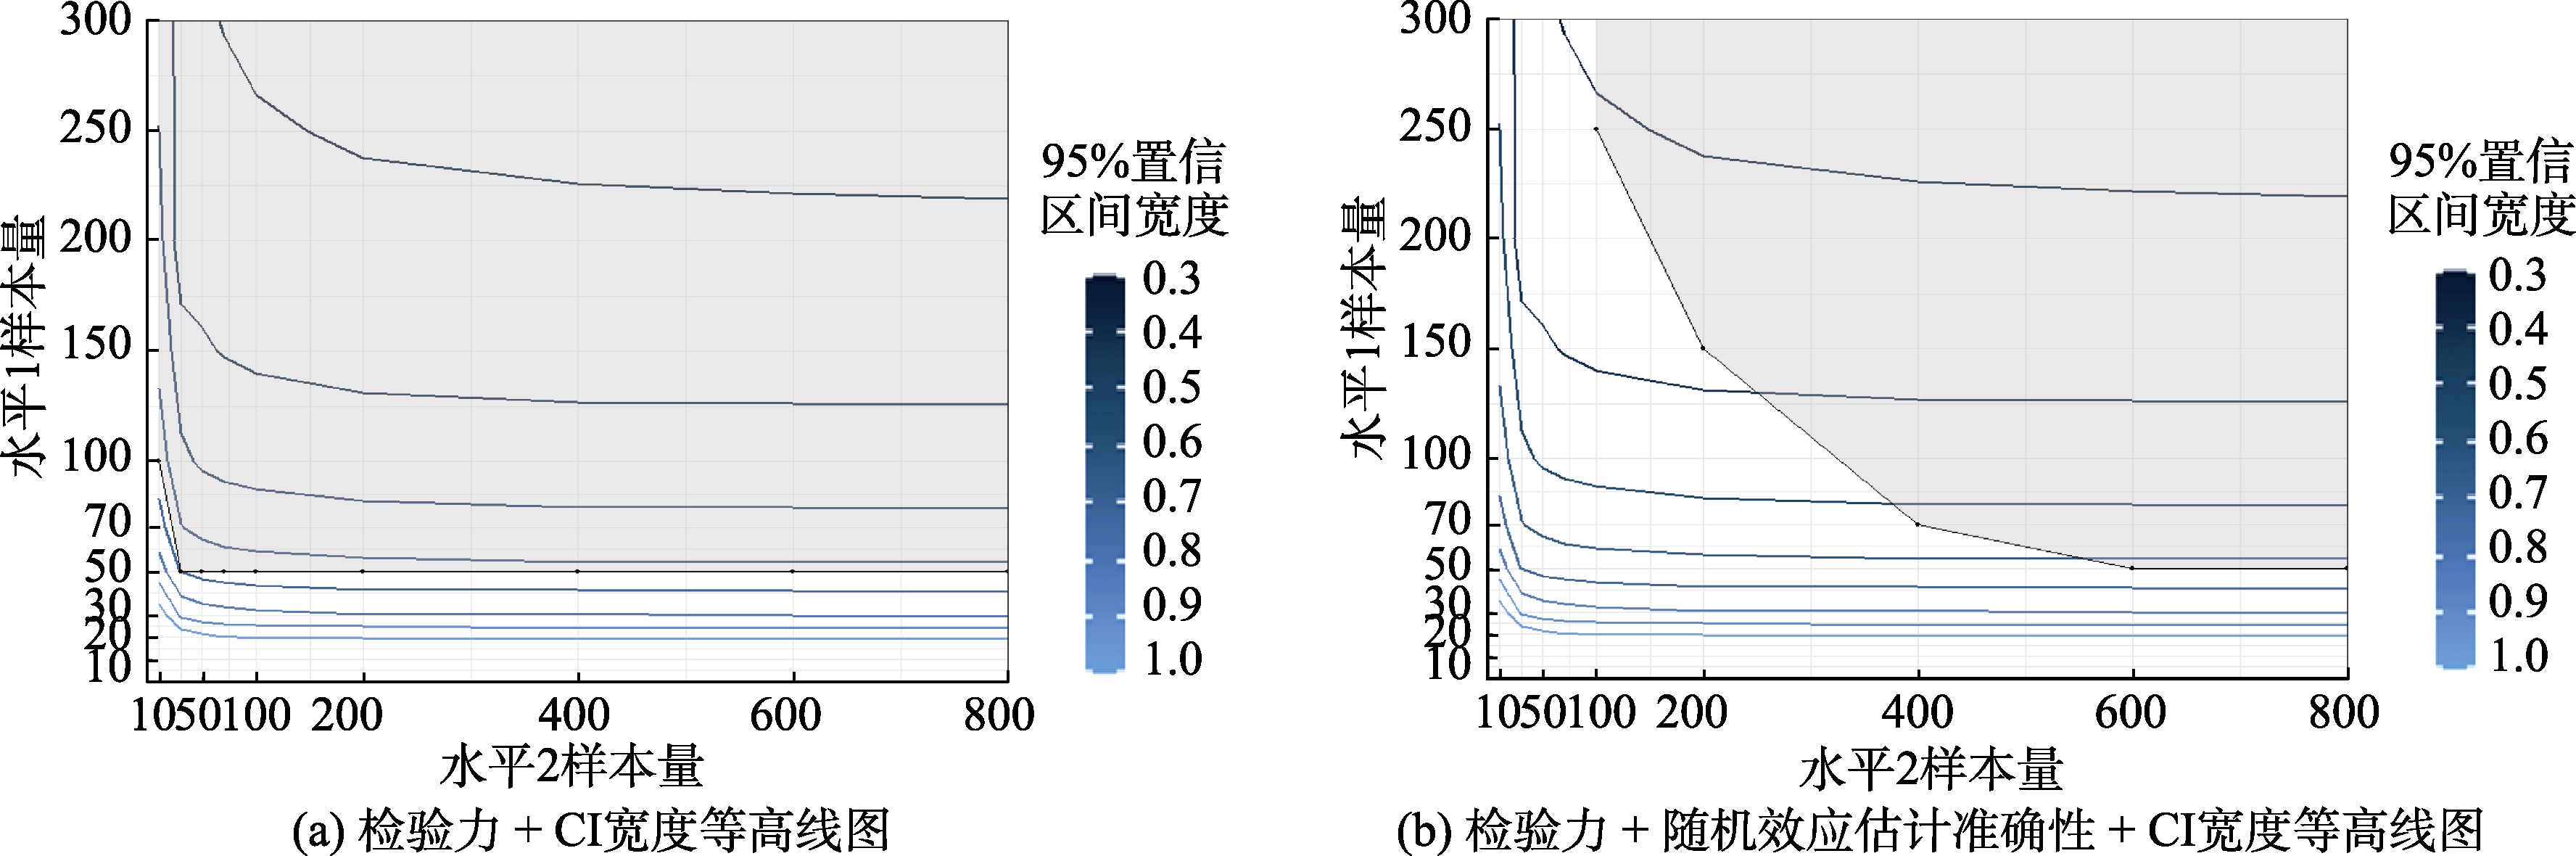
附图3 研究一非平衡设计水平1自变量效应量中情况下的CI宽度等高线图
| L2_IV | I | J | ||||||||||
|---|---|---|---|---|---|---|---|---|---|---|---|---|
| 10 | 20 | 30 | 50 | 70 | 100 | 150 | 200 | 250 | 300 | |||
| 分类 | 0.01 | 10 | 0.982 | 0.994 | 0.992 | 0.987 | 0.989 | 0.983 | 0.984 | 0.984 | 0.976 | 0.972 |
| 30 | 0.983 | 0.985 | 0.978 | 0.977 | 0.976 | 0.970 | 0.966 | 0.961 | 0.967 | 0.968 | ||
| 50 | 0.985 | 0.977 | 0.970 | 0.970 | 0.966 | 0.962 | 0.958 | 0.932 | 0.941 | 0.947 | ||
| 70 | 0.973 | 0.970 | 0.962 | 0.972 | 0.946 | 0.937 | 0.923 | 0.920 | 0.901 | 0.905 | ||
| 100 | 0.969 | 0.965 | 0.951 | 0.935 | 0.922 | 0.928 | 0.882 | 0.863 | 0.879 | 0.857 | ||
| 200 | 0.942 | 0.948 | 0.907 | 0.911 | 0.861 | 0.801 | 0.791 | 0.765 | 0.743 | 0.733 | ||
| 400 | 0.898 | 0.883 | 0.878 | 0.844 | 0.790 | 0.775 | 0.677 | 0.638 | 0.604 | 0.606 | ||
| 600 | 0.876 | 0.846 | 0.842 | 0.805 | 0.736 | 0.655 | 0.613 | 0.575 | 0.553 | 0.527 | ||
| 800 | 0.845 | 0.835 | 0.823 | 0.729 | 0.712 | 0.660 | 0.562 | 0.533 | 0.489 | 0.486 | ||
| 0.09 | 10 | 0.988 | 0.994 | 0.997 | 0.997 | 0.995 | 0.996 | 0.994 | 0.991 | 0.982 | 0.990 | |
| 30 | 0.992 | 0.990 | 0.998 | 1.000 | 0.996 | 0.995 | 0.991 | 0.989 | 0.989 | 0.982 | ||
| 50 | 0.982 | 0.988 | 0.997 | 0.994 | 0.990 | 0.992 | 0.987 | 0.976 | 0.966 | 0.954 | ||
| 70 | 0.987 | 0.997 | 0.995 | 0.996 | 0.992 | 0.981 | 0.971 | 0.972 | 0.945 | 0.919 | ||
| 100 | 0.986 | 0.994 | 0.996 | 0.992 | 0.993 | 0.985 | 0.967 | 0.949 | 0.943 | 0.937 | ||
| 200 | 0.979 | 0.991 | 0.984 | 0.987 | 0.967 | 0.975 | 0.954 | 0.941 | 0.933 | 0.906 | ||
| 400 | 0.970 | 0.964 | 0.956 | 0.961 | 0.954 | 0.943 | 0.932 | 0.921 | 0.903 | 0.886 | ||
| 600 | 0.940 | 0.944 | 0.926 | 0.926 | 0.914 | 0.919 | 0.899 | 0.852 | 0.829 | 0.845 | ||
| 800 | 0.923 | 0.916 | 0.933 | 0.925 | 0.877 | 0.890 | 0.835 | 0.812 | 0.790 | 0.774 | ||
| 0.25 | 10 | 0.985 | 0.992 | 0.998 | 0.998 | 0.994 | 0.992 | 0.990 | 0.988 | 0.985 | 0.975 | |
| 30 | 0.995 | 0.999 | 0.997 | 0.995 | 0.995 | 0.993 | 0.993 | 0.989 | 0.977 | 0.963 | ||
| 50 | 0.993 | 0.999 | 0.999 | 0.997 | 0.988 | 0.988 | 0.987 | 0.980 | 0.965 | 0.970 | ||
| 70 | 0.999 | 0.998 | 0.998 | 0.996 | 0.990 | 0.988 | 0.989 | 0.978 | 0.960 | 0.956 | ||
| 100 | 0.995 | 0.998 | 0.995 | 0.995 | 0.993 | 0.981 | 0.983 | 0.977 | 0.963 | 0.961 | ||
| 200 | 0.996 | 0.987 | 0.989 | 0.979 | 0.969 | 0.974 | 0.969 | 0.963 | 0.967 | 0.957 | ||
| 400 | 0.978 | 0.972 | 0.960 | 0.960 | 0.937 | 0.936 | 0.926 | 0.935 | 0.920 | 0.932 | ||
| 600 | 0.959 | 0.953 | 0.936 | 0.939 | 0.910 | 0.883 | 0.899 | 0.877 | 0.870 | 0.871 | ||
| 800 | 0.934 | 0.917 | 0.929 | 0.935 | 0.890 | 0.875 | 0.875 | 0.794 | 0.810 | 0.833 | ||
| 连续 | 0.09 | 10 | 0.992 | 0.996 | 0.992 | 0.994 | 0.994 | 0.995 | 0.996 | 0.990 | 0.980 | 0.980 |
| 30 | 0.989 | 0.992 | 0.994 | 0.998 | 0.996 | 0.992 | 0.993 | 0.992 | 0.982 | 0.965 | ||
| 50 | 0.986 | 0.994 | 0.996 | 0.997 | 0.994 | 0.986 | 0.977 | 0.972 | 0.969 | 0.965 | ||
| 70 | 0.990 | 0.995 | 0.996 | 0.996 | 0.995 | 0.985 | 0.981 | 0.952 | 0.947 | 0.935 | ||
| 100 | 0.988 | 0.998 | 0.991 | 0.992 | 0.995 | 0.990 | 0.979 | 0.969 | 0.952 | 0.934 | ||
| 200 | 0.985 | 0.984 | 0.979 | 0.986 | 0.980 | 0.971 | 0.961 | 0.939 | 0.950 | 0.924 | ||
| 400 | 0.984 | 0.976 | 0.968 | 0.958 | 0.937 | 0.948 | 0.943 | 0.915 | 0.881 | 0.878 | ||
| 600 | 0.979 | 0.949 | 0.948 | 0.939 | 0.918 | 0.883 | 0.897 | 0.881 | 0.839 | 0.859 | ||
| 800 | 0.961 | 0.939 | 0.920 | 0.899 | 0.885 | 0.866 | 0.869 | 0.840 | 0.786 | 0.817 | ||
附表12 研究二平衡设计各条件下线性混合效应模型收敛率
| L2_IV | I | J | ||||||||||
|---|---|---|---|---|---|---|---|---|---|---|---|---|
| 10 | 20 | 30 | 50 | 70 | 100 | 150 | 200 | 250 | 300 | |||
| 分类 | 0.01 | 10 | 0.982 | 0.994 | 0.992 | 0.987 | 0.989 | 0.983 | 0.984 | 0.984 | 0.976 | 0.972 |
| 30 | 0.983 | 0.985 | 0.978 | 0.977 | 0.976 | 0.970 | 0.966 | 0.961 | 0.967 | 0.968 | ||
| 50 | 0.985 | 0.977 | 0.970 | 0.970 | 0.966 | 0.962 | 0.958 | 0.932 | 0.941 | 0.947 | ||
| 70 | 0.973 | 0.970 | 0.962 | 0.972 | 0.946 | 0.937 | 0.923 | 0.920 | 0.901 | 0.905 | ||
| 100 | 0.969 | 0.965 | 0.951 | 0.935 | 0.922 | 0.928 | 0.882 | 0.863 | 0.879 | 0.857 | ||
| 200 | 0.942 | 0.948 | 0.907 | 0.911 | 0.861 | 0.801 | 0.791 | 0.765 | 0.743 | 0.733 | ||
| 400 | 0.898 | 0.883 | 0.878 | 0.844 | 0.790 | 0.775 | 0.677 | 0.638 | 0.604 | 0.606 | ||
| 600 | 0.876 | 0.846 | 0.842 | 0.805 | 0.736 | 0.655 | 0.613 | 0.575 | 0.553 | 0.527 | ||
| 800 | 0.845 | 0.835 | 0.823 | 0.729 | 0.712 | 0.660 | 0.562 | 0.533 | 0.489 | 0.486 | ||
| 0.09 | 10 | 0.988 | 0.994 | 0.997 | 0.997 | 0.995 | 0.996 | 0.994 | 0.991 | 0.982 | 0.990 | |
| 30 | 0.992 | 0.990 | 0.998 | 1.000 | 0.996 | 0.995 | 0.991 | 0.989 | 0.989 | 0.982 | ||
| 50 | 0.982 | 0.988 | 0.997 | 0.994 | 0.990 | 0.992 | 0.987 | 0.976 | 0.966 | 0.954 | ||
| 70 | 0.987 | 0.997 | 0.995 | 0.996 | 0.992 | 0.981 | 0.971 | 0.972 | 0.945 | 0.919 | ||
| 100 | 0.986 | 0.994 | 0.996 | 0.992 | 0.993 | 0.985 | 0.967 | 0.949 | 0.943 | 0.937 | ||
| 200 | 0.979 | 0.991 | 0.984 | 0.987 | 0.967 | 0.975 | 0.954 | 0.941 | 0.933 | 0.906 | ||
| 400 | 0.970 | 0.964 | 0.956 | 0.961 | 0.954 | 0.943 | 0.932 | 0.921 | 0.903 | 0.886 | ||
| 600 | 0.940 | 0.944 | 0.926 | 0.926 | 0.914 | 0.919 | 0.899 | 0.852 | 0.829 | 0.845 | ||
| 800 | 0.923 | 0.916 | 0.933 | 0.925 | 0.877 | 0.890 | 0.835 | 0.812 | 0.790 | 0.774 | ||
| 0.25 | 10 | 0.985 | 0.992 | 0.998 | 0.998 | 0.994 | 0.992 | 0.990 | 0.988 | 0.985 | 0.975 | |
| 30 | 0.995 | 0.999 | 0.997 | 0.995 | 0.995 | 0.993 | 0.993 | 0.989 | 0.977 | 0.963 | ||
| 50 | 0.993 | 0.999 | 0.999 | 0.997 | 0.988 | 0.988 | 0.987 | 0.980 | 0.965 | 0.970 | ||
| 70 | 0.999 | 0.998 | 0.998 | 0.996 | 0.990 | 0.988 | 0.989 | 0.978 | 0.960 | 0.956 | ||
| 100 | 0.995 | 0.998 | 0.995 | 0.995 | 0.993 | 0.981 | 0.983 | 0.977 | 0.963 | 0.961 | ||
| 200 | 0.996 | 0.987 | 0.989 | 0.979 | 0.969 | 0.974 | 0.969 | 0.963 | 0.967 | 0.957 | ||
| 400 | 0.978 | 0.972 | 0.960 | 0.960 | 0.937 | 0.936 | 0.926 | 0.935 | 0.920 | 0.932 | ||
| 600 | 0.959 | 0.953 | 0.936 | 0.939 | 0.910 | 0.883 | 0.899 | 0.877 | 0.870 | 0.871 | ||
| 800 | 0.934 | 0.917 | 0.929 | 0.935 | 0.890 | 0.875 | 0.875 | 0.794 | 0.810 | 0.833 | ||
| 连续 | 0.09 | 10 | 0.992 | 0.996 | 0.992 | 0.994 | 0.994 | 0.995 | 0.996 | 0.990 | 0.980 | 0.980 |
| 30 | 0.989 | 0.992 | 0.994 | 0.998 | 0.996 | 0.992 | 0.993 | 0.992 | 0.982 | 0.965 | ||
| 50 | 0.986 | 0.994 | 0.996 | 0.997 | 0.994 | 0.986 | 0.977 | 0.972 | 0.969 | 0.965 | ||
| 70 | 0.990 | 0.995 | 0.996 | 0.996 | 0.995 | 0.985 | 0.981 | 0.952 | 0.947 | 0.935 | ||
| 100 | 0.988 | 0.998 | 0.991 | 0.992 | 0.995 | 0.990 | 0.979 | 0.969 | 0.952 | 0.934 | ||
| 200 | 0.985 | 0.984 | 0.979 | 0.986 | 0.980 | 0.971 | 0.961 | 0.939 | 0.950 | 0.924 | ||
| 400 | 0.984 | 0.976 | 0.968 | 0.958 | 0.937 | 0.948 | 0.943 | 0.915 | 0.881 | 0.878 | ||
| 600 | 0.979 | 0.949 | 0.948 | 0.939 | 0.918 | 0.883 | 0.897 | 0.881 | 0.839 | 0.859 | ||
| 800 | 0.961 | 0.939 | 0.920 | 0.899 | 0.885 | 0.866 | 0.869 | 0.840 | 0.786 | 0.817 | ||
| I | J | |||||||||
|---|---|---|---|---|---|---|---|---|---|---|
| 10 | 20 | 30 | 50 | 70 | 100 | 150 | 200 | 250 | 300 | |
| 10 | 0.979 | 0.991 | 0.992 | 0.993 | 0.994 | 0.997 | 0.994 | 0.986 | 0.988 | 0.980 |
| 30 | 0.992 | 0.992 | 0.994 | 0.996 | 0.997 | 0.995 | 0.993 | 0.983 | 0.982 | 0.976 |
| 50 | 0.992 | 0.996 | 0.993 | 0.996 | 0.991 | 0.989 | 0.976 | 0.970 | 0.959 | 0.956 |
| 70 | 0.983 | 0.992 | 0.994 | 0.995 | 0.992 | 0.984 | 0.978 | 0.965 | 0.950 | 0.942 |
| 100 | 0.982 | 0.989 | 0.997 | 0.996 | 0.995 | 0.992 | 0.977 | 0.966 | 0.942 | 0.933 |
| 200 | 0.978 | 0.990 | 0.975 | 0.977 | 0.975 | 0.967 | 0.955 | 0.925 | 0.921 | 0.908 |
| 400 | 0.960 | 0.967 | 0.959 | 0.960 | 0.951 | 0.947 | 0.924 | 0.895 | 0.880 | 0.879 |
| 600 | 0.932 | 0.949 | 0.924 | 0.930 | 0.916 | 0.918 | 0.897 | 0.848 | 0.861 | 0.809 |
| 800 | 0.930 | 0.934 | 0.925 | 0.908 | 0.883 | 0.883 | 0.854 | 0.802 | 0.809 | 0.775 |
附表13 研究二非平衡设计$\tau _{11}^{2}$为中等时线性混合效应模型收敛率
| I | J | |||||||||
|---|---|---|---|---|---|---|---|---|---|---|
| 10 | 20 | 30 | 50 | 70 | 100 | 150 | 200 | 250 | 300 | |
| 10 | 0.979 | 0.991 | 0.992 | 0.993 | 0.994 | 0.997 | 0.994 | 0.986 | 0.988 | 0.980 |
| 30 | 0.992 | 0.992 | 0.994 | 0.996 | 0.997 | 0.995 | 0.993 | 0.983 | 0.982 | 0.976 |
| 50 | 0.992 | 0.996 | 0.993 | 0.996 | 0.991 | 0.989 | 0.976 | 0.970 | 0.959 | 0.956 |
| 70 | 0.983 | 0.992 | 0.994 | 0.995 | 0.992 | 0.984 | 0.978 | 0.965 | 0.950 | 0.942 |
| 100 | 0.982 | 0.989 | 0.997 | 0.996 | 0.995 | 0.992 | 0.977 | 0.966 | 0.942 | 0.933 |
| 200 | 0.978 | 0.990 | 0.975 | 0.977 | 0.975 | 0.967 | 0.955 | 0.925 | 0.921 | 0.908 |
| 400 | 0.960 | 0.967 | 0.959 | 0.960 | 0.951 | 0.947 | 0.924 | 0.895 | 0.880 | 0.879 |
| 600 | 0.932 | 0.949 | 0.924 | 0.930 | 0.916 | 0.918 | 0.897 | 0.848 | 0.861 | 0.809 |
| 800 | 0.930 | 0.934 | 0.925 | 0.908 | 0.883 | 0.883 | 0.854 | 0.802 | 0.809 | 0.775 |
| L2_IV | $τ_{11.std}^{2}$ | I | J | |||||||||
|---|---|---|---|---|---|---|---|---|---|---|---|---|
| 10 | 20 | 30 | 50 | 70 | 100 | 150 | 200 | 250 | 300 | |||
| 分类 | 0.01 | 10 | 0.042 | 0.040 | 0.042 | 0.037 | 0.048 | 0.055 | 0.076 | 0.084 | 0.081 | 0.081 |
| 30 | 0.046 | 0.065 | 0.058 | 0.082 | 0.074 | 0.104 | 0.101 | 0.151 | 0.155 | 0.165 | ||
| 50 | 0.053 | 0.047 | 0.074 | 0.087 | 0.102 | 0.146 | 0.147 | 0.176 | 0.173 | 0.201 | ||
| 70 | 0.045 | 0.073 | 0.074 | 0.101 | 0.118 | 0.137 | 0.177 | 0.248 | 0.273 | 0.267 | ||
| 100 | 0.059 | 0.086 | 0.095 | 0.134 | 0.150 | 0.182 | 0.268 | 0.287 | 0.382 | 0.396 | ||
| 200 | 0.086 | 0.100 | 0.138 | 0.213 | 0.266 | 0.351 | 0.483 | 0.535 | 0.611 | 0.630 | ||
| 400 | 0.134 | 0.196 | 0.265 | 0.391 | 0.463 | 0.628 | 0.742 | 0.839 | 0.843 | 0.884 | ||
| 600 | 0.166 | 0.259 | 0.357 | 0.550 | 0.645 | 0.768 | 0.896 | 0.946 | 0.973 | 0.983 | ||
| 800 | 0.169 | 0.320 | 0.430 | 0.676 | 0.764 | 0.888 | 0.954 | 0.983 | 0.998 | 0.998 | ||
| 0.09 | 10 | 0.061 | 0.075 | 0.096 | 0.112 | 0.119 | 0.122 | 0.132 | 0.148 | 0.131 | 0.138 | |
| 30 | 0.097 | 0.129 | 0.148 | 0.179 | 0.212 | 0.205 | 0.215 | 0.236 | 0.249 | 0.247 | ||
| 50 | 0.129 | 0.160 | 0.197 | 0.246 | 0.294 | 0.321 | 0.332 | 0.373 | 0.362 | 0.389 | ||
| 70 | 0.148 | 0.203 | 0.258 | 0.340 | 0.402 | 0.405 | 0.438 | 0.477 | 0.468 | 0.513 | ||
| 100 | 0.182 | 0.277 | 0.322 | 0.455 | 0.494 | 0.528 | 0.590 | 0.646 | 0.617 | 0.644 | ||
| 200 | 0.314 | 0.497 | 0.613 | 0.732 | 0.804 | 0.844 | 0.882 | 0.879 | 0.921 | 0.919 | ||
| 400 | 0.533 | 0.797 | 0.881 | 0.947 | 0.974 | 0.989 | 0.992 | 0.996 | 0.994 | 0.995 | ||
| 600 | 0.747 | 0.924 | 0.975 | 0.995 | 0.998 | 0.999 | 1.000 | 1.000 | 1.000 | 1.000 | ||
| 800 | 0.859 | 0.976 | 0.995 | 1.000 | 1.000 | 1.000 | 1.000 | 1.000 | 1.000 | 1.000 | ||
| 0.25 | 10 | 0.097 | 0.093 | 0.121 | 0.129 | 0.128 | 0.123 | 0.134 | 0.133 | 0.124 | 0.145 | |
| 30 | 0.124 | 0.166 | 0.188 | 0.227 | 0.223 | 0.246 | 0.241 | 0.246 | 0.240 | 0.253 | ||
| 50 | 0.199 | 0.257 | 0.301 | 0.359 | 0.353 | 0.389 | 0.383 | 0.403 | 0.378 | 0.415 | ||
| 70 | 0.262 | 0.343 | 0.395 | 0.443 | 0.473 | 0.496 | 0.476 | 0.494 | 0.509 | 0.515 | ||
| 100 | 0.339 | 0.455 | 0.509 | 0.576 | 0.615 | 0.598 | 0.649 | 0.664 | 0.651 | 0.682 | ||
| 200 | 0.597 | 0.753 | 0.792 | 0.864 | 0.889 | 0.916 | 0.918 | 0.924 | 0.921 | 0.936 | ||
| 400 | 0.874 | 0.962 | 0.977 | 0.989 | 0.994 | 0.998 | 1.000 | 0.999 | 1.000 | 0.999 | ||
| 600 | 0.969 | 0.998 | 0.998 | 1.000 | 1.000 | 1.000 | 1.000 | 1.000 | 1.000 | 1.000 | ||
| 800 | 0.993 | 1.000 | 1.000 | 1.000 | 1.000 | 1.000 | 1.000 | 1.000 | 1.000 | 1.000 | ||
| 连续 | 0.09 | 10 | 0.075 | 0.090 | 0.099 | 0.137 | 0.133 | 0.145 | 0.158 | 0.153 | 0.148 | 0.157 |
| 30 | 0.117 | 0.138 | 0.181 | 0.242 | 0.239 | 0.257 | 0.310 | 0.298 | 0.324 | 0.337 | ||
| 50 | 0.151 | 0.232 | 0.243 | 0.357 | 0.374 | 0.434 | 0.451 | 0.459 | 0.490 | 0.515 | ||
| 70 | 0.191 | 0.307 | 0.364 | 0.420 | 0.481 | 0.560 | 0.581 | 0.599 | 0.634 | 0.645 | ||
| 100 | 0.241 | 0.410 | 0.461 | 0.602 | 0.644 | 0.687 | 0.754 | 0.757 | 0.794 | 0.803 | ||
| 200 | 0.451 | 0.680 | 0.752 | 0.872 | 0.911 | 0.921 | 0.966 | 0.966 | 0.983 | 0.976 | ||
| 400 | 0.730 | 0.931 | 0.972 | 0.991 | 0.995 | 0.998 | 1.000 | 1.000 | 1.000 | 1.000 | ||
| 600 | 0.890 | 0.984 | 0.993 | 0.999 | 1.000 | 1.000 | 1.000 | 1.000 | 1.000 | 1.000 | ||
| 800 | 0.963 | 0.999 | 0.998 | 1.000 | 1.000 | 1.000 | 1.000 | 1.000 | 1.000 | 1.000 | ||
附表14 研究二平衡设计各条件下线性混合效应模型水平2自变量调节效应的检验力
| L2_IV | $τ_{11.std}^{2}$ | I | J | |||||||||
|---|---|---|---|---|---|---|---|---|---|---|---|---|
| 10 | 20 | 30 | 50 | 70 | 100 | 150 | 200 | 250 | 300 | |||
| 分类 | 0.01 | 10 | 0.042 | 0.040 | 0.042 | 0.037 | 0.048 | 0.055 | 0.076 | 0.084 | 0.081 | 0.081 |
| 30 | 0.046 | 0.065 | 0.058 | 0.082 | 0.074 | 0.104 | 0.101 | 0.151 | 0.155 | 0.165 | ||
| 50 | 0.053 | 0.047 | 0.074 | 0.087 | 0.102 | 0.146 | 0.147 | 0.176 | 0.173 | 0.201 | ||
| 70 | 0.045 | 0.073 | 0.074 | 0.101 | 0.118 | 0.137 | 0.177 | 0.248 | 0.273 | 0.267 | ||
| 100 | 0.059 | 0.086 | 0.095 | 0.134 | 0.150 | 0.182 | 0.268 | 0.287 | 0.382 | 0.396 | ||
| 200 | 0.086 | 0.100 | 0.138 | 0.213 | 0.266 | 0.351 | 0.483 | 0.535 | 0.611 | 0.630 | ||
| 400 | 0.134 | 0.196 | 0.265 | 0.391 | 0.463 | 0.628 | 0.742 | 0.839 | 0.843 | 0.884 | ||
| 600 | 0.166 | 0.259 | 0.357 | 0.550 | 0.645 | 0.768 | 0.896 | 0.946 | 0.973 | 0.983 | ||
| 800 | 0.169 | 0.320 | 0.430 | 0.676 | 0.764 | 0.888 | 0.954 | 0.983 | 0.998 | 0.998 | ||
| 0.09 | 10 | 0.061 | 0.075 | 0.096 | 0.112 | 0.119 | 0.122 | 0.132 | 0.148 | 0.131 | 0.138 | |
| 30 | 0.097 | 0.129 | 0.148 | 0.179 | 0.212 | 0.205 | 0.215 | 0.236 | 0.249 | 0.247 | ||
| 50 | 0.129 | 0.160 | 0.197 | 0.246 | 0.294 | 0.321 | 0.332 | 0.373 | 0.362 | 0.389 | ||
| 70 | 0.148 | 0.203 | 0.258 | 0.340 | 0.402 | 0.405 | 0.438 | 0.477 | 0.468 | 0.513 | ||
| 100 | 0.182 | 0.277 | 0.322 | 0.455 | 0.494 | 0.528 | 0.590 | 0.646 | 0.617 | 0.644 | ||
| 200 | 0.314 | 0.497 | 0.613 | 0.732 | 0.804 | 0.844 | 0.882 | 0.879 | 0.921 | 0.919 | ||
| 400 | 0.533 | 0.797 | 0.881 | 0.947 | 0.974 | 0.989 | 0.992 | 0.996 | 0.994 | 0.995 | ||
| 600 | 0.747 | 0.924 | 0.975 | 0.995 | 0.998 | 0.999 | 1.000 | 1.000 | 1.000 | 1.000 | ||
| 800 | 0.859 | 0.976 | 0.995 | 1.000 | 1.000 | 1.000 | 1.000 | 1.000 | 1.000 | 1.000 | ||
| 0.25 | 10 | 0.097 | 0.093 | 0.121 | 0.129 | 0.128 | 0.123 | 0.134 | 0.133 | 0.124 | 0.145 | |
| 30 | 0.124 | 0.166 | 0.188 | 0.227 | 0.223 | 0.246 | 0.241 | 0.246 | 0.240 | 0.253 | ||
| 50 | 0.199 | 0.257 | 0.301 | 0.359 | 0.353 | 0.389 | 0.383 | 0.403 | 0.378 | 0.415 | ||
| 70 | 0.262 | 0.343 | 0.395 | 0.443 | 0.473 | 0.496 | 0.476 | 0.494 | 0.509 | 0.515 | ||
| 100 | 0.339 | 0.455 | 0.509 | 0.576 | 0.615 | 0.598 | 0.649 | 0.664 | 0.651 | 0.682 | ||
| 200 | 0.597 | 0.753 | 0.792 | 0.864 | 0.889 | 0.916 | 0.918 | 0.924 | 0.921 | 0.936 | ||
| 400 | 0.874 | 0.962 | 0.977 | 0.989 | 0.994 | 0.998 | 1.000 | 0.999 | 1.000 | 0.999 | ||
| 600 | 0.969 | 0.998 | 0.998 | 1.000 | 1.000 | 1.000 | 1.000 | 1.000 | 1.000 | 1.000 | ||
| 800 | 0.993 | 1.000 | 1.000 | 1.000 | 1.000 | 1.000 | 1.000 | 1.000 | 1.000 | 1.000 | ||
| 连续 | 0.09 | 10 | 0.075 | 0.090 | 0.099 | 0.137 | 0.133 | 0.145 | 0.158 | 0.153 | 0.148 | 0.157 |
| 30 | 0.117 | 0.138 | 0.181 | 0.242 | 0.239 | 0.257 | 0.310 | 0.298 | 0.324 | 0.337 | ||
| 50 | 0.151 | 0.232 | 0.243 | 0.357 | 0.374 | 0.434 | 0.451 | 0.459 | 0.490 | 0.515 | ||
| 70 | 0.191 | 0.307 | 0.364 | 0.420 | 0.481 | 0.560 | 0.581 | 0.599 | 0.634 | 0.645 | ||
| 100 | 0.241 | 0.410 | 0.461 | 0.602 | 0.644 | 0.687 | 0.754 | 0.757 | 0.794 | 0.803 | ||
| 200 | 0.451 | 0.680 | 0.752 | 0.872 | 0.911 | 0.921 | 0.966 | 0.966 | 0.983 | 0.976 | ||
| 400 | 0.730 | 0.931 | 0.972 | 0.991 | 0.995 | 0.998 | 1.000 | 1.000 | 1.000 | 1.000 | ||
| 600 | 0.890 | 0.984 | 0.993 | 0.999 | 1.000 | 1.000 | 1.000 | 1.000 | 1.000 | 1.000 | ||
| 800 | 0.963 | 0.999 | 0.998 | 1.000 | 1.000 | 1.000 | 1.000 | 1.000 | 1.000 | 1.000 | ||
| I | J | |||||||||
|---|---|---|---|---|---|---|---|---|---|---|
| 10 | 20 | 30 | 50 | 70 | 100 | 150 | 200 | 250 | 300 | |
| 10 | 0.067 | 0.077 | 0.084 | 0.081 | 0.097 | 0.100 | 0.105 | 0.104 | 0.105 | 0.135 |
| 30 | 0.076 | 0.102 | 0.110 | 0.141 | 0.152 | 0.134 | 0.157 | 0.179 | 0.175 | 0.176 |
| 50 | 0.089 | 0.148 | 0.151 | 0.178 | 0.223 | 0.230 | 0.268 | 0.252 | 0.253 | 0.271 |
| 70 | 0.121 | 0.161 | 0.181 | 0.230 | 0.255 | 0.275 | 0.321 | 0.317 | 0.354 | 0.304 |
| 100 | 0.136 | 0.196 | 0.241 | 0.301 | 0.362 | 0.402 | 0.427 | 0.431 | 0.425 | 0.442 |
| 200 | 0.220 | 0.340 | 0.424 | 0.504 | 0.599 | 0.631 | 0.691 | 0.710 | 0.727 | 0.750 |
| 400 | 0.413 | 0.631 | 0.736 | 0.838 | 0.865 | 0.925 | 0.947 | 0.951 | 0.956 | 0.968 |
| 600 | 0.550 | 0.777 | 0.869 | 0.953 | 0.972 | 0.981 | 0.988 | 0.992 | 0.992 | 0.995 |
| 800 | 0.676 | 0.876 | 0.947 | 0.979 | 0.994 | 0.995 | 0.998 | 0.999 | 1.000 | 1.000 |
附表15 研究二非平衡设计$\tau _{11}^{2}$为中等时线性混合效应模型水平2自变量调节效应的检验力
| I | J | |||||||||
|---|---|---|---|---|---|---|---|---|---|---|
| 10 | 20 | 30 | 50 | 70 | 100 | 150 | 200 | 250 | 300 | |
| 10 | 0.067 | 0.077 | 0.084 | 0.081 | 0.097 | 0.100 | 0.105 | 0.104 | 0.105 | 0.135 |
| 30 | 0.076 | 0.102 | 0.110 | 0.141 | 0.152 | 0.134 | 0.157 | 0.179 | 0.175 | 0.176 |
| 50 | 0.089 | 0.148 | 0.151 | 0.178 | 0.223 | 0.230 | 0.268 | 0.252 | 0.253 | 0.271 |
| 70 | 0.121 | 0.161 | 0.181 | 0.230 | 0.255 | 0.275 | 0.321 | 0.317 | 0.354 | 0.304 |
| 100 | 0.136 | 0.196 | 0.241 | 0.301 | 0.362 | 0.402 | 0.427 | 0.431 | 0.425 | 0.442 |
| 200 | 0.220 | 0.340 | 0.424 | 0.504 | 0.599 | 0.631 | 0.691 | 0.710 | 0.727 | 0.750 |
| 400 | 0.413 | 0.631 | 0.736 | 0.838 | 0.865 | 0.925 | 0.947 | 0.951 | 0.956 | 0.968 |
| 600 | 0.550 | 0.777 | 0.869 | 0.953 | 0.972 | 0.981 | 0.988 | 0.992 | 0.992 | 0.995 |
| 800 | 0.676 | 0.876 | 0.947 | 0.979 | 0.994 | 0.995 | 0.998 | 0.999 | 1.000 | 1.000 |
| criteria | I | J | |||||||||
|---|---|---|---|---|---|---|---|---|---|---|---|
| 10 | 20 | 30 | 50 | 70 | 100 | 150 | 200 | 250 | 300 | ||
| bias | 10 | 0.016 | 0.000 | 0.002 | -0.003 | -0.006 | 0.002 | 0.000 | -0.003 | -0.003 | -0.003 |
| 30 | -0.002 | -0.005 | -0.003 | 0.009 | -0.003 | 0.001 | -0.002 | 0.000 | 0.001 | 0.002 | |
| 50 | 0.000 | 0.003 | -0.002 | 0.001 | -0.001 | -0.001 | -0.003 | 0.000 | 0.000 | 0.000 | |
| 70 | 0.000 | 0.003 | -0.002 | 0.000 | -0.002 | -0.002 | -0.002 | 0.001 | 0.000 | -0.002 | |
| 100 | -0.005 | -0.004 | 0.001 | -0.001 | 0.001 | -0.002 | 0.001 | -0.001 | 0.002 | 0.000 | |
| 200 | 0.000 | -0.002 | -0.001 | -0.001 | -0.001 | -0.001 | 0.001 | 0.000 | 0.000 | 0.000 | |
| 400 | 0.005 | 0.001 | 0.001 | 0.000 | -0.001 | 0.001 | -0.001 | 0.001 | -0.001 | 0.000 | |
| 600 | 0.000 | -0.002 | -0.001 | 0.000 | 0.000 | -0.001 | 0.000 | 0.000 | 0.000 | -0.001 | |
| 800 | -0.001 | -0.001 | -0.002 | 0.001 | 0.000 | 0.001 | 0.001 | 0.001 | 0.000 | 0.000 | |
| rbias | 10 | 0.032 | 0.000 | 0.005 | 0.007 | 0.013 | 0.005 | 0.001 | 0.006 | 0.006 | 0.005 |
| 30 | 0.003 | 0.011 | 0.006 | 0.017 | 0.006 | 0.003 | 0.004 | 0.001 | 0.001 | 0.004 | |
| 50 | 0.000 | 0.007 | 0.004 | 0.002 | 0.003 | 0.002 | 0.005 | 0.001 | 0.001 | 0.001 | |
| 70 | 0.001 | 0.005 | 0.005 | 0.000 | 0.005 | 0.004 | 0.005 | 0.002 | 0.000 | 0.004 | |
| 100 | 0.010 | 0.008 | 0.002 | 0.003 | 0.001 | 0.003 | 0.002 | 0.003 | 0.004 | 0.000 | |
| 200 | 0.001 | 0.004 | 0.003 | 0.002 | 0.002 | 0.002 | 0.002 | 0.001 | 0.001 | 0.000 | |
| 400 | 0.009 | 0.002 | 0.001 | 0.001 | 0.002 | 0.002 | 0.002 | 0.001 | 0.002 | 0.000 | |
| 600 | 0.001 | 0.004 | 0.002 | 0.001 | 0.001 | 0.002 | 0.001 | 0.001 | 0.000 | 0.001 | |
| 800 | 0.002 | 0.003 | 0.004 | 0.002 | 0.001 | 0.002 | 0.001 | 0.003 | 0.001 | 0.001 | |
| RMSE | 10 | 0.398 | 0.284 | 0.236 | 0.189 | 0.162 | 0.141 | 0.121 | 0.111 | 0.098 | 0.094 |
| 30 | 0.235 | 0.176 | 0.140 | 0.109 | 0.094 | 0.082 | 0.068 | 0.065 | 0.060 | 0.054 | |
| 50 | 0.181 | 0.128 | 0.106 | 0.085 | 0.073 | 0.066 | 0.055 | 0.047 | 0.043 | 0.043 | |
| 70 | 0.149 | 0.108 | 0.091 | 0.073 | 0.062 | 0.052 | 0.046 | 0.042 | 0.039 | 0.037 | |
| 100 | 0.133 | 0.093 | 0.076 | 0.062 | 0.052 | 0.045 | 0.039 | 0.034 | 0.032 | 0.031 | |
| 200 | 0.092 | 0.064 | 0.054 | 0.042 | 0.035 | 0.033 | 0.027 | 0.026 | 0.023 | 0.022 | |
| 400 | 0.064 | 0.045 | 0.038 | 0.032 | 0.028 | 0.022 | 0.018 | 0.017 | 0.017 | 0.016 | |
| 600 | 0.054 | 0.038 | 0.031 | 0.025 | 0.022 | 0.018 | 0.015 | 0.014 | 0.013 | 0.012 | |
| 800 | 0.045 | 0.032 | 0.027 | 0.022 | 0.019 | 0.016 | 0.014 | 0.012 | 0.012 | 0.011 | |
| width | 10 | 1.818 | 1.353 | 1.187 | 1.007 | 0.939 | 0.880 | 0.836 | 0.816 | 0.798 | 0.789 |
| 30 | 1.020 | 0.771 | 0.667 | 0.585 | 0.548 | 0.512 | 0.485 | 0.474 | 0.465 | 0.458 | |
| 50 | 0.783 | 0.595 | 0.522 | 0.454 | 0.423 | 0.397 | 0.378 | 0.367 | 0.361 | 0.355 | |
| 70 | 0.660 | 0.503 | 0.442 | 0.386 | 0.358 | 0.338 | 0.319 | 0.310 | 0.305 | 0.301 | |
| 100 | 0.549 | 0.421 | 0.368 | 0.323 | 0.300 | 0.282 | 0.267 | 0.260 | 0.255 | 0.252 | |
| 200 | 0.388 | 0.299 | 0.262 | 0.228 | 0.212 | 0.200 | 0.189 | 0.184 | 0.181 | 0.178 | |
| 400 | 0.274 | 0.211 | 0.185 | 0.161 | 0.150 | 0.141 | 0.134 | 0.130 | 0.128 | 0.126 | |
| 600 | 0.224 | 0.172 | 0.152 | 0.132 | 0.123 | 0.115 | 0.109 | 0.106 | 0.104 | 0.103 | |
| 800 | 0.194 | 0.149 | 0.131 | 0.114 | 0.106 | 0.100 | 0.095 | 0.092 | 0.090 | 0.089 | |
| CP | 10 | 0.957 | 0.963 | 0.959 | 0.957 | 0.956 | 0.963 | 0.949 | 0.935 | 0.951 | 0.936 |
| 30 | 0.963 | 0.949 | 0.944 | 0.959 | 0.955 | 0.953 | 0.957 | 0.948 | 0.938 | 0.946 | |
| 50 | 0.949 | 0.960 | 0.953 | 0.954 | 0.957 | 0.940 | 0.943 | 0.964 | 0.953 | 0.943 | |
| 70 | 0.957 | 0.959 | 0.947 | 0.948 | 0.947 | 0.964 | 0.943 | 0.939 | 0.938 | 0.939 | |
| 100 | 0.953 | 0.941 | 0.963 | 0.933 | 0.956 | 0.945 | 0.948 | 0.956 | 0.958 | 0.949 | |
| 200 | 0.949 | 0.962 | 0.950 | 0.951 | 0.955 | 0.940 | 0.946 | 0.937 | 0.952 | 0.960 | |
| 400 | 0.951 | 0.950 | 0.945 | 0.942 | 0.932 | 0.957 | 0.957 | 0.962 | 0.944 | 0.937 | |
| 600 | 0.946 | 0.963 | 0.956 | 0.950 | 0.933 | 0.953 | 0.964 | 0.953 | 0.957 | 0.958 | |
| 800 | 0.948 | 0.962 | 0.950 | 0.945 | 0.944 | 0.929 | 0.923 | 0.951 | 0.945 | 0.953 | |
| SE-SD bias | 10 | 0.049 | 0.033 | 0.026 | 0.015 | 0.013 | 0.006 | 0.005 | 0.000 | 0.005 | 0.002 |
| 30 | 0.009 | -0.002 | 0.004 | 0.004 | 0.003 | 0.000 | 0.002 | -0.002 | -0.002 | 0.001 | |
| 50 | 0.006 | 0.006 | 0.004 | 0.002 | 0.002 | -0.003 | -0.001 | 0.003 | 0.002 | 0.000 | |
| 70 | 0.009 | 0.004 | 0.002 | 0.000 | 0.000 | 0.002 | 0.000 | -0.001 | -0.001 | 0.000 | |
| 100 | -0.002 | 0.000 | 0.001 | -0.002 | 0.001 | 0.000 | 0.000 | 0.001 | 0.000 | 0.000 | |
| 200 | 0.000 | 0.002 | 0.000 | 0.000 | 0.002 | -0.001 | 0.000 | -0.001 | 0.000 | 0.000 | |
| 400 | 0.001 | 0.001 | 0.000 | -0.002 | -0.002 | 0.001 | 0.001 | 0.000 | 0.000 | -0.001 | |
| 600 | -0.001 | 0.000 | 0.000 | 0.000 | -0.001 | 0.000 | 0.001 | 0.000 | 0.000 | 0.000 | |
| 800 | 0.001 | 0.001 | 0.000 | 0.000 | 0.000 | 0.000 | -0.001 | 0.000 | 0.000 | 0.000 | |
附表16 研究二平衡设计$\tau _{11}^{2}$小且${{W}_{i}}$为分类变量时线性混合效应模型水平2自变量调节效应量及其标准误估计准确性
| criteria | I | J | |||||||||
|---|---|---|---|---|---|---|---|---|---|---|---|
| 10 | 20 | 30 | 50 | 70 | 100 | 150 | 200 | 250 | 300 | ||
| bias | 10 | 0.016 | 0.000 | 0.002 | -0.003 | -0.006 | 0.002 | 0.000 | -0.003 | -0.003 | -0.003 |
| 30 | -0.002 | -0.005 | -0.003 | 0.009 | -0.003 | 0.001 | -0.002 | 0.000 | 0.001 | 0.002 | |
| 50 | 0.000 | 0.003 | -0.002 | 0.001 | -0.001 | -0.001 | -0.003 | 0.000 | 0.000 | 0.000 | |
| 70 | 0.000 | 0.003 | -0.002 | 0.000 | -0.002 | -0.002 | -0.002 | 0.001 | 0.000 | -0.002 | |
| 100 | -0.005 | -0.004 | 0.001 | -0.001 | 0.001 | -0.002 | 0.001 | -0.001 | 0.002 | 0.000 | |
| 200 | 0.000 | -0.002 | -0.001 | -0.001 | -0.001 | -0.001 | 0.001 | 0.000 | 0.000 | 0.000 | |
| 400 | 0.005 | 0.001 | 0.001 | 0.000 | -0.001 | 0.001 | -0.001 | 0.001 | -0.001 | 0.000 | |
| 600 | 0.000 | -0.002 | -0.001 | 0.000 | 0.000 | -0.001 | 0.000 | 0.000 | 0.000 | -0.001 | |
| 800 | -0.001 | -0.001 | -0.002 | 0.001 | 0.000 | 0.001 | 0.001 | 0.001 | 0.000 | 0.000 | |
| rbias | 10 | 0.032 | 0.000 | 0.005 | 0.007 | 0.013 | 0.005 | 0.001 | 0.006 | 0.006 | 0.005 |
| 30 | 0.003 | 0.011 | 0.006 | 0.017 | 0.006 | 0.003 | 0.004 | 0.001 | 0.001 | 0.004 | |
| 50 | 0.000 | 0.007 | 0.004 | 0.002 | 0.003 | 0.002 | 0.005 | 0.001 | 0.001 | 0.001 | |
| 70 | 0.001 | 0.005 | 0.005 | 0.000 | 0.005 | 0.004 | 0.005 | 0.002 | 0.000 | 0.004 | |
| 100 | 0.010 | 0.008 | 0.002 | 0.003 | 0.001 | 0.003 | 0.002 | 0.003 | 0.004 | 0.000 | |
| 200 | 0.001 | 0.004 | 0.003 | 0.002 | 0.002 | 0.002 | 0.002 | 0.001 | 0.001 | 0.000 | |
| 400 | 0.009 | 0.002 | 0.001 | 0.001 | 0.002 | 0.002 | 0.002 | 0.001 | 0.002 | 0.000 | |
| 600 | 0.001 | 0.004 | 0.002 | 0.001 | 0.001 | 0.002 | 0.001 | 0.001 | 0.000 | 0.001 | |
| 800 | 0.002 | 0.003 | 0.004 | 0.002 | 0.001 | 0.002 | 0.001 | 0.003 | 0.001 | 0.001 | |
| RMSE | 10 | 0.398 | 0.284 | 0.236 | 0.189 | 0.162 | 0.141 | 0.121 | 0.111 | 0.098 | 0.094 |
| 30 | 0.235 | 0.176 | 0.140 | 0.109 | 0.094 | 0.082 | 0.068 | 0.065 | 0.060 | 0.054 | |
| 50 | 0.181 | 0.128 | 0.106 | 0.085 | 0.073 | 0.066 | 0.055 | 0.047 | 0.043 | 0.043 | |
| 70 | 0.149 | 0.108 | 0.091 | 0.073 | 0.062 | 0.052 | 0.046 | 0.042 | 0.039 | 0.037 | |
| 100 | 0.133 | 0.093 | 0.076 | 0.062 | 0.052 | 0.045 | 0.039 | 0.034 | 0.032 | 0.031 | |
| 200 | 0.092 | 0.064 | 0.054 | 0.042 | 0.035 | 0.033 | 0.027 | 0.026 | 0.023 | 0.022 | |
| 400 | 0.064 | 0.045 | 0.038 | 0.032 | 0.028 | 0.022 | 0.018 | 0.017 | 0.017 | 0.016 | |
| 600 | 0.054 | 0.038 | 0.031 | 0.025 | 0.022 | 0.018 | 0.015 | 0.014 | 0.013 | 0.012 | |
| 800 | 0.045 | 0.032 | 0.027 | 0.022 | 0.019 | 0.016 | 0.014 | 0.012 | 0.012 | 0.011 | |
| width | 10 | 1.818 | 1.353 | 1.187 | 1.007 | 0.939 | 0.880 | 0.836 | 0.816 | 0.798 | 0.789 |
| 30 | 1.020 | 0.771 | 0.667 | 0.585 | 0.548 | 0.512 | 0.485 | 0.474 | 0.465 | 0.458 | |
| 50 | 0.783 | 0.595 | 0.522 | 0.454 | 0.423 | 0.397 | 0.378 | 0.367 | 0.361 | 0.355 | |
| 70 | 0.660 | 0.503 | 0.442 | 0.386 | 0.358 | 0.338 | 0.319 | 0.310 | 0.305 | 0.301 | |
| 100 | 0.549 | 0.421 | 0.368 | 0.323 | 0.300 | 0.282 | 0.267 | 0.260 | 0.255 | 0.252 | |
| 200 | 0.388 | 0.299 | 0.262 | 0.228 | 0.212 | 0.200 | 0.189 | 0.184 | 0.181 | 0.178 | |
| 400 | 0.274 | 0.211 | 0.185 | 0.161 | 0.150 | 0.141 | 0.134 | 0.130 | 0.128 | 0.126 | |
| 600 | 0.224 | 0.172 | 0.152 | 0.132 | 0.123 | 0.115 | 0.109 | 0.106 | 0.104 | 0.103 | |
| 800 | 0.194 | 0.149 | 0.131 | 0.114 | 0.106 | 0.100 | 0.095 | 0.092 | 0.090 | 0.089 | |
| CP | 10 | 0.957 | 0.963 | 0.959 | 0.957 | 0.956 | 0.963 | 0.949 | 0.935 | 0.951 | 0.936 |
| 30 | 0.963 | 0.949 | 0.944 | 0.959 | 0.955 | 0.953 | 0.957 | 0.948 | 0.938 | 0.946 | |
| 50 | 0.949 | 0.960 | 0.953 | 0.954 | 0.957 | 0.940 | 0.943 | 0.964 | 0.953 | 0.943 | |
| 70 | 0.957 | 0.959 | 0.947 | 0.948 | 0.947 | 0.964 | 0.943 | 0.939 | 0.938 | 0.939 | |
| 100 | 0.953 | 0.941 | 0.963 | 0.933 | 0.956 | 0.945 | 0.948 | 0.956 | 0.958 | 0.949 | |
| 200 | 0.949 | 0.962 | 0.950 | 0.951 | 0.955 | 0.940 | 0.946 | 0.937 | 0.952 | 0.960 | |
| 400 | 0.951 | 0.950 | 0.945 | 0.942 | 0.932 | 0.957 | 0.957 | 0.962 | 0.944 | 0.937 | |
| 600 | 0.946 | 0.963 | 0.956 | 0.950 | 0.933 | 0.953 | 0.964 | 0.953 | 0.957 | 0.958 | |
| 800 | 0.948 | 0.962 | 0.950 | 0.945 | 0.944 | 0.929 | 0.923 | 0.951 | 0.945 | 0.953 | |
| SE-SD bias | 10 | 0.049 | 0.033 | 0.026 | 0.015 | 0.013 | 0.006 | 0.005 | 0.000 | 0.005 | 0.002 |
| 30 | 0.009 | -0.002 | 0.004 | 0.004 | 0.003 | 0.000 | 0.002 | -0.002 | -0.002 | 0.001 | |
| 50 | 0.006 | 0.006 | 0.004 | 0.002 | 0.002 | -0.003 | -0.001 | 0.003 | 0.002 | 0.000 | |
| 70 | 0.009 | 0.004 | 0.002 | 0.000 | 0.000 | 0.002 | 0.000 | -0.001 | -0.001 | 0.000 | |
| 100 | -0.002 | 0.000 | 0.001 | -0.002 | 0.001 | 0.000 | 0.000 | 0.001 | 0.000 | 0.000 | |
| 200 | 0.000 | 0.002 | 0.000 | 0.000 | 0.002 | -0.001 | 0.000 | -0.001 | 0.000 | 0.000 | |
| 400 | 0.001 | 0.001 | 0.000 | -0.002 | -0.002 | 0.001 | 0.001 | 0.000 | 0.000 | -0.001 | |
| 600 | -0.001 | 0.000 | 0.000 | 0.000 | -0.001 | 0.000 | 0.001 | 0.000 | 0.000 | 0.000 | |
| 800 | 0.001 | 0.001 | 0.000 | 0.000 | 0.000 | 0.000 | -0.001 | 0.000 | 0.000 | 0.000 | |
| criteria | I | J | |||||||||
|---|---|---|---|---|---|---|---|---|---|---|---|
| 10 | 20 | 30 | 50 | 70 | 100 | 150 | 200 | 250 | 300 | ||
| bias | 10 | 0.014 | -0.012 | 0.001 | 0.001 | -0.015 | -0.012 | -0.015 | -0.010 | -0.010 | -0.008 |
| 30 | -0.002 | 0.001 | -0.002 | -0.003 | 0.005 | -0.002 | -0.007 | 0.001 | 0.003 | -0.002 | |
| 50 | -0.005 | 0.000 | -0.003 | 0.000 | 0.001 | -0.003 | -0.005 | 0.001 | -0.002 | 0.000 | |
| 70 | 0.004 | -0.002 | -0.001 | -0.001 | 0.003 | 0.003 | -0.001 | 0.003 | -0.002 | 0.003 | |
| 100 | -0.005 | -0.001 | -0.006 | 0.001 | -0.002 | -0.003 | -0.001 | 0.000 | -0.001 | 0.001 | |
| 200 | -0.004 | -0.002 | 0.000 | 0.002 | 0.000 | 0.003 | -0.002 | -0.002 | 0.000 | 0.000 | |
| 400 | -0.003 | 0.000 | 0.001 | -0.001 | -0.001 | -0.002 | -0.001 | 0.000 | 0.001 | 0.000 | |
| 600 | -0.002 | -0.001 | -0.001 | -0.002 | 0.000 | 0.001 | 0.000 | 0.001 | 0.001 | 0.001 | |
| 800 | -0.001 | -0.001 | 0.000 | 0.000 | 0.000 | 0.000 | 0.001 | 0.000 | 0.000 | 0.001 | |
| rbias | 10 | 0.028 | 0.025 | 0.002 | 0.002 | 0.030 | 0.025 | 0.029 | 0.020 | 0.019 | 0.015 |
| 30 | 0.004 | 0.001 | 0.003 | 0.005 | 0.011 | 0.005 | 0.015 | 0.001 | 0.006 | 0.005 | |
| 50 | 0.010 | 0.000 | 0.005 | 0.000 | 0.003 | 0.005 | 0.011 | 0.003 | 0.003 | 0.001 | |
| 70 | 0.009 | 0.003 | 0.003 | 0.002 | 0.007 | 0.006 | 0.003 | 0.006 | 0.004 | 0.006 | |
| 100 | 0.010 | 0.003 | 0.011 | 0.003 | 0.005 | 0.006 | 0.002 | 0.001 | 0.001 | 0.001 | |
| 200 | 0.008 | 0.004 | 0.001 | 0.003 | 0.000 | 0.006 | 0.004 | 0.003 | 0.001 | 0.000 | |
| 400 | 0.006 | 0.001 | 0.002 | 0.003 | 0.001 | 0.004 | 0.001 | 0.001 | 0.001 | 0.000 | |
| 600 | 0.003 | 0.003 | 0.003 | 0.004 | 0.001 | 0.001 | 0.001 | 0.002 | 0.003 | 0.003 | |
| 800 | 0.003 | 0.002 | 0.000 | 0.000 | 0.000 | 0.000 | 0.003 | 0.001 | 0.000 | 0.002 | |
| RMSE | 10 | 0.426 | 0.337 | 0.300 | 0.253 | 0.240 | 0.229 | 0.215 | 0.215 | 0.206 | 0.204 |
| 30 | 0.262 | 0.193 | 0.169 | 0.149 | 0.141 | 0.132 | 0.123 | 0.118 | 0.118 | 0.117 | |
| 50 | 0.200 | 0.149 | 0.134 | 0.113 | 0.109 | 0.104 | 0.097 | 0.093 | 0.090 | 0.089 | |
| 70 | 0.165 | 0.127 | 0.112 | 0.099 | 0.092 | 0.084 | 0.080 | 0.079 | 0.078 | 0.078 | |
| 100 | 0.141 | 0.106 | 0.096 | 0.082 | 0.076 | 0.071 | 0.068 | 0.062 | 0.067 | 0.062 | |
| 200 | 0.097 | 0.076 | 0.067 | 0.058 | 0.052 | 0.051 | 0.048 | 0.046 | 0.044 | 0.044 | |
| 400 | 0.072 | 0.054 | 0.048 | 0.041 | 0.039 | 0.035 | 0.036 | 0.033 | 0.033 | 0.033 | |
| 600 | 0.056 | 0.043 | 0.038 | 0.033 | 0.033 | 0.028 | 0.027 | 0.026 | 0.026 | 0.026 | |
| 800 | 0.048 | 0.039 | 0.033 | 0.029 | 0.027 | 0.025 | 0.024 | 0.025 | 0.023 | 0.023 | |
| width | 10 | 1.818 | 1.353 | 1.187 | 1.007 | 0.939 | 0.880 | 0.836 | 0.816 | 0.798 | 0.789 |
| 30 | 1.020 | 0.771 | 0.667 | 0.585 | 0.548 | 0.512 | 0.485 | 0.474 | 0.465 | 0.458 | |
| 50 | 0.783 | 0.595 | 0.522 | 0.454 | 0.423 | 0.397 | 0.378 | 0.367 | 0.361 | 0.355 | |
| 70 | 0.660 | 0.503 | 0.442 | 0.386 | 0.358 | 0.338 | 0.319 | 0.310 | 0.305 | 0.301 | |
| 100 | 0.549 | 0.421 | 0.368 | 0.323 | 0.300 | 0.282 | 0.267 | 0.260 | 0.255 | 0.252 | |
| 200 | 0.388 | 0.299 | 0.262 | 0.228 | 0.212 | 0.200 | 0.189 | 0.184 | 0.181 | 0.178 | |
| 400 | 0.274 | 0.211 | 0.185 | 0.161 | 0.150 | 0.141 | 0.134 | 0.130 | 0.128 | 0.126 | |
| 600 | 0.224 | 0.172 | 0.152 | 0.132 | 0.123 | 0.115 | 0.109 | 0.106 | 0.104 | 0.103 | |
| 800 | 0.194 | 0.149 | 0.131 | 0.114 | 0.106 | 0.100 | 0.095 | 0.092 | 0.090 | 0.089 | |
| CP | 10 | 0.952 | 0.938 | 0.933 | 0.927 | 0.926 | 0.912 | 0.913 | 0.919 | 0.924 | 0.911 |
| 30 | 0.951 | 0.957 | 0.950 | 0.944 | 0.949 | 0.940 | 0.942 | 0.944 | 0.933 | 0.940 | |
| 50 | 0.945 | 0.936 | 0.948 | 0.959 | 0.952 | 0.933 | 0.939 | 0.940 | 0.953 | 0.945 | |
| 70 | 0.959 | 0.949 | 0.946 | 0.946 | 0.947 | 0.944 | 0.949 | 0.939 | 0.948 | 0.935 | |
| 100 | 0.945 | 0.953 | 0.935 | 0.940 | 0.950 | 0.944 | 0.943 | 0.963 | 0.944 | 0.957 | |
| 200 | 0.960 | 0.957 | 0.954 | 0.952 | 0.958 | 0.938 | 0.949 | 0.959 | 0.951 | 0.951 | |
| 400 | 0.946 | 0.952 | 0.942 | 0.945 | 0.949 | 0.949 | 0.940 | 0.962 | 0.950 | 0.941 | |
| 600 | 0.951 | 0.952 | 0.963 | 0.958 | 0.946 | 0.959 | 0.953 | 0.953 | 0.949 | 0.960 | |
| 800 | 0.954 | 0.940 | 0.950 | 0.951 | 0.948 | 0.948 | 0.944 | 0.933 | 0.949 | 0.947 | |
| SE-SD bias | 10 | 0.038 | 0.008 | 0.003 | 0.004 | 0.000 | -0.004 | -0.001 | -0.006 | -0.002 | -0.003 |
| 30 | -0.002 | 0.004 | 0.001 | 0.000 | -0.001 | -0.001 | 0.000 | 0.003 | 0.000 | -0.001 | |
| 50 | 0.000 | 0.003 | -0.001 | 0.003 | -0.001 | -0.003 | -0.001 | 0.001 | 0.002 | 0.001 | |
| 70 | 0.004 | 0.002 | 0.001 | -0.001 | -0.001 | 0.002 | 0.001 | 0.000 | 0.000 | -0.001 | |
| 100 | -0.001 | 0.001 | -0.002 | 0.000 | 0.000 | 0.001 | 0.000 | 0.004 | -0.002 | 0.002 | |
| 200 | 0.002 | 0.000 | 0.000 | 0.001 | 0.002 | 0.000 | 0.000 | 0.001 | 0.002 | 0.001 | |
| 400 | -0.002 | 0.000 | -0.001 | 0.000 | 0.000 | 0.001 | -0.002 | 0.000 | 0.000 | -0.001 | |
| 600 | 0.001 | 0.001 | 0.001 | 0.000 | -0.002 | 0.001 | 0.000 | 0.001 | 0.000 | 0.001 | |
| 800 | 0.001 | -0.001 | 0.000 | 0.000 | 0.000 | 0.000 | 0.000 | -0.001 | 0.000 | 0.000 | |
附表17 研究二平衡设计$\tau _{11}^{2}$中且${{W}_{i}}$为分类变量时线性混合效应模型水平2自变量调节效应量及其标准误估计准确性
| criteria | I | J | |||||||||
|---|---|---|---|---|---|---|---|---|---|---|---|
| 10 | 20 | 30 | 50 | 70 | 100 | 150 | 200 | 250 | 300 | ||
| bias | 10 | 0.014 | -0.012 | 0.001 | 0.001 | -0.015 | -0.012 | -0.015 | -0.010 | -0.010 | -0.008 |
| 30 | -0.002 | 0.001 | -0.002 | -0.003 | 0.005 | -0.002 | -0.007 | 0.001 | 0.003 | -0.002 | |
| 50 | -0.005 | 0.000 | -0.003 | 0.000 | 0.001 | -0.003 | -0.005 | 0.001 | -0.002 | 0.000 | |
| 70 | 0.004 | -0.002 | -0.001 | -0.001 | 0.003 | 0.003 | -0.001 | 0.003 | -0.002 | 0.003 | |
| 100 | -0.005 | -0.001 | -0.006 | 0.001 | -0.002 | -0.003 | -0.001 | 0.000 | -0.001 | 0.001 | |
| 200 | -0.004 | -0.002 | 0.000 | 0.002 | 0.000 | 0.003 | -0.002 | -0.002 | 0.000 | 0.000 | |
| 400 | -0.003 | 0.000 | 0.001 | -0.001 | -0.001 | -0.002 | -0.001 | 0.000 | 0.001 | 0.000 | |
| 600 | -0.002 | -0.001 | -0.001 | -0.002 | 0.000 | 0.001 | 0.000 | 0.001 | 0.001 | 0.001 | |
| 800 | -0.001 | -0.001 | 0.000 | 0.000 | 0.000 | 0.000 | 0.001 | 0.000 | 0.000 | 0.001 | |
| rbias | 10 | 0.028 | 0.025 | 0.002 | 0.002 | 0.030 | 0.025 | 0.029 | 0.020 | 0.019 | 0.015 |
| 30 | 0.004 | 0.001 | 0.003 | 0.005 | 0.011 | 0.005 | 0.015 | 0.001 | 0.006 | 0.005 | |
| 50 | 0.010 | 0.000 | 0.005 | 0.000 | 0.003 | 0.005 | 0.011 | 0.003 | 0.003 | 0.001 | |
| 70 | 0.009 | 0.003 | 0.003 | 0.002 | 0.007 | 0.006 | 0.003 | 0.006 | 0.004 | 0.006 | |
| 100 | 0.010 | 0.003 | 0.011 | 0.003 | 0.005 | 0.006 | 0.002 | 0.001 | 0.001 | 0.001 | |
| 200 | 0.008 | 0.004 | 0.001 | 0.003 | 0.000 | 0.006 | 0.004 | 0.003 | 0.001 | 0.000 | |
| 400 | 0.006 | 0.001 | 0.002 | 0.003 | 0.001 | 0.004 | 0.001 | 0.001 | 0.001 | 0.000 | |
| 600 | 0.003 | 0.003 | 0.003 | 0.004 | 0.001 | 0.001 | 0.001 | 0.002 | 0.003 | 0.003 | |
| 800 | 0.003 | 0.002 | 0.000 | 0.000 | 0.000 | 0.000 | 0.003 | 0.001 | 0.000 | 0.002 | |
| RMSE | 10 | 0.426 | 0.337 | 0.300 | 0.253 | 0.240 | 0.229 | 0.215 | 0.215 | 0.206 | 0.204 |
| 30 | 0.262 | 0.193 | 0.169 | 0.149 | 0.141 | 0.132 | 0.123 | 0.118 | 0.118 | 0.117 | |
| 50 | 0.200 | 0.149 | 0.134 | 0.113 | 0.109 | 0.104 | 0.097 | 0.093 | 0.090 | 0.089 | |
| 70 | 0.165 | 0.127 | 0.112 | 0.099 | 0.092 | 0.084 | 0.080 | 0.079 | 0.078 | 0.078 | |
| 100 | 0.141 | 0.106 | 0.096 | 0.082 | 0.076 | 0.071 | 0.068 | 0.062 | 0.067 | 0.062 | |
| 200 | 0.097 | 0.076 | 0.067 | 0.058 | 0.052 | 0.051 | 0.048 | 0.046 | 0.044 | 0.044 | |
| 400 | 0.072 | 0.054 | 0.048 | 0.041 | 0.039 | 0.035 | 0.036 | 0.033 | 0.033 | 0.033 | |
| 600 | 0.056 | 0.043 | 0.038 | 0.033 | 0.033 | 0.028 | 0.027 | 0.026 | 0.026 | 0.026 | |
| 800 | 0.048 | 0.039 | 0.033 | 0.029 | 0.027 | 0.025 | 0.024 | 0.025 | 0.023 | 0.023 | |
| width | 10 | 1.818 | 1.353 | 1.187 | 1.007 | 0.939 | 0.880 | 0.836 | 0.816 | 0.798 | 0.789 |
| 30 | 1.020 | 0.771 | 0.667 | 0.585 | 0.548 | 0.512 | 0.485 | 0.474 | 0.465 | 0.458 | |
| 50 | 0.783 | 0.595 | 0.522 | 0.454 | 0.423 | 0.397 | 0.378 | 0.367 | 0.361 | 0.355 | |
| 70 | 0.660 | 0.503 | 0.442 | 0.386 | 0.358 | 0.338 | 0.319 | 0.310 | 0.305 | 0.301 | |
| 100 | 0.549 | 0.421 | 0.368 | 0.323 | 0.300 | 0.282 | 0.267 | 0.260 | 0.255 | 0.252 | |
| 200 | 0.388 | 0.299 | 0.262 | 0.228 | 0.212 | 0.200 | 0.189 | 0.184 | 0.181 | 0.178 | |
| 400 | 0.274 | 0.211 | 0.185 | 0.161 | 0.150 | 0.141 | 0.134 | 0.130 | 0.128 | 0.126 | |
| 600 | 0.224 | 0.172 | 0.152 | 0.132 | 0.123 | 0.115 | 0.109 | 0.106 | 0.104 | 0.103 | |
| 800 | 0.194 | 0.149 | 0.131 | 0.114 | 0.106 | 0.100 | 0.095 | 0.092 | 0.090 | 0.089 | |
| CP | 10 | 0.952 | 0.938 | 0.933 | 0.927 | 0.926 | 0.912 | 0.913 | 0.919 | 0.924 | 0.911 |
| 30 | 0.951 | 0.957 | 0.950 | 0.944 | 0.949 | 0.940 | 0.942 | 0.944 | 0.933 | 0.940 | |
| 50 | 0.945 | 0.936 | 0.948 | 0.959 | 0.952 | 0.933 | 0.939 | 0.940 | 0.953 | 0.945 | |
| 70 | 0.959 | 0.949 | 0.946 | 0.946 | 0.947 | 0.944 | 0.949 | 0.939 | 0.948 | 0.935 | |
| 100 | 0.945 | 0.953 | 0.935 | 0.940 | 0.950 | 0.944 | 0.943 | 0.963 | 0.944 | 0.957 | |
| 200 | 0.960 | 0.957 | 0.954 | 0.952 | 0.958 | 0.938 | 0.949 | 0.959 | 0.951 | 0.951 | |
| 400 | 0.946 | 0.952 | 0.942 | 0.945 | 0.949 | 0.949 | 0.940 | 0.962 | 0.950 | 0.941 | |
| 600 | 0.951 | 0.952 | 0.963 | 0.958 | 0.946 | 0.959 | 0.953 | 0.953 | 0.949 | 0.960 | |
| 800 | 0.954 | 0.940 | 0.950 | 0.951 | 0.948 | 0.948 | 0.944 | 0.933 | 0.949 | 0.947 | |
| SE-SD bias | 10 | 0.038 | 0.008 | 0.003 | 0.004 | 0.000 | -0.004 | -0.001 | -0.006 | -0.002 | -0.003 |
| 30 | -0.002 | 0.004 | 0.001 | 0.000 | -0.001 | -0.001 | 0.000 | 0.003 | 0.000 | -0.001 | |
| 50 | 0.000 | 0.003 | -0.001 | 0.003 | -0.001 | -0.003 | -0.001 | 0.001 | 0.002 | 0.001 | |
| 70 | 0.004 | 0.002 | 0.001 | -0.001 | -0.001 | 0.002 | 0.001 | 0.000 | 0.000 | -0.001 | |
| 100 | -0.001 | 0.001 | -0.002 | 0.000 | 0.000 | 0.001 | 0.000 | 0.004 | -0.002 | 0.002 | |
| 200 | 0.002 | 0.000 | 0.000 | 0.001 | 0.002 | 0.000 | 0.000 | 0.001 | 0.002 | 0.001 | |
| 400 | -0.002 | 0.000 | -0.001 | 0.000 | 0.000 | 0.001 | -0.002 | 0.000 | 0.000 | -0.001 | |
| 600 | 0.001 | 0.001 | 0.001 | 0.000 | -0.002 | 0.001 | 0.000 | 0.001 | 0.000 | 0.001 | |
| 800 | 0.001 | -0.001 | 0.000 | 0.000 | 0.000 | 0.000 | 0.000 | -0.001 | 0.000 | 0.000 | |
| criteria | I | J | |||||||||
|---|---|---|---|---|---|---|---|---|---|---|---|
| 10 | 20 | 30 | 50 | 70 | 100 | 150 | 200 | 250 | 300 | ||
| bias | 10 | 0.031 | -0.006 | 0.001 | 0.000 | -0.003 | 0.013 | 0.003 | 0.000 | -0.004 | 0.001 |
| 30 | 0.001 | -0.004 | 0.000 | 0.003 | 0.000 | -0.001 | 0.002 | 0.001 | 0.001 | 0.002 | |
| 50 | 0.001 | 0.004 | -0.005 | 0.004 | -0.001 | 0.000 | 0.000 | -0.003 | 0.001 | 0.002 | |
| 70 | -0.001 | 0.002 | 0.002 | -0.001 | 0.000 | 0.001 | 0.000 | 0.000 | 0.000 | 0.001 | |
| 100 | 0.000 | 0.002 | -0.001 | 0.002 | 0.001 | 0.001 | 0.002 | 0.001 | 0.001 | 0.001 | |
| 200 | 0.002 | 0.002 | 0.000 | 0.001 | -0.001 | -0.002 | 0.000 | 0.000 | 0.000 | 0.001 | |
| 400 | 0.001 | 0.001 | 0.000 | 0.000 | 0.000 | 0.000 | -0.001 | 0.000 | 0.001 | 0.000 | |
| 600 | 0.001 | 0.000 | 0.000 | 0.000 | 0.000 | 0.002 | 0.000 | 0.000 | 0.000 | 0.000 | |
| 800 | 0.001 | 0.000 | -0.001 | 0.000 | 0.000 | 0.000 | 0.000 | 0.000 | 0.000 | 0.000 | |
| rbias | 10 | 0.061 | 0.012 | 0.002 | 0.001 | 0.007 | 0.026 | 0.005 | 0.001 | 0.009 | 0.003 |
| 30 | 0.003 | 0.008 | 0.000 | 0.006 | 0.000 | 0.002 | 0.005 | 0.003 | 0.002 | 0.003 | |
| 50 | 0.001 | 0.008 | 0.011 | 0.009 | 0.001 | 0.000 | 0.001 | 0.005 | 0.003 | 0.003 | |
| 70 | 0.002 | 0.003 | 0.004 | 0.003 | 0.000 | 0.003 | 0.001 | 0.000 | 0.001 | 0.002 | |
| 100 | 0.001 | 0.004 | 0.002 | 0.003 | 0.002 | 0.001 | 0.004 | 0.002 | 0.003 | 0.003 | |
| 200 | 0.004 | 0.005 | 0.000 | 0.001 | 0.002 | 0.003 | 0.001 | 0.001 | 0.000 | 0.001 | |
| 400 | 0.002 | 0.002 | 0.000 | 0.001 | 0.001 | 0.000 | 0.002 | 0.000 | 0.002 | 0.001 | |
| 600 | 0.002 | 0.000 | 0.000 | 0.001 | 0.001 | 0.003 | 0.001 | 0.001 | 0.001 | 0.001 | |
| 800 | 0.001 | 0.001 | 0.001 | 0.000 | 0.001 | 0.000 | 0.000 | 0.000 | 0.000 | 0.001 | |
| RMSE | 10 | 0.264 | 0.201 | 0.174 | 0.164 | 0.147 | 0.135 | 0.132 | 0.120 | 0.123 | 0.119 |
| 30 | 0.139 | 0.099 | 0.089 | 0.080 | 0.072 | 0.071 | 0.065 | 0.063 | 0.064 | 0.062 | |
| 50 | 0.104 | 0.079 | 0.069 | 0.059 | 0.057 | 0.052 | 0.050 | 0.050 | 0.047 | 0.047 | |
| 70 | 0.089 | 0.067 | 0.056 | 0.050 | 0.047 | 0.044 | 0.041 | 0.040 | 0.039 | 0.039 | |
| 100 | 0.071 | 0.054 | 0.049 | 0.043 | 0.040 | 0.037 | 0.034 | 0.035 | 0.032 | 0.032 | |
| 200 | 0.049 | 0.039 | 0.033 | 0.028 | 0.027 | 0.026 | 0.023 | 0.024 | 0.023 | 0.023 | |
| 400 | 0.036 | 0.026 | 0.024 | 0.020 | 0.020 | 0.018 | 0.018 | 0.017 | 0.017 | 0.016 | |
| 600 | 0.028 | 0.022 | 0.020 | 0.017 | 0.016 | 0.015 | 0.014 | 0.013 | 0.014 | 0.013 | |
| 800 | 0.025 | 0.019 | 0.016 | 0.014 | 0.014 | 0.013 | 0.013 | 0.012 | 0.012 | 0.012 | |
| width | 10 | 1.053 | 0.784 | 0.677 | 0.592 | 0.537 | 0.508 | 0.485 | 0.468 | 0.465 | 0.453 |
| 30 | 0.533 | 0.400 | 0.351 | 0.307 | 0.284 | 0.268 | 0.255 | 0.251 | 0.242 | 0.240 | |
| 50 | 0.401 | 0.306 | 0.266 | 0.234 | 0.217 | 0.203 | 0.194 | 0.189 | 0.184 | 0.182 | |
| 70 | 0.334 | 0.255 | 0.224 | 0.196 | 0.184 | 0.172 | 0.162 | 0.158 | 0.154 | 0.154 | |
| 100 | 0.278 | 0.213 | 0.188 | 0.164 | 0.151 | 0.143 | 0.136 | 0.132 | 0.129 | 0.127 | |
| 200 | 0.195 | 0.150 | 0.133 | 0.114 | 0.107 | 0.100 | 0.095 | 0.093 | 0.091 | 0.090 | |
| 400 | 0.138 | 0.106 | 0.093 | 0.081 | 0.075 | 0.071 | 0.067 | 0.065 | 0.064 | 0.063 | |
| 600 | 0.112 | 0.086 | 0.076 | 0.066 | 0.062 | 0.058 | 0.055 | 0.053 | 0.052 | 0.052 | |
| 800 | 0.097 | 0.075 | 0.066 | 0.057 | 0.053 | 0.050 | 0.047 | 0.046 | 0.045 | 0.045 | |
| CP | 10 | 0.949 | 0.940 | 0.942 | 0.930 | 0.927 | 0.911 | 0.916 | 0.929 | 0.932 | 0.921 |
| 30 | 0.936 | 0.949 | 0.947 | 0.951 | 0.939 | 0.932 | 0.938 | 0.939 | 0.938 | 0.937 | |
| 50 | 0.948 | 0.941 | 0.949 | 0.947 | 0.938 | 0.944 | 0.946 | 0.942 | 0.954 | 0.947 | |
| 70 | 0.934 | 0.936 | 0.946 | 0.951 | 0.945 | 0.947 | 0.943 | 0.947 | 0.949 | 0.949 | |
| 100 | 0.951 | 0.943 | 0.949 | 0.944 | 0.944 | 0.952 | 0.950 | 0.944 | 0.950 | 0.944 | |
| 200 | 0.945 | 0.950 | 0.964 | 0.959 | 0.950 | 0.947 | 0.958 | 0.952 | 0.957 | 0.948 | |
| 400 | 0.939 | 0.955 | 0.959 | 0.954 | 0.942 | 0.949 | 0.948 | 0.953 | 0.946 | 0.956 | |
| 600 | 0.958 | 0.946 | 0.937 | 0.947 | 0.948 | 0.932 | 0.958 | 0.947 | 0.939 | 0.945 | |
| 800 | 0.952 | 0.956 | 0.947 | 0.956 | 0.953 | 0.945 | 0.936 | 0.951 | 0.948 | 0.949 | |
| SE-SD bias | 10 | 0.007 | -0.001 | -0.001 | -0.013 | -0.010 | -0.005 | -0.008 | -0.001 | -0.004 | -0.004 |
| 30 | -0.003 | 0.003 | 0.000 | -0.001 | 0.001 | -0.003 | 0.000 | 0.001 | -0.002 | 0.000 | |
| 50 | -0.002 | -0.001 | -0.001 | 0.001 | -0.001 | 0.000 | -0.001 | -0.001 | 0.000 | -0.001 | |
| 70 | -0.004 | -0.002 | 0.001 | 0.000 | 0.000 | 0.000 | 0.001 | 0.000 | 0.000 | 0.001 | |
| 100 | 0.000 | 0.001 | -0.001 | -0.001 | -0.001 | 0.000 | 0.000 | -0.002 | 0.001 | 0.000 | |
| 200 | 0.000 | 0.000 | 0.001 | 0.001 | 0.000 | 0.000 | 0.001 | 0.000 | 0.001 | 0.000 | |
| 400 | -0.001 | 0.000 | 0.000 | 0.000 | 0.000 | 0.000 | 0.000 | 0.000 | 0.000 | 0.000 | |
| 600 | 0.001 | 0.000 | -0.001 | 0.000 | 0.000 | 0.000 | 0.000 | 0.000 | 0.000 | 0.000 | |
| 800 | 0.000 | 0.000 | 0.000 | 0.000 | 0.000 | 0.000 | -0.001 | 0.000 | 0.000 | 0.000 | |
附表18 研究二平衡设计$\tau _{11}^{2}$中且${{W}_{i}}$为连续变量时线性混合效应模型水平2自变量调节效应量及其标准误估计准确性
| criteria | I | J | |||||||||
|---|---|---|---|---|---|---|---|---|---|---|---|
| 10 | 20 | 30 | 50 | 70 | 100 | 150 | 200 | 250 | 300 | ||
| bias | 10 | 0.031 | -0.006 | 0.001 | 0.000 | -0.003 | 0.013 | 0.003 | 0.000 | -0.004 | 0.001 |
| 30 | 0.001 | -0.004 | 0.000 | 0.003 | 0.000 | -0.001 | 0.002 | 0.001 | 0.001 | 0.002 | |
| 50 | 0.001 | 0.004 | -0.005 | 0.004 | -0.001 | 0.000 | 0.000 | -0.003 | 0.001 | 0.002 | |
| 70 | -0.001 | 0.002 | 0.002 | -0.001 | 0.000 | 0.001 | 0.000 | 0.000 | 0.000 | 0.001 | |
| 100 | 0.000 | 0.002 | -0.001 | 0.002 | 0.001 | 0.001 | 0.002 | 0.001 | 0.001 | 0.001 | |
| 200 | 0.002 | 0.002 | 0.000 | 0.001 | -0.001 | -0.002 | 0.000 | 0.000 | 0.000 | 0.001 | |
| 400 | 0.001 | 0.001 | 0.000 | 0.000 | 0.000 | 0.000 | -0.001 | 0.000 | 0.001 | 0.000 | |
| 600 | 0.001 | 0.000 | 0.000 | 0.000 | 0.000 | 0.002 | 0.000 | 0.000 | 0.000 | 0.000 | |
| 800 | 0.001 | 0.000 | -0.001 | 0.000 | 0.000 | 0.000 | 0.000 | 0.000 | 0.000 | 0.000 | |
| rbias | 10 | 0.061 | 0.012 | 0.002 | 0.001 | 0.007 | 0.026 | 0.005 | 0.001 | 0.009 | 0.003 |
| 30 | 0.003 | 0.008 | 0.000 | 0.006 | 0.000 | 0.002 | 0.005 | 0.003 | 0.002 | 0.003 | |
| 50 | 0.001 | 0.008 | 0.011 | 0.009 | 0.001 | 0.000 | 0.001 | 0.005 | 0.003 | 0.003 | |
| 70 | 0.002 | 0.003 | 0.004 | 0.003 | 0.000 | 0.003 | 0.001 | 0.000 | 0.001 | 0.002 | |
| 100 | 0.001 | 0.004 | 0.002 | 0.003 | 0.002 | 0.001 | 0.004 | 0.002 | 0.003 | 0.003 | |
| 200 | 0.004 | 0.005 | 0.000 | 0.001 | 0.002 | 0.003 | 0.001 | 0.001 | 0.000 | 0.001 | |
| 400 | 0.002 | 0.002 | 0.000 | 0.001 | 0.001 | 0.000 | 0.002 | 0.000 | 0.002 | 0.001 | |
| 600 | 0.002 | 0.000 | 0.000 | 0.001 | 0.001 | 0.003 | 0.001 | 0.001 | 0.001 | 0.001 | |
| 800 | 0.001 | 0.001 | 0.001 | 0.000 | 0.001 | 0.000 | 0.000 | 0.000 | 0.000 | 0.001 | |
| RMSE | 10 | 0.264 | 0.201 | 0.174 | 0.164 | 0.147 | 0.135 | 0.132 | 0.120 | 0.123 | 0.119 |
| 30 | 0.139 | 0.099 | 0.089 | 0.080 | 0.072 | 0.071 | 0.065 | 0.063 | 0.064 | 0.062 | |
| 50 | 0.104 | 0.079 | 0.069 | 0.059 | 0.057 | 0.052 | 0.050 | 0.050 | 0.047 | 0.047 | |
| 70 | 0.089 | 0.067 | 0.056 | 0.050 | 0.047 | 0.044 | 0.041 | 0.040 | 0.039 | 0.039 | |
| 100 | 0.071 | 0.054 | 0.049 | 0.043 | 0.040 | 0.037 | 0.034 | 0.035 | 0.032 | 0.032 | |
| 200 | 0.049 | 0.039 | 0.033 | 0.028 | 0.027 | 0.026 | 0.023 | 0.024 | 0.023 | 0.023 | |
| 400 | 0.036 | 0.026 | 0.024 | 0.020 | 0.020 | 0.018 | 0.018 | 0.017 | 0.017 | 0.016 | |
| 600 | 0.028 | 0.022 | 0.020 | 0.017 | 0.016 | 0.015 | 0.014 | 0.013 | 0.014 | 0.013 | |
| 800 | 0.025 | 0.019 | 0.016 | 0.014 | 0.014 | 0.013 | 0.013 | 0.012 | 0.012 | 0.012 | |
| width | 10 | 1.053 | 0.784 | 0.677 | 0.592 | 0.537 | 0.508 | 0.485 | 0.468 | 0.465 | 0.453 |
| 30 | 0.533 | 0.400 | 0.351 | 0.307 | 0.284 | 0.268 | 0.255 | 0.251 | 0.242 | 0.240 | |
| 50 | 0.401 | 0.306 | 0.266 | 0.234 | 0.217 | 0.203 | 0.194 | 0.189 | 0.184 | 0.182 | |
| 70 | 0.334 | 0.255 | 0.224 | 0.196 | 0.184 | 0.172 | 0.162 | 0.158 | 0.154 | 0.154 | |
| 100 | 0.278 | 0.213 | 0.188 | 0.164 | 0.151 | 0.143 | 0.136 | 0.132 | 0.129 | 0.127 | |
| 200 | 0.195 | 0.150 | 0.133 | 0.114 | 0.107 | 0.100 | 0.095 | 0.093 | 0.091 | 0.090 | |
| 400 | 0.138 | 0.106 | 0.093 | 0.081 | 0.075 | 0.071 | 0.067 | 0.065 | 0.064 | 0.063 | |
| 600 | 0.112 | 0.086 | 0.076 | 0.066 | 0.062 | 0.058 | 0.055 | 0.053 | 0.052 | 0.052 | |
| 800 | 0.097 | 0.075 | 0.066 | 0.057 | 0.053 | 0.050 | 0.047 | 0.046 | 0.045 | 0.045 | |
| CP | 10 | 0.949 | 0.940 | 0.942 | 0.930 | 0.927 | 0.911 | 0.916 | 0.929 | 0.932 | 0.921 |
| 30 | 0.936 | 0.949 | 0.947 | 0.951 | 0.939 | 0.932 | 0.938 | 0.939 | 0.938 | 0.937 | |
| 50 | 0.948 | 0.941 | 0.949 | 0.947 | 0.938 | 0.944 | 0.946 | 0.942 | 0.954 | 0.947 | |
| 70 | 0.934 | 0.936 | 0.946 | 0.951 | 0.945 | 0.947 | 0.943 | 0.947 | 0.949 | 0.949 | |
| 100 | 0.951 | 0.943 | 0.949 | 0.944 | 0.944 | 0.952 | 0.950 | 0.944 | 0.950 | 0.944 | |
| 200 | 0.945 | 0.950 | 0.964 | 0.959 | 0.950 | 0.947 | 0.958 | 0.952 | 0.957 | 0.948 | |
| 400 | 0.939 | 0.955 | 0.959 | 0.954 | 0.942 | 0.949 | 0.948 | 0.953 | 0.946 | 0.956 | |
| 600 | 0.958 | 0.946 | 0.937 | 0.947 | 0.948 | 0.932 | 0.958 | 0.947 | 0.939 | 0.945 | |
| 800 | 0.952 | 0.956 | 0.947 | 0.956 | 0.953 | 0.945 | 0.936 | 0.951 | 0.948 | 0.949 | |
| SE-SD bias | 10 | 0.007 | -0.001 | -0.001 | -0.013 | -0.010 | -0.005 | -0.008 | -0.001 | -0.004 | -0.004 |
| 30 | -0.003 | 0.003 | 0.000 | -0.001 | 0.001 | -0.003 | 0.000 | 0.001 | -0.002 | 0.000 | |
| 50 | -0.002 | -0.001 | -0.001 | 0.001 | -0.001 | 0.000 | -0.001 | -0.001 | 0.000 | -0.001 | |
| 70 | -0.004 | -0.002 | 0.001 | 0.000 | 0.000 | 0.000 | 0.001 | 0.000 | 0.000 | 0.001 | |
| 100 | 0.000 | 0.001 | -0.001 | -0.001 | -0.001 | 0.000 | 0.000 | -0.002 | 0.001 | 0.000 | |
| 200 | 0.000 | 0.000 | 0.001 | 0.001 | 0.000 | 0.000 | 0.001 | 0.000 | 0.001 | 0.000 | |
| 400 | -0.001 | 0.000 | 0.000 | 0.000 | 0.000 | 0.000 | 0.000 | 0.000 | 0.000 | 0.000 | |
| 600 | 0.001 | 0.000 | -0.001 | 0.000 | 0.000 | 0.000 | 0.000 | 0.000 | 0.000 | 0.000 | |
| 800 | 0.000 | 0.000 | 0.000 | 0.000 | 0.000 | 0.000 | -0.001 | 0.000 | 0.000 | 0.000 | |
| criteria | I | J | |||||||||
|---|---|---|---|---|---|---|---|---|---|---|---|
| 10 | 20 | 30 | 50 | 70 | 100 | 150 | 200 | 250 | 300 | ||
| bias | 10 | -0.003 | 0.010 | -0.008 | -0.019 | -0.018 | -0.037 | -0.025 | -0.020 | -0.017 | -0.012 |
| 30 | -0.016 | 0.002 | -0.012 | -0.002 | 0.006 | -0.013 | 0.000 | 0.006 | -0.003 | -0.007 | |
| 50 | -0.001 | 0.001 | -0.005 | -0.005 | 0.007 | 0.001 | 0.008 | 0.003 | -0.001 | 0.000 | |
| 70 | 0.002 | 0.003 | -0.008 | 0.003 | 0.004 | -0.004 | 0.000 | -0.003 | 0.001 | -0.006 | |
| 100 | 0.001 | -0.007 | 0.001 | 0.000 | 0.002 | 0.001 | -0.001 | -0.001 | -0.005 | 0.000 | |
| 200 | -0.002 | -0.004 | -0.001 | -0.002 | 0.000 | -0.002 | 0.002 | -0.001 | -0.002 | 0.000 | |
| 400 | 0.003 | 0.000 | 0.001 | 0.002 | 0.000 | 0.003 | 0.001 | -0.001 | 0.001 | 0.001 | |
| 600 | 0.001 | 0.002 | 0.000 | -0.001 | -0.001 | 0.001 | -0.001 | 0.000 | -0.001 | 0.000 | |
| 800 | -0.001 | -0.002 | 0.000 | 0.000 | -0.001 | 0.002 | -0.001 | 0.001 | 0.001 | -0.001 | |
| rbias | 10 | 0.006 | 0.020 | 0.016 | 0.039 | 0.035 | 0.074 | 0.051 | 0.040 | 0.035 | 0.024 |
| 30 | 0.032 | 0.003 | 0.023 | 0.005 | 0.012 | 0.025 | 0.001 | 0.012 | 0.006 | 0.014 | |
| 50 | 0.002 | 0.003 | 0.010 | 0.009 | 0.014 | 0.001 | 0.015 | 0.005 | 0.001 | 0.000 | |
| 70 | 0.004 | 0.005 | 0.017 | 0.006 | 0.007 | 0.009 | 0.001 | 0.005 | 0.002 | 0.012 | |
| 100 | 0.002 | 0.014 | 0.001 | 0.000 | 0.003 | 0.002 | 0.003 | 0.002 | 0.009 | 0.001 | |
| 200 | 0.005 | 0.007 | 0.002 | 0.004 | 0.000 | 0.004 | 0.003 | 0.001 | 0.004 | 0.000 | |
| 400 | 0.006 | 0.000 | 0.002 | 0.004 | 0.001 | 0.005 | 0.002 | 0.003 | 0.001 | 0.002 | |
| 600 | 0.002 | 0.004 | 0.000 | 0.001 | 0.002 | 0.003 | 0.002 | 0.000 | 0.002 | 0.001 | |
| 800 | 0.002 | 0.004 | 0.001 | 0.001 | 0.002 | 0.003 | 0.002 | 0.002 | 0.001 | 0.002 | |
| RMSE | 10 | 0.557 | 0.430 | 0.369 | 0.312 | 0.295 | 0.278 | 0.272 | 0.262 | 0.258 | 0.264 |
| 30 | 0.329 | 0.244 | 0.217 | 0.185 | 0.178 | 0.164 | 0.153 | 0.148 | 0.149 | 0.148 | |
| 50 | 0.252 | 0.194 | 0.168 | 0.148 | 0.136 | 0.127 | 0.123 | 0.116 | 0.114 | 0.117 | |
| 70 | 0.211 | 0.164 | 0.147 | 0.123 | 0.112 | 0.107 | 0.106 | 0.099 | 0.099 | 0.093 | |
| 100 | 0.174 | 0.135 | 0.114 | 0.103 | 0.098 | 0.087 | 0.087 | 0.083 | 0.082 | 0.078 | |
| 200 | 0.122 | 0.093 | 0.083 | 0.076 | 0.068 | 0.065 | 0.062 | 0.060 | 0.056 | 0.055 | |
| 400 | 0.086 | 0.066 | 0.058 | 0.050 | 0.049 | 0.044 | 0.042 | 0.041 | 0.040 | 0.039 | |
| 600 | 0.071 | 0.055 | 0.050 | 0.040 | 0.040 | 0.037 | 0.034 | 0.034 | 0.034 | 0.032 | |
| 800 | 0.061 | 0.048 | 0.041 | 0.038 | 0.033 | 0.033 | 0.030 | 0.028 | 0.029 | 0.029 | |
| width | 10 | 2.267 | 1.680 | 1.477 | 1.251 | 1.177 | 1.098 | 1.047 | 1.017 | 0.999 | 0.981 |
| 30 | 1.259 | 0.960 | 0.836 | 0.738 | 0.682 | 0.643 | 0.610 | 0.592 | 0.582 | 0.574 | |
| 50 | 0.977 | 0.744 | 0.654 | 0.568 | 0.529 | 0.497 | 0.472 | 0.460 | 0.450 | 0.443 | |
| 70 | 0.824 | 0.627 | 0.555 | 0.483 | 0.447 | 0.421 | 0.400 | 0.388 | 0.380 | 0.376 | |
| 100 | 0.686 | 0.528 | 0.464 | 0.404 | 0.376 | 0.352 | 0.334 | 0.324 | 0.319 | 0.315 | |
| 200 | 0.485 | 0.372 | 0.328 | 0.286 | 0.265 | 0.249 | 0.237 | 0.230 | 0.226 | 0.223 | |
| 400 | 0.343 | 0.263 | 0.231 | 0.202 | 0.188 | 0.177 | 0.167 | 0.162 | 0.159 | 0.158 | |
| 600 | 0.280 | 0.216 | 0.189 | 0.165 | 0.153 | 0.144 | 0.137 | 0.133 | 0.130 | 0.129 | |
| 800 | 0.243 | 0.186 | 0.164 | 0.143 | 0.133 | 0.125 | 0.118 | 0.115 | 0.113 | 0.111 | |
| CP | 10 | 0.948 | 0.933 | 0.931 | 0.933 | 0.927 | 0.919 | 0.915 | 0.918 | 0.913 | 0.902 |
| 30 | 0.941 | 0.945 | 0.937 | 0.950 | 0.939 | 0.936 | 0.940 | 0.948 | 0.938 | 0.928 | |
| 50 | 0.939 | 0.944 | 0.949 | 0.941 | 0.942 | 0.946 | 0.945 | 0.940 | 0.943 | 0.936 | |
| 70 | 0.943 | 0.942 | 0.940 | 0.949 | 0.955 | 0.943 | 0.936 | 0.951 | 0.942 | 0.951 | |
| 100 | 0.960 | 0.948 | 0.953 | 0.946 | 0.945 | 0.959 | 0.947 | 0.950 | 0.951 | 0.957 | |
| 200 | 0.955 | 0.957 | 0.957 | 0.944 | 0.948 | 0.945 | 0.947 | 0.937 | 0.951 | 0.954 | |
| 400 | 0.954 | 0.948 | 0.953 | 0.951 | 0.951 | 0.948 | 0.955 | 0.966 | 0.952 | 0.959 | |
| 600 | 0.950 | 0.952 | 0.943 | 0.955 | 0.947 | 0.941 | 0.957 | 0.942 | 0.948 | 0.956 | |
| 800 | 0.948 | 0.941 | 0.958 | 0.948 | 0.954 | 0.942 | 0.953 | 0.956 | 0.951 | 0.952 | |
| SE-SD bias | 10 | 0.021 | -0.002 | 0.008 | 0.008 | 0.005 | 0.004 | -0.004 | -0.002 | -0.003 | -0.013 |
| 30 | -0.008 | 0.001 | -0.004 | 0.003 | -0.004 | 0.000 | 0.003 | 0.003 | -0.001 | -0.001 | |
| 50 | -0.003 | -0.004 | -0.001 | -0.003 | -0.001 | -0.001 | -0.003 | 0.001 | 0.000 | -0.004 | |
| 70 | -0.001 | -0.004 | -0.006 | 0.000 | 0.003 | 0.000 | -0.004 | 0.000 | -0.002 | 0.003 | |
| 100 | 0.001 | 0.000 | 0.005 | 0.000 | -0.002 | 0.003 | -0.002 | 0.000 | -0.001 | 0.003 | |
| 200 | 0.002 | 0.002 | 0.001 | -0.003 | -0.001 | -0.002 | -0.002 | -0.002 | 0.002 | 0.002 | |
| 400 | 0.002 | 0.001 | 0.001 | 0.001 | -0.001 | 0.001 | 0.000 | 0.000 | 0.000 | 0.001 | |
| 600 | 0.000 | 0.000 | -0.002 | 0.002 | -0.001 | 0.000 | 0.001 | 0.000 | -0.001 | 0.001 | |
| 800 | 0.001 | -0.001 | 0.001 | -0.001 | 0.000 | -0.001 | 0.000 | 0.001 | 0.000 | 0.000 | |
附表19 研究二非平衡设计$\tau _{11}^{2}$中且${{W}_{i}}$为分类变量时线性混合效应模型水平2自变量调节效应量及其标准误估计准确性
| criteria | I | J | |||||||||
|---|---|---|---|---|---|---|---|---|---|---|---|
| 10 | 20 | 30 | 50 | 70 | 100 | 150 | 200 | 250 | 300 | ||
| bias | 10 | -0.003 | 0.010 | -0.008 | -0.019 | -0.018 | -0.037 | -0.025 | -0.020 | -0.017 | -0.012 |
| 30 | -0.016 | 0.002 | -0.012 | -0.002 | 0.006 | -0.013 | 0.000 | 0.006 | -0.003 | -0.007 | |
| 50 | -0.001 | 0.001 | -0.005 | -0.005 | 0.007 | 0.001 | 0.008 | 0.003 | -0.001 | 0.000 | |
| 70 | 0.002 | 0.003 | -0.008 | 0.003 | 0.004 | -0.004 | 0.000 | -0.003 | 0.001 | -0.006 | |
| 100 | 0.001 | -0.007 | 0.001 | 0.000 | 0.002 | 0.001 | -0.001 | -0.001 | -0.005 | 0.000 | |
| 200 | -0.002 | -0.004 | -0.001 | -0.002 | 0.000 | -0.002 | 0.002 | -0.001 | -0.002 | 0.000 | |
| 400 | 0.003 | 0.000 | 0.001 | 0.002 | 0.000 | 0.003 | 0.001 | -0.001 | 0.001 | 0.001 | |
| 600 | 0.001 | 0.002 | 0.000 | -0.001 | -0.001 | 0.001 | -0.001 | 0.000 | -0.001 | 0.000 | |
| 800 | -0.001 | -0.002 | 0.000 | 0.000 | -0.001 | 0.002 | -0.001 | 0.001 | 0.001 | -0.001 | |
| rbias | 10 | 0.006 | 0.020 | 0.016 | 0.039 | 0.035 | 0.074 | 0.051 | 0.040 | 0.035 | 0.024 |
| 30 | 0.032 | 0.003 | 0.023 | 0.005 | 0.012 | 0.025 | 0.001 | 0.012 | 0.006 | 0.014 | |
| 50 | 0.002 | 0.003 | 0.010 | 0.009 | 0.014 | 0.001 | 0.015 | 0.005 | 0.001 | 0.000 | |
| 70 | 0.004 | 0.005 | 0.017 | 0.006 | 0.007 | 0.009 | 0.001 | 0.005 | 0.002 | 0.012 | |
| 100 | 0.002 | 0.014 | 0.001 | 0.000 | 0.003 | 0.002 | 0.003 | 0.002 | 0.009 | 0.001 | |
| 200 | 0.005 | 0.007 | 0.002 | 0.004 | 0.000 | 0.004 | 0.003 | 0.001 | 0.004 | 0.000 | |
| 400 | 0.006 | 0.000 | 0.002 | 0.004 | 0.001 | 0.005 | 0.002 | 0.003 | 0.001 | 0.002 | |
| 600 | 0.002 | 0.004 | 0.000 | 0.001 | 0.002 | 0.003 | 0.002 | 0.000 | 0.002 | 0.001 | |
| 800 | 0.002 | 0.004 | 0.001 | 0.001 | 0.002 | 0.003 | 0.002 | 0.002 | 0.001 | 0.002 | |
| RMSE | 10 | 0.557 | 0.430 | 0.369 | 0.312 | 0.295 | 0.278 | 0.272 | 0.262 | 0.258 | 0.264 |
| 30 | 0.329 | 0.244 | 0.217 | 0.185 | 0.178 | 0.164 | 0.153 | 0.148 | 0.149 | 0.148 | |
| 50 | 0.252 | 0.194 | 0.168 | 0.148 | 0.136 | 0.127 | 0.123 | 0.116 | 0.114 | 0.117 | |
| 70 | 0.211 | 0.164 | 0.147 | 0.123 | 0.112 | 0.107 | 0.106 | 0.099 | 0.099 | 0.093 | |
| 100 | 0.174 | 0.135 | 0.114 | 0.103 | 0.098 | 0.087 | 0.087 | 0.083 | 0.082 | 0.078 | |
| 200 | 0.122 | 0.093 | 0.083 | 0.076 | 0.068 | 0.065 | 0.062 | 0.060 | 0.056 | 0.055 | |
| 400 | 0.086 | 0.066 | 0.058 | 0.050 | 0.049 | 0.044 | 0.042 | 0.041 | 0.040 | 0.039 | |
| 600 | 0.071 | 0.055 | 0.050 | 0.040 | 0.040 | 0.037 | 0.034 | 0.034 | 0.034 | 0.032 | |
| 800 | 0.061 | 0.048 | 0.041 | 0.038 | 0.033 | 0.033 | 0.030 | 0.028 | 0.029 | 0.029 | |
| width | 10 | 2.267 | 1.680 | 1.477 | 1.251 | 1.177 | 1.098 | 1.047 | 1.017 | 0.999 | 0.981 |
| 30 | 1.259 | 0.960 | 0.836 | 0.738 | 0.682 | 0.643 | 0.610 | 0.592 | 0.582 | 0.574 | |
| 50 | 0.977 | 0.744 | 0.654 | 0.568 | 0.529 | 0.497 | 0.472 | 0.460 | 0.450 | 0.443 | |
| 70 | 0.824 | 0.627 | 0.555 | 0.483 | 0.447 | 0.421 | 0.400 | 0.388 | 0.380 | 0.376 | |
| 100 | 0.686 | 0.528 | 0.464 | 0.404 | 0.376 | 0.352 | 0.334 | 0.324 | 0.319 | 0.315 | |
| 200 | 0.485 | 0.372 | 0.328 | 0.286 | 0.265 | 0.249 | 0.237 | 0.230 | 0.226 | 0.223 | |
| 400 | 0.343 | 0.263 | 0.231 | 0.202 | 0.188 | 0.177 | 0.167 | 0.162 | 0.159 | 0.158 | |
| 600 | 0.280 | 0.216 | 0.189 | 0.165 | 0.153 | 0.144 | 0.137 | 0.133 | 0.130 | 0.129 | |
| 800 | 0.243 | 0.186 | 0.164 | 0.143 | 0.133 | 0.125 | 0.118 | 0.115 | 0.113 | 0.111 | |
| CP | 10 | 0.948 | 0.933 | 0.931 | 0.933 | 0.927 | 0.919 | 0.915 | 0.918 | 0.913 | 0.902 |
| 30 | 0.941 | 0.945 | 0.937 | 0.950 | 0.939 | 0.936 | 0.940 | 0.948 | 0.938 | 0.928 | |
| 50 | 0.939 | 0.944 | 0.949 | 0.941 | 0.942 | 0.946 | 0.945 | 0.940 | 0.943 | 0.936 | |
| 70 | 0.943 | 0.942 | 0.940 | 0.949 | 0.955 | 0.943 | 0.936 | 0.951 | 0.942 | 0.951 | |
| 100 | 0.960 | 0.948 | 0.953 | 0.946 | 0.945 | 0.959 | 0.947 | 0.950 | 0.951 | 0.957 | |
| 200 | 0.955 | 0.957 | 0.957 | 0.944 | 0.948 | 0.945 | 0.947 | 0.937 | 0.951 | 0.954 | |
| 400 | 0.954 | 0.948 | 0.953 | 0.951 | 0.951 | 0.948 | 0.955 | 0.966 | 0.952 | 0.959 | |
| 600 | 0.950 | 0.952 | 0.943 | 0.955 | 0.947 | 0.941 | 0.957 | 0.942 | 0.948 | 0.956 | |
| 800 | 0.948 | 0.941 | 0.958 | 0.948 | 0.954 | 0.942 | 0.953 | 0.956 | 0.951 | 0.952 | |
| SE-SD bias | 10 | 0.021 | -0.002 | 0.008 | 0.008 | 0.005 | 0.004 | -0.004 | -0.002 | -0.003 | -0.013 |
| 30 | -0.008 | 0.001 | -0.004 | 0.003 | -0.004 | 0.000 | 0.003 | 0.003 | -0.001 | -0.001 | |
| 50 | -0.003 | -0.004 | -0.001 | -0.003 | -0.001 | -0.001 | -0.003 | 0.001 | 0.000 | -0.004 | |
| 70 | -0.001 | -0.004 | -0.006 | 0.000 | 0.003 | 0.000 | -0.004 | 0.000 | -0.002 | 0.003 | |
| 100 | 0.001 | 0.000 | 0.005 | 0.000 | -0.002 | 0.003 | -0.002 | 0.000 | -0.001 | 0.003 | |
| 200 | 0.002 | 0.002 | 0.001 | -0.003 | -0.001 | -0.002 | -0.002 | -0.002 | 0.002 | 0.002 | |
| 400 | 0.002 | 0.001 | 0.001 | 0.001 | -0.001 | 0.001 | 0.000 | 0.000 | 0.000 | 0.001 | |
| 600 | 0.000 | 0.000 | -0.002 | 0.002 | -0.001 | 0.000 | 0.001 | 0.000 | -0.001 | 0.001 | |
| 800 | 0.001 | -0.001 | 0.001 | -0.001 | 0.000 | -0.001 | 0.000 | 0.001 | 0.000 | 0.000 | |
| criteria | I | J | |||||||||
|---|---|---|---|---|---|---|---|---|---|---|---|
| 10 | 20 | 30 | 50 | 70 | 100 | 150 | 200 | 250 | 300 | ||
| bias | 10 | -0.009 | -0.044 | -0.033 | -0.009 | -0.007 | -0.028 | -0.015 | -0.016 | -0.034 | -0.014 |
| 30 | -0.015 | -0.011 | -0.013 | 0.003 | -0.015 | -0.010 | -0.010 | -0.004 | -0.013 | 0.003 | |
| 50 | 0.005 | -0.001 | -0.002 | 0.005 | 0.001 | 0.006 | 0.003 | -0.002 | -0.005 | 0.005 | |
| 70 | -0.002 | -0.003 | -0.002 | -0.002 | 0.001 | 0.001 | -0.008 | -0.007 | -0.005 | 0.001 | |
| 100 | 0.001 | -0.004 | -0.002 | -0.005 | 0.003 | -0.008 | 0.001 | -0.002 | -0.009 | 0.001 | |
| 200 | 0.003 | 0.000 | -0.008 | 0.000 | 0.000 | 0.002 | -0.001 | 0.003 | 0.000 | -0.001 | |
| 400 | 0.001 | 0.001 | 0.001 | -0.002 | 0.001 | -0.002 | -0.005 | -0.001 | -0.002 | 0.000 | |
| 600 | -0.001 | 0.000 | 0.000 | 0.001 | -0.001 | -0.001 | 0.000 | -0.001 | 0.000 | 0.000 | |
| 800 | 0.001 | 0.000 | 0.003 | 0.001 | 0.000 | -0.001 | 0.004 | -0.001 | -0.001 | 0.000 | |
| rbias | 10 | 0.018 | 0.088 | 0.066 | 0.019 | 0.013 | 0.057 | 0.031 | 0.033 | 0.068 | 0.029 |
| 30 | 0.029 | 0.021 | 0.026 | 0.007 | 0.030 | 0.020 | 0.021 | 0.007 | 0.025 | 0.006 | |
| 50 | 0.010 | 0.003 | 0.003 | 0.010 | 0.001 | 0.012 | 0.006 | 0.005 | 0.011 | 0.010 | |
| 70 | 0.004 | 0.006 | 0.003 | 0.004 | 0.001 | 0.002 | 0.016 | 0.014 | 0.010 | 0.002 | |
| 100 | 0.002 | 0.007 | 0.004 | 0.010 | 0.006 | 0.015 | 0.002 | 0.004 | 0.018 | 0.002 | |
| 200 | 0.005 | 0.000 | 0.016 | 0.000 | 0.000 | 0.004 | 0.001 | 0.007 | 0.000 | 0.002 | |
| 400 | 0.001 | 0.001 | 0.001 | 0.005 | 0.001 | 0.003 | 0.010 | 0.002 | 0.003 | 0.000 | |
| 600 | 0.003 | 0.000 | 0.001 | 0.002 | 0.002 | 0.003 | 0.000 | 0.002 | 0.000 | 0.001 | |
| 800 | 0.003 | 0.000 | 0.005 | 0.001 | 0.000 | 0.003 | 0.007 | 0.002 | 0.003 | 0.000 | |
| RMSE | 10 | 0.493 | 0.432 | 0.393 | 0.366 | 0.356 | 0.334 | 0.334 | 0.329 | 0.323 | 0.332 |
| 30 | 0.291 | 0.239 | 0.225 | 0.209 | 0.203 | 0.201 | 0.191 | 0.179 | 0.186 | 0.181 | |
| 50 | 0.226 | 0.190 | 0.171 | 0.165 | 0.156 | 0.150 | 0.152 | 0.146 | 0.149 | 0.142 | |
| 70 | 0.199 | 0.159 | 0.149 | 0.135 | 0.131 | 0.131 | 0.127 | 0.124 | 0.126 | 0.122 | |
| 100 | 0.163 | 0.134 | 0.121 | 0.109 | 0.108 | 0.109 | 0.102 | 0.103 | 0.104 | 0.104 | |
| 200 | 0.113 | 0.094 | 0.090 | 0.082 | 0.077 | 0.073 | 0.074 | 0.074 | 0.075 | 0.071 | |
| 400 | 0.080 | 0.066 | 0.062 | 0.057 | 0.059 | 0.055 | 0.052 | 0.053 | 0.051 | 0.049 | |
| 600 | 0.063 | 0.056 | 0.053 | 0.046 | 0.044 | 0.042 | 0.043 | 0.043 | 0.043 | 0.041 | |
| 800 | 0.058 | 0.047 | 0.044 | 0.039 | 0.039 | 0.038 | 0.037 | 0.036 | 0.036 | 0.036 | |
| width | 10 | 2.025 | 1.661 | 1.494 | 1.400 | 1.354 | 1.323 | 1.286 | 1.279 | 1.270 | 1.260 |
| 30 | 1.152 | 0.951 | 0.884 | 0.819 | 0.787 | 0.767 | 0.750 | 0.744 | 0.738 | 0.736 | |
| 50 | 0.890 | 0.747 | 0.683 | 0.634 | 0.615 | 0.596 | 0.583 | 0.576 | 0.571 | 0.569 | |
| 70 | 0.754 | 0.629 | 0.579 | 0.538 | 0.519 | 0.504 | 0.492 | 0.486 | 0.483 | 0.481 | |
| 100 | 0.635 | 0.526 | 0.484 | 0.449 | 0.434 | 0.422 | 0.413 | 0.407 | 0.404 | 0.402 | |
| 200 | 0.446 | 0.371 | 0.343 | 0.318 | 0.307 | 0.298 | 0.292 | 0.288 | 0.286 | 0.284 | |
| 400 | 0.316 | 0.263 | 0.243 | 0.225 | 0.217 | 0.211 | 0.206 | 0.204 | 0.202 | 0.201 | |
| 600 | 0.258 | 0.215 | 0.198 | 0.184 | 0.177 | 0.172 | 0.168 | 0.166 | 0.165 | 0.164 | |
| 800 | 0.224 | 0.186 | 0.172 | 0.159 | 0.154 | 0.149 | 0.146 | 0.144 | 0.143 | 0.142 | |
| CP | 10 | 0.940 | 0.920 | 0.927 | 0.913 | 0.912 | 0.917 | 0.911 | 0.925 | 0.908 | 0.908 |
| 30 | 0.931 | 0.948 | 0.946 | 0.940 | 0.939 | 0.933 | 0.941 | 0.959 | 0.940 | 0.949 | |
| 50 | 0.935 | 0.952 | 0.948 | 0.940 | 0.952 | 0.946 | 0.940 | 0.935 | 0.937 | 0.955 | |
| 70 | 0.940 | 0.949 | 0.945 | 0.952 | 0.948 | 0.940 | 0.945 | 0.953 | 0.945 | 0.948 | |
| 100 | 0.949 | 0.950 | 0.955 | 0.948 | 0.958 | 0.942 | 0.961 | 0.959 | 0.943 | 0.940 | |
| 200 | 0.947 | 0.952 | 0.937 | 0.946 | 0.953 | 0.958 | 0.949 | 0.960 | 0.933 | 0.952 | |
| 400 | 0.955 | 0.950 | 0.944 | 0.944 | 0.945 | 0.941 | 0.946 | 0.942 | 0.954 | 0.954 | |
| 600 | 0.961 | 0.939 | 0.933 | 0.958 | 0.955 | 0.951 | 0.953 | 0.944 | 0.943 | 0.943 | |
| 800 | 0.944 | 0.957 | 0.953 | 0.960 | 0.956 | 0.953 | 0.954 | 0.961 | 0.959 | 0.952 | |
| SE-SD bias | 10 | 0.023 | -0.006 | -0.011 | -0.009 | -0.011 | 0.004 | -0.006 | -0.002 | 0.002 | -0.010 |
| 30 | 0.003 | 0.004 | 0.001 | 0.000 | -0.002 | -0.006 | 0.001 | 0.010 | 0.003 | 0.006 | |
| 50 | 0.001 | 0.000 | 0.003 | -0.003 | 0.001 | 0.002 | -0.004 | 0.001 | -0.003 | 0.003 | |
| 70 | -0.007 | 0.002 | -0.002 | 0.002 | 0.001 | -0.002 | -0.001 | 0.001 | -0.003 | 0.001 | |
| 100 | -0.001 | 0.000 | 0.003 | 0.006 | 0.003 | -0.001 | 0.003 | 0.001 | -0.001 | -0.002 | |
| 200 | 0.001 | 0.000 | -0.003 | -0.001 | 0.002 | 0.003 | 0.001 | -0.001 | -0.002 | 0.001 | |
| 400 | 0.000 | 0.001 | 0.000 | 0.000 | -0.003 | -0.002 | 0.001 | -0.001 | 0.000 | 0.002 | |
| 600 | 0.003 | -0.001 | -0.002 | 0.001 | 0.001 | 0.001 | 0.000 | -0.001 | -0.001 | 0.000 | |
| 800 | -0.001 | 0.000 | 0.000 | 0.002 | 0.001 | 0.000 | 0.000 | 0.001 | 0.000 | 0.000 | |
附表20 研究二平衡设计$\tau _{11}^{2}$大且${{W}_{i}}$为分类变量时线性混合效应模型水平2自变量调节效应量及其标准误估计准确性
| criteria | I | J | |||||||||
|---|---|---|---|---|---|---|---|---|---|---|---|
| 10 | 20 | 30 | 50 | 70 | 100 | 150 | 200 | 250 | 300 | ||
| bias | 10 | -0.009 | -0.044 | -0.033 | -0.009 | -0.007 | -0.028 | -0.015 | -0.016 | -0.034 | -0.014 |
| 30 | -0.015 | -0.011 | -0.013 | 0.003 | -0.015 | -0.010 | -0.010 | -0.004 | -0.013 | 0.003 | |
| 50 | 0.005 | -0.001 | -0.002 | 0.005 | 0.001 | 0.006 | 0.003 | -0.002 | -0.005 | 0.005 | |
| 70 | -0.002 | -0.003 | -0.002 | -0.002 | 0.001 | 0.001 | -0.008 | -0.007 | -0.005 | 0.001 | |
| 100 | 0.001 | -0.004 | -0.002 | -0.005 | 0.003 | -0.008 | 0.001 | -0.002 | -0.009 | 0.001 | |
| 200 | 0.003 | 0.000 | -0.008 | 0.000 | 0.000 | 0.002 | -0.001 | 0.003 | 0.000 | -0.001 | |
| 400 | 0.001 | 0.001 | 0.001 | -0.002 | 0.001 | -0.002 | -0.005 | -0.001 | -0.002 | 0.000 | |
| 600 | -0.001 | 0.000 | 0.000 | 0.001 | -0.001 | -0.001 | 0.000 | -0.001 | 0.000 | 0.000 | |
| 800 | 0.001 | 0.000 | 0.003 | 0.001 | 0.000 | -0.001 | 0.004 | -0.001 | -0.001 | 0.000 | |
| rbias | 10 | 0.018 | 0.088 | 0.066 | 0.019 | 0.013 | 0.057 | 0.031 | 0.033 | 0.068 | 0.029 |
| 30 | 0.029 | 0.021 | 0.026 | 0.007 | 0.030 | 0.020 | 0.021 | 0.007 | 0.025 | 0.006 | |
| 50 | 0.010 | 0.003 | 0.003 | 0.010 | 0.001 | 0.012 | 0.006 | 0.005 | 0.011 | 0.010 | |
| 70 | 0.004 | 0.006 | 0.003 | 0.004 | 0.001 | 0.002 | 0.016 | 0.014 | 0.010 | 0.002 | |
| 100 | 0.002 | 0.007 | 0.004 | 0.010 | 0.006 | 0.015 | 0.002 | 0.004 | 0.018 | 0.002 | |
| 200 | 0.005 | 0.000 | 0.016 | 0.000 | 0.000 | 0.004 | 0.001 | 0.007 | 0.000 | 0.002 | |
| 400 | 0.001 | 0.001 | 0.001 | 0.005 | 0.001 | 0.003 | 0.010 | 0.002 | 0.003 | 0.000 | |
| 600 | 0.003 | 0.000 | 0.001 | 0.002 | 0.002 | 0.003 | 0.000 | 0.002 | 0.000 | 0.001 | |
| 800 | 0.003 | 0.000 | 0.005 | 0.001 | 0.000 | 0.003 | 0.007 | 0.002 | 0.003 | 0.000 | |
| RMSE | 10 | 0.493 | 0.432 | 0.393 | 0.366 | 0.356 | 0.334 | 0.334 | 0.329 | 0.323 | 0.332 |
| 30 | 0.291 | 0.239 | 0.225 | 0.209 | 0.203 | 0.201 | 0.191 | 0.179 | 0.186 | 0.181 | |
| 50 | 0.226 | 0.190 | 0.171 | 0.165 | 0.156 | 0.150 | 0.152 | 0.146 | 0.149 | 0.142 | |
| 70 | 0.199 | 0.159 | 0.149 | 0.135 | 0.131 | 0.131 | 0.127 | 0.124 | 0.126 | 0.122 | |
| 100 | 0.163 | 0.134 | 0.121 | 0.109 | 0.108 | 0.109 | 0.102 | 0.103 | 0.104 | 0.104 | |
| 200 | 0.113 | 0.094 | 0.090 | 0.082 | 0.077 | 0.073 | 0.074 | 0.074 | 0.075 | 0.071 | |
| 400 | 0.080 | 0.066 | 0.062 | 0.057 | 0.059 | 0.055 | 0.052 | 0.053 | 0.051 | 0.049 | |
| 600 | 0.063 | 0.056 | 0.053 | 0.046 | 0.044 | 0.042 | 0.043 | 0.043 | 0.043 | 0.041 | |
| 800 | 0.058 | 0.047 | 0.044 | 0.039 | 0.039 | 0.038 | 0.037 | 0.036 | 0.036 | 0.036 | |
| width | 10 | 2.025 | 1.661 | 1.494 | 1.400 | 1.354 | 1.323 | 1.286 | 1.279 | 1.270 | 1.260 |
| 30 | 1.152 | 0.951 | 0.884 | 0.819 | 0.787 | 0.767 | 0.750 | 0.744 | 0.738 | 0.736 | |
| 50 | 0.890 | 0.747 | 0.683 | 0.634 | 0.615 | 0.596 | 0.583 | 0.576 | 0.571 | 0.569 | |
| 70 | 0.754 | 0.629 | 0.579 | 0.538 | 0.519 | 0.504 | 0.492 | 0.486 | 0.483 | 0.481 | |
| 100 | 0.635 | 0.526 | 0.484 | 0.449 | 0.434 | 0.422 | 0.413 | 0.407 | 0.404 | 0.402 | |
| 200 | 0.446 | 0.371 | 0.343 | 0.318 | 0.307 | 0.298 | 0.292 | 0.288 | 0.286 | 0.284 | |
| 400 | 0.316 | 0.263 | 0.243 | 0.225 | 0.217 | 0.211 | 0.206 | 0.204 | 0.202 | 0.201 | |
| 600 | 0.258 | 0.215 | 0.198 | 0.184 | 0.177 | 0.172 | 0.168 | 0.166 | 0.165 | 0.164 | |
| 800 | 0.224 | 0.186 | 0.172 | 0.159 | 0.154 | 0.149 | 0.146 | 0.144 | 0.143 | 0.142 | |
| CP | 10 | 0.940 | 0.920 | 0.927 | 0.913 | 0.912 | 0.917 | 0.911 | 0.925 | 0.908 | 0.908 |
| 30 | 0.931 | 0.948 | 0.946 | 0.940 | 0.939 | 0.933 | 0.941 | 0.959 | 0.940 | 0.949 | |
| 50 | 0.935 | 0.952 | 0.948 | 0.940 | 0.952 | 0.946 | 0.940 | 0.935 | 0.937 | 0.955 | |
| 70 | 0.940 | 0.949 | 0.945 | 0.952 | 0.948 | 0.940 | 0.945 | 0.953 | 0.945 | 0.948 | |
| 100 | 0.949 | 0.950 | 0.955 | 0.948 | 0.958 | 0.942 | 0.961 | 0.959 | 0.943 | 0.940 | |
| 200 | 0.947 | 0.952 | 0.937 | 0.946 | 0.953 | 0.958 | 0.949 | 0.960 | 0.933 | 0.952 | |
| 400 | 0.955 | 0.950 | 0.944 | 0.944 | 0.945 | 0.941 | 0.946 | 0.942 | 0.954 | 0.954 | |
| 600 | 0.961 | 0.939 | 0.933 | 0.958 | 0.955 | 0.951 | 0.953 | 0.944 | 0.943 | 0.943 | |
| 800 | 0.944 | 0.957 | 0.953 | 0.960 | 0.956 | 0.953 | 0.954 | 0.961 | 0.959 | 0.952 | |
| SE-SD bias | 10 | 0.023 | -0.006 | -0.011 | -0.009 | -0.011 | 0.004 | -0.006 | -0.002 | 0.002 | -0.010 |
| 30 | 0.003 | 0.004 | 0.001 | 0.000 | -0.002 | -0.006 | 0.001 | 0.010 | 0.003 | 0.006 | |
| 50 | 0.001 | 0.000 | 0.003 | -0.003 | 0.001 | 0.002 | -0.004 | 0.001 | -0.003 | 0.003 | |
| 70 | -0.007 | 0.002 | -0.002 | 0.002 | 0.001 | -0.002 | -0.001 | 0.001 | -0.003 | 0.001 | |
| 100 | -0.001 | 0.000 | 0.003 | 0.006 | 0.003 | -0.001 | 0.003 | 0.001 | -0.001 | -0.002 | |
| 200 | 0.001 | 0.000 | -0.003 | -0.001 | 0.002 | 0.003 | 0.001 | -0.001 | -0.002 | 0.001 | |
| 400 | 0.000 | 0.001 | 0.000 | 0.000 | -0.003 | -0.002 | 0.001 | -0.001 | 0.000 | 0.002 | |
| 600 | 0.003 | -0.001 | -0.002 | 0.001 | 0.001 | 0.001 | 0.000 | -0.001 | -0.001 | 0.000 | |
| 800 | -0.001 | 0.000 | 0.000 | 0.002 | 0.001 | 0.000 | 0.000 | 0.001 | 0.000 | 0.000 | |
| Parameter | I | J | |||||||||
|---|---|---|---|---|---|---|---|---|---|---|---|
| 10 | 20 | 30 | 50 | 70 | 100 | 150 | 200 | 250 | 300 | ||
| 10 | 0.065 | 0.035 | 0.027 | 0.020 | 0.016 | 0.014 | 0.010 | 0.009 | 0.008 | 0.007 | |
| 30 | 0.031 | 0.015 | 0.012 | 0.007 | 0.006 | 0.005 | 0.004 | 0.003 | 0.003 | 0.002 | |
| 50 | 0.022 | 0.012 | 0.008 | 0.006 | 0.004 | 0.003 | 0.002 | 0.002 | 0.002 | 0.002 | |
| 70 | 0.019 | 0.010 | 0.006 | 0.004 | 0.003 | 0.002 | 0.002 | 0.001 | 0.001 | 0.001 | |
| 100 | 0.016 | 0.008 | 0.006 | 0.004 | 0.003 | 0.002 | 0.001 | 0.001 | 0.001 | 0.001 | |
| 200 | 0.011 | 0.005 | 0.004 | 0.002 | 0.002 | 0.001 | 0.001 | 0.001 | 0.001 | 0.001 | |
| 400 | 0.008 | 0.004 | 0.003 | 0.002 | 0.001 | 0.001 | 0.001 | 0.000 | 0.000 | 0.000 | |
| 600 | 0.007 | 0.003 | 0.002 | 0.001 | 0.001 | 0.001 | 0.000 | 0.000 | 0.000 | 0.000 | |
| 800 | 0.006 | 0.003 | 0.002 | 0.001 | 0.001 | 0.001 | 0.000 | 0.000 | 0.000 | 0.000 | |
| 10 | 0.421 | 0.319 | 0.266 | 0.215 | 0.191 | 0.170 | 0.153 | 0.148 | 0.134 | 0.138 | |
| 30 | 0.232 | 0.157 | 0.124 | 0.101 | 0.088 | 0.074 | 0.066 | 0.063 | 0.054 | 0.052 | |
| 50 | 0.164 | 0.121 | 0.100 | 0.072 | 0.065 | 0.053 | 0.045 | 0.041 | 0.039 | 0.037 | |
| 70 | 0.145 | 0.102 | 0.079 | 0.062 | 0.056 | 0.045 | 0.037 | 0.033 | 0.032 | 0.030 | |
| 100 | 0.120 | 0.082 | 0.067 | 0.053 | 0.046 | 0.037 | 0.031 | 0.028 | 0.026 | 0.023 | |
| 200 | 0.083 | 0.059 | 0.045 | 0.036 | 0.031 | 0.025 | 0.021 | 0.018 | 0.018 | 0.015 | |
| 400 | 0.060 | 0.041 | 0.034 | 0.026 | 0.022 | 0.019 | 0.015 | 0.013 | 0.013 | 0.012 | |
| 600 | 0.050 | 0.033 | 0.027 | 0.021 | 0.018 | 0.015 | 0.013 | 0.011 | 0.010 | 0.010 | |
| 800 | 0.045 | 0.029 | 0.022 | 0.018 | 0.017 | 0.013 | 0.011 | 0.010 | 0.009 | 0.009 | |
| 10 | 11.006 | 5.236 | 3.678 | 2.229 | 1.795 | 1.308 | 1.106 | 0.886 | 0.838 | 0.752 | |
| 30 | 5.432 | 2.613 | 2.046 | 1.392 | 1.054 | 0.851 | 0.667 | 0.603 | 0.525 | 0.450 | |
| 50 | 4.032 | 1.983 | 1.514 | 1.142 | 0.905 | 0.723 | 0.556 | 0.452 | 0.371 | 0.333 | |
| 70 | 3.324 | 1.805 | 1.369 | 0.984 | 0.796 | 0.641 | 0.482 | 0.377 | 0.325 | 0.287 | |
| 100 | 2.906 | 1.632 | 1.247 | 0.854 | 0.711 | 0.534 | 0.399 | 0.320 | 0.274 | 0.243 | |
| 200 | 2.142 | 1.316 | 0.933 | 0.644 | 0.544 | 0.395 | 0.284 | 0.220 | 0.194 | 0.169 | |
| 400 | 1.707 | 0.999 | 0.727 | 0.510 | 0.368 | 0.286 | 0.209 | 0.162 | 0.138 | 0.122 | |
| 600 | 1.503 | 0.825 | 0.590 | 0.419 | 0.300 | 0.230 | 0.172 | 0.136 | 0.108 | 0.102 | |
| 800 | 1.325 | 0.751 | 0.571 | 0.354 | 0.272 | 0.198 | 0.137 | 0.111 | 0.102 | 0.086 | |
| 10 | 0.559 | 0.328 | 0.259 | 0.194 | 0.156 | 0.130 | 0.109 | 0.088 | 0.081 | 0.073 | |
| 30 | 0.283 | 0.166 | 0.139 | 0.106 | 0.086 | 0.070 | 0.058 | 0.050 | 0.044 | 0.040 | |
| 50 | 0.238 | 0.138 | 0.113 | 0.083 | 0.065 | 0.054 | 0.044 | 0.038 | 0.033 | 0.029 | |
| 70 | 0.209 | 0.121 | 0.089 | 0.068 | 0.054 | 0.046 | 0.036 | 0.033 | 0.029 | 0.026 | |
| 100 | 0.184 | 0.107 | 0.079 | 0.056 | 0.048 | 0.039 | 0.029 | 0.027 | 0.023 | 0.021 | |
| 200 | 0.158 | 0.082 | 0.062 | 0.043 | 0.034 | 0.028 | 0.023 | 0.018 | 0.017 | 0.015 | |
| 400 | 0.134 | 0.065 | 0.048 | 0.033 | 0.027 | 0.021 | 0.016 | 0.014 | 0.012 | 0.011 | |
| 600 | 0.126 | 0.063 | 0.041 | 0.032 | 0.022 | 0.018 | 0.014 | 0.012 | 0.010 | 0.010 | |
| 800 | 0.128 | 0.063 | 0.042 | 0.027 | 0.021 | 0.016 | 0.013 | 0.010 | 0.009 | 0.008 | |
附表21 研究二平衡设计$\tau _{11}^{2}$小且${{W}_{i}}$为分类变量时线性混合效应模型随机效应估计rbias
| Parameter | I | J | |||||||||
|---|---|---|---|---|---|---|---|---|---|---|---|
| 10 | 20 | 30 | 50 | 70 | 100 | 150 | 200 | 250 | 300 | ||
| 10 | 0.065 | 0.035 | 0.027 | 0.020 | 0.016 | 0.014 | 0.010 | 0.009 | 0.008 | 0.007 | |
| 30 | 0.031 | 0.015 | 0.012 | 0.007 | 0.006 | 0.005 | 0.004 | 0.003 | 0.003 | 0.002 | |
| 50 | 0.022 | 0.012 | 0.008 | 0.006 | 0.004 | 0.003 | 0.002 | 0.002 | 0.002 | 0.002 | |
| 70 | 0.019 | 0.010 | 0.006 | 0.004 | 0.003 | 0.002 | 0.002 | 0.001 | 0.001 | 0.001 | |
| 100 | 0.016 | 0.008 | 0.006 | 0.004 | 0.003 | 0.002 | 0.001 | 0.001 | 0.001 | 0.001 | |
| 200 | 0.011 | 0.005 | 0.004 | 0.002 | 0.002 | 0.001 | 0.001 | 0.001 | 0.001 | 0.001 | |
| 400 | 0.008 | 0.004 | 0.003 | 0.002 | 0.001 | 0.001 | 0.001 | 0.000 | 0.000 | 0.000 | |
| 600 | 0.007 | 0.003 | 0.002 | 0.001 | 0.001 | 0.001 | 0.000 | 0.000 | 0.000 | 0.000 | |
| 800 | 0.006 | 0.003 | 0.002 | 0.001 | 0.001 | 0.001 | 0.000 | 0.000 | 0.000 | 0.000 | |
| 10 | 0.421 | 0.319 | 0.266 | 0.215 | 0.191 | 0.170 | 0.153 | 0.148 | 0.134 | 0.138 | |
| 30 | 0.232 | 0.157 | 0.124 | 0.101 | 0.088 | 0.074 | 0.066 | 0.063 | 0.054 | 0.052 | |
| 50 | 0.164 | 0.121 | 0.100 | 0.072 | 0.065 | 0.053 | 0.045 | 0.041 | 0.039 | 0.037 | |
| 70 | 0.145 | 0.102 | 0.079 | 0.062 | 0.056 | 0.045 | 0.037 | 0.033 | 0.032 | 0.030 | |
| 100 | 0.120 | 0.082 | 0.067 | 0.053 | 0.046 | 0.037 | 0.031 | 0.028 | 0.026 | 0.023 | |
| 200 | 0.083 | 0.059 | 0.045 | 0.036 | 0.031 | 0.025 | 0.021 | 0.018 | 0.018 | 0.015 | |
| 400 | 0.060 | 0.041 | 0.034 | 0.026 | 0.022 | 0.019 | 0.015 | 0.013 | 0.013 | 0.012 | |
| 600 | 0.050 | 0.033 | 0.027 | 0.021 | 0.018 | 0.015 | 0.013 | 0.011 | 0.010 | 0.010 | |
| 800 | 0.045 | 0.029 | 0.022 | 0.018 | 0.017 | 0.013 | 0.011 | 0.010 | 0.009 | 0.009 | |
| 10 | 11.006 | 5.236 | 3.678 | 2.229 | 1.795 | 1.308 | 1.106 | 0.886 | 0.838 | 0.752 | |
| 30 | 5.432 | 2.613 | 2.046 | 1.392 | 1.054 | 0.851 | 0.667 | 0.603 | 0.525 | 0.450 | |
| 50 | 4.032 | 1.983 | 1.514 | 1.142 | 0.905 | 0.723 | 0.556 | 0.452 | 0.371 | 0.333 | |
| 70 | 3.324 | 1.805 | 1.369 | 0.984 | 0.796 | 0.641 | 0.482 | 0.377 | 0.325 | 0.287 | |
| 100 | 2.906 | 1.632 | 1.247 | 0.854 | 0.711 | 0.534 | 0.399 | 0.320 | 0.274 | 0.243 | |
| 200 | 2.142 | 1.316 | 0.933 | 0.644 | 0.544 | 0.395 | 0.284 | 0.220 | 0.194 | 0.169 | |
| 400 | 1.707 | 0.999 | 0.727 | 0.510 | 0.368 | 0.286 | 0.209 | 0.162 | 0.138 | 0.122 | |
| 600 | 1.503 | 0.825 | 0.590 | 0.419 | 0.300 | 0.230 | 0.172 | 0.136 | 0.108 | 0.102 | |
| 800 | 1.325 | 0.751 | 0.571 | 0.354 | 0.272 | 0.198 | 0.137 | 0.111 | 0.102 | 0.086 | |
| 10 | 0.559 | 0.328 | 0.259 | 0.194 | 0.156 | 0.130 | 0.109 | 0.088 | 0.081 | 0.073 | |
| 30 | 0.283 | 0.166 | 0.139 | 0.106 | 0.086 | 0.070 | 0.058 | 0.050 | 0.044 | 0.040 | |
| 50 | 0.238 | 0.138 | 0.113 | 0.083 | 0.065 | 0.054 | 0.044 | 0.038 | 0.033 | 0.029 | |
| 70 | 0.209 | 0.121 | 0.089 | 0.068 | 0.054 | 0.046 | 0.036 | 0.033 | 0.029 | 0.026 | |
| 100 | 0.184 | 0.107 | 0.079 | 0.056 | 0.048 | 0.039 | 0.029 | 0.027 | 0.023 | 0.021 | |
| 200 | 0.158 | 0.082 | 0.062 | 0.043 | 0.034 | 0.028 | 0.023 | 0.018 | 0.017 | 0.015 | |
| 400 | 0.134 | 0.065 | 0.048 | 0.033 | 0.027 | 0.021 | 0.016 | 0.014 | 0.012 | 0.011 | |
| 600 | 0.126 | 0.063 | 0.041 | 0.032 | 0.022 | 0.018 | 0.014 | 0.012 | 0.010 | 0.010 | |
| 800 | 0.128 | 0.063 | 0.042 | 0.027 | 0.021 | 0.016 | 0.013 | 0.010 | 0.009 | 0.008 | |
| Parameter | I | J | |||||||||
|---|---|---|---|---|---|---|---|---|---|---|---|
| 10 | 20 | 30 | 50 | 70 | 100 | 150 | 200 | 250 | 300 | ||
| 10 | 0.065 | 0.038 | 0.028 | 0.020 | 0.015 | 0.013 | 0.010 | 0.009 | 0.008 | 0.007 | |
| 30 | 0.032 | 0.018 | 0.012 | 0.008 | 0.006 | 0.005 | 0.004 | 0.003 | 0.003 | 0.002 | |
| 50 | 0.025 | 0.013 | 0.009 | 0.006 | 0.004 | 0.003 | 0.002 | 0.002 | 0.002 | 0.001 | |
| 70 | 0.021 | 0.010 | 0.007 | 0.004 | 0.003 | 0.003 | 0.002 | 0.001 | 0.001 | 0.001 | |
| 100 | 0.017 | 0.009 | 0.006 | 0.004 | 0.003 | 0.002 | 0.001 | 0.001 | 0.001 | 0.001 | |
| 200 | 0.013 | 0.006 | 0.004 | 0.002 | 0.002 | 0.001 | 0.001 | 0.001 | 0.001 | 0.000 | |
| 400 | 0.008 | 0.004 | 0.003 | 0.002 | 0.001 | 0.001 | 0.001 | 0.000 | 0.000 | 0.000 | |
| 600 | 0.008 | 0.003 | 0.002 | 0.001 | 0.001 | 0.001 | 0.000 | 0.000 | 0.000 | 0.000 | |
| 800 | 0.006 | 0.003 | 0.002 | 0.001 | 0.001 | 0.001 | 0.000 | 0.000 | 0.000 | 0.000 | |
| 10 | 0.434 | 0.323 | 0.267 | 0.222 | 0.199 | 0.181 | 0.163 | 0.153 | 0.158 | 0.149 | |
| 30 | 0.249 | 0.161 | 0.136 | 0.112 | 0.097 | 0.090 | 0.080 | 0.076 | 0.076 | 0.072 | |
| 50 | 0.183 | 0.126 | 0.109 | 0.087 | 0.077 | 0.073 | 0.065 | 0.066 | 0.060 | 0.063 | |
| 70 | 0.157 | 0.111 | 0.092 | 0.074 | 0.066 | 0.065 | 0.058 | 0.057 | 0.057 | 0.057 | |
| 100 | 0.135 | 0.095 | 0.080 | 0.070 | 0.062 | 0.060 | 0.057 | 0.056 | 0.054 | 0.054 | |
| 200 | 0.099 | 0.071 | 0.065 | 0.058 | 0.054 | 0.053 | 0.054 | 0.053 | 0.052 | 0.053 | |
| 400 | 0.078 | 0.062 | 0.058 | 0.054 | 0.053 | 0.052 | 0.051 | 0.053 | 0.053 | 0.052 | |
| 600 | 0.068 | 0.056 | 0.054 | 0.053 | 0.053 | 0.054 | 0.051 | 0.053 | 0.053 | 0.052 | |
| 800 | 0.063 | 0.057 | 0.054 | 0.053 | 0.053 | 0.053 | 0.053 | 0.053 | 0.053 | 0.053 | |
| 10 | 1.434 | 0.942 | 0.776 | 0.594 | 0.502 | 0.430 | 0.358 | 0.302 | 0.265 | 0.262 | |
| 30 | 0.940 | 0.639 | 0.467 | 0.335 | 0.288 | 0.229 | 0.176 | 0.156 | 0.139 | 0.126 | |
| 50 | 0.816 | 0.510 | 0.362 | 0.252 | 0.214 | 0.172 | 0.131 | 0.122 | 0.106 | 0.092 | |
| 70 | 0.685 | 0.435 | 0.301 | 0.226 | 0.179 | 0.140 | 0.114 | 0.097 | 0.084 | 0.079 | |
| 100 | 0.589 | 0.345 | 0.268 | 0.179 | 0.150 | 0.122 | 0.100 | 0.082 | 0.072 | 0.066 | |
| 200 | 0.443 | 0.258 | 0.185 | 0.126 | 0.105 | 0.088 | 0.066 | 0.059 | 0.051 | 0.045 | |
| 400 | 0.328 | 0.176 | 0.130 | 0.096 | 0.071 | 0.059 | 0.047 | 0.039 | 0.034 | 0.032 | |
| 600 | 0.270 | 0.143 | 0.105 | 0.074 | 0.062 | 0.047 | 0.038 | 0.033 | 0.029 | 0.026 | |
| 800 | 0.226 | 0.123 | 0.088 | 0.060 | 0.052 | 0.043 | 0.033 | 0.029 | 0.025 | 0.024 | |
| 10 | 0.498 | 0.310 | 0.249 | 0.196 | 0.159 | 0.133 | 0.110 | 0.090 | 0.082 | 0.070 | |
| 30 | 0.306 | 0.184 | 0.146 | 0.102 | 0.085 | 0.071 | 0.058 | 0.050 | 0.043 | 0.039 | |
| 50 | 0.238 | 0.139 | 0.109 | 0.080 | 0.065 | 0.054 | 0.043 | 0.037 | 0.034 | 0.030 | |
| 70 | 0.210 | 0.118 | 0.093 | 0.068 | 0.056 | 0.046 | 0.037 | 0.032 | 0.028 | 0.026 | |
| 100 | 0.189 | 0.101 | 0.078 | 0.055 | 0.049 | 0.039 | 0.030 | 0.027 | 0.022 | 0.021 | |
| 200 | 0.157 | 0.083 | 0.062 | 0.043 | 0.035 | 0.028 | 0.023 | 0.019 | 0.017 | 0.016 | |
| 400 | 0.128 | 0.066 | 0.049 | 0.034 | 0.026 | 0.022 | 0.016 | 0.013 | 0.012 | 0.011 | |
| 600 | 0.128 | 0.063 | 0.045 | 0.029 | 0.024 | 0.018 | 0.014 | 0.011 | 0.010 | 0.009 | |
| 800 | 0.119 | 0.061 | 0.041 | 0.028 | 0.022 | 0.016 | 0.013 | 0.010 | 0.009 | 0.008 | |
附表22 研究二平衡设计$\tau _{11}^{2}$中且${{W}_{i}}$为分类变量时线性混合效应模型随机效应估计rbias
| Parameter | I | J | |||||||||
|---|---|---|---|---|---|---|---|---|---|---|---|
| 10 | 20 | 30 | 50 | 70 | 100 | 150 | 200 | 250 | 300 | ||
| 10 | 0.065 | 0.038 | 0.028 | 0.020 | 0.015 | 0.013 | 0.010 | 0.009 | 0.008 | 0.007 | |
| 30 | 0.032 | 0.018 | 0.012 | 0.008 | 0.006 | 0.005 | 0.004 | 0.003 | 0.003 | 0.002 | |
| 50 | 0.025 | 0.013 | 0.009 | 0.006 | 0.004 | 0.003 | 0.002 | 0.002 | 0.002 | 0.001 | |
| 70 | 0.021 | 0.010 | 0.007 | 0.004 | 0.003 | 0.003 | 0.002 | 0.001 | 0.001 | 0.001 | |
| 100 | 0.017 | 0.009 | 0.006 | 0.004 | 0.003 | 0.002 | 0.001 | 0.001 | 0.001 | 0.001 | |
| 200 | 0.013 | 0.006 | 0.004 | 0.002 | 0.002 | 0.001 | 0.001 | 0.001 | 0.001 | 0.000 | |
| 400 | 0.008 | 0.004 | 0.003 | 0.002 | 0.001 | 0.001 | 0.001 | 0.000 | 0.000 | 0.000 | |
| 600 | 0.008 | 0.003 | 0.002 | 0.001 | 0.001 | 0.001 | 0.000 | 0.000 | 0.000 | 0.000 | |
| 800 | 0.006 | 0.003 | 0.002 | 0.001 | 0.001 | 0.001 | 0.000 | 0.000 | 0.000 | 0.000 | |
| 10 | 0.434 | 0.323 | 0.267 | 0.222 | 0.199 | 0.181 | 0.163 | 0.153 | 0.158 | 0.149 | |
| 30 | 0.249 | 0.161 | 0.136 | 0.112 | 0.097 | 0.090 | 0.080 | 0.076 | 0.076 | 0.072 | |
| 50 | 0.183 | 0.126 | 0.109 | 0.087 | 0.077 | 0.073 | 0.065 | 0.066 | 0.060 | 0.063 | |
| 70 | 0.157 | 0.111 | 0.092 | 0.074 | 0.066 | 0.065 | 0.058 | 0.057 | 0.057 | 0.057 | |
| 100 | 0.135 | 0.095 | 0.080 | 0.070 | 0.062 | 0.060 | 0.057 | 0.056 | 0.054 | 0.054 | |
| 200 | 0.099 | 0.071 | 0.065 | 0.058 | 0.054 | 0.053 | 0.054 | 0.053 | 0.052 | 0.053 | |
| 400 | 0.078 | 0.062 | 0.058 | 0.054 | 0.053 | 0.052 | 0.051 | 0.053 | 0.053 | 0.052 | |
| 600 | 0.068 | 0.056 | 0.054 | 0.053 | 0.053 | 0.054 | 0.051 | 0.053 | 0.053 | 0.052 | |
| 800 | 0.063 | 0.057 | 0.054 | 0.053 | 0.053 | 0.053 | 0.053 | 0.053 | 0.053 | 0.053 | |
| 10 | 1.434 | 0.942 | 0.776 | 0.594 | 0.502 | 0.430 | 0.358 | 0.302 | 0.265 | 0.262 | |
| 30 | 0.940 | 0.639 | 0.467 | 0.335 | 0.288 | 0.229 | 0.176 | 0.156 | 0.139 | 0.126 | |
| 50 | 0.816 | 0.510 | 0.362 | 0.252 | 0.214 | 0.172 | 0.131 | 0.122 | 0.106 | 0.092 | |
| 70 | 0.685 | 0.435 | 0.301 | 0.226 | 0.179 | 0.140 | 0.114 | 0.097 | 0.084 | 0.079 | |
| 100 | 0.589 | 0.345 | 0.268 | 0.179 | 0.150 | 0.122 | 0.100 | 0.082 | 0.072 | 0.066 | |
| 200 | 0.443 | 0.258 | 0.185 | 0.126 | 0.105 | 0.088 | 0.066 | 0.059 | 0.051 | 0.045 | |
| 400 | 0.328 | 0.176 | 0.130 | 0.096 | 0.071 | 0.059 | 0.047 | 0.039 | 0.034 | 0.032 | |
| 600 | 0.270 | 0.143 | 0.105 | 0.074 | 0.062 | 0.047 | 0.038 | 0.033 | 0.029 | 0.026 | |
| 800 | 0.226 | 0.123 | 0.088 | 0.060 | 0.052 | 0.043 | 0.033 | 0.029 | 0.025 | 0.024 | |
| 10 | 0.498 | 0.310 | 0.249 | 0.196 | 0.159 | 0.133 | 0.110 | 0.090 | 0.082 | 0.070 | |
| 30 | 0.306 | 0.184 | 0.146 | 0.102 | 0.085 | 0.071 | 0.058 | 0.050 | 0.043 | 0.039 | |
| 50 | 0.238 | 0.139 | 0.109 | 0.080 | 0.065 | 0.054 | 0.043 | 0.037 | 0.034 | 0.030 | |
| 70 | 0.210 | 0.118 | 0.093 | 0.068 | 0.056 | 0.046 | 0.037 | 0.032 | 0.028 | 0.026 | |
| 100 | 0.189 | 0.101 | 0.078 | 0.055 | 0.049 | 0.039 | 0.030 | 0.027 | 0.022 | 0.021 | |
| 200 | 0.157 | 0.083 | 0.062 | 0.043 | 0.035 | 0.028 | 0.023 | 0.019 | 0.017 | 0.016 | |
| 400 | 0.128 | 0.066 | 0.049 | 0.034 | 0.026 | 0.022 | 0.016 | 0.013 | 0.012 | 0.011 | |
| 600 | 0.128 | 0.063 | 0.045 | 0.029 | 0.024 | 0.018 | 0.014 | 0.011 | 0.010 | 0.009 | |
| 800 | 0.119 | 0.061 | 0.041 | 0.028 | 0.022 | 0.016 | 0.013 | 0.010 | 0.009 | 0.008 | |
| Parameter | I | J | |||||||||
|---|---|---|---|---|---|---|---|---|---|---|---|
| 10 | 20 | 30 | 50 | 70 | 100 | 150 | 200 | 250 | 300 | ||
| 10 | 0.066 | 0.038 | 0.028 | 0.020 | 0.016 | 0.013 | 0.010 | 0.009 | 0.008 | 0.007 | |
| 30 | 0.031 | 0.018 | 0.012 | 0.008 | 0.006 | 0.005 | 0.004 | 0.003 | 0.003 | 0.002 | |
| 50 | 0.024 | 0.012 | 0.009 | 0.006 | 0.004 | 0.003 | 0.002 | 0.002 | 0.002 | 0.001 | |
| 70 | 0.021 | 0.011 | 0.007 | 0.005 | 0.003 | 0.002 | 0.002 | 0.001 | 0.001 | 0.001 | |
| 100 | 0.018 | 0.009 | 0.006 | 0.004 | 0.003 | 0.002 | 0.001 | 0.001 | 0.001 | 0.001 | |
| 200 | 0.013 | 0.006 | 0.004 | 0.002 | 0.002 | 0.001 | 0.001 | 0.001 | 0.001 | 0.000 | |
| 400 | 0.009 | 0.004 | 0.003 | 0.002 | 0.001 | 0.001 | 0.001 | 0.000 | 0.000 | 0.000 | |
| 600 | 0.007 | 0.003 | 0.002 | 0.001 | 0.001 | 0.001 | 0.000 | 0.000 | 0.000 | 0.000 | |
| 800 | 0.006 | 0.003 | 0.002 | 0.001 | 0.001 | 0.001 | 0.000 | 0.000 | 0.000 | 0.000 | |
| 10 | 0.309 | 0.234 | 0.199 | 0.172 | 0.154 | 0.146 | 0.135 | 0.128 | 0.119 | 0.121 | |
| 30 | 0.162 | 0.110 | 0.094 | 0.075 | 0.068 | 0.057 | 0.050 | 0.047 | 0.045 | 0.045 | |
| 50 | 0.123 | 0.085 | 0.066 | 0.054 | 0.048 | 0.042 | 0.035 | 0.032 | 0.029 | 0.030 | |
| 70 | 0.100 | 0.068 | 0.057 | 0.046 | 0.039 | 0.033 | 0.028 | 0.026 | 0.024 | 0.022 | |
| 100 | 0.081 | 0.059 | 0.045 | 0.037 | 0.031 | 0.026 | 0.023 | 0.020 | 0.019 | 0.018 | |
| 200 | 0.058 | 0.040 | 0.033 | 0.025 | 0.023 | 0.018 | 0.016 | 0.014 | 0.012 | 0.011 | |
| 400 | 0.042 | 0.028 | 0.022 | 0.018 | 0.015 | 0.012 | 0.010 | 0.009 | 0.008 | 0.008 | |
| 600 | 0.033 | 0.024 | 0.018 | 0.015 | 0.011 | 0.010 | 0.008 | 0.007 | 0.007 | 0.006 | |
| 800 | 0.030 | 0.020 | 0.017 | 0.013 | 0.011 | 0.009 | 0.007 | 0.006 | 0.006 | 0.005 | |
| 10 | 1.439 | 0.982 | 0.779 | 0.611 | 0.520 | 0.443 | 0.350 | 0.301 | 0.268 | 0.252 | |
| 30 | 0.919 | 0.602 | 0.497 | 0.344 | 0.283 | 0.221 | 0.185 | 0.155 | 0.135 | 0.122 | |
| 50 | 0.761 | 0.494 | 0.386 | 0.262 | 0.206 | 0.172 | 0.139 | 0.122 | 0.100 | 0.095 | |
| 70 | 0.674 | 0.408 | 0.302 | 0.217 | 0.171 | 0.149 | 0.110 | 0.097 | 0.088 | 0.080 | |
| 100 | 0.610 | 0.350 | 0.260 | 0.185 | 0.147 | 0.116 | 0.095 | 0.077 | 0.073 | 0.063 | |
| 200 | 0.440 | 0.256 | 0.178 | 0.128 | 0.103 | 0.086 | 0.067 | 0.057 | 0.051 | 0.045 | |
| 400 | 0.316 | 0.173 | 0.131 | 0.092 | 0.075 | 0.057 | 0.045 | 0.041 | 0.035 | 0.033 | |
| 600 | 0.252 | 0.141 | 0.107 | 0.075 | 0.059 | 0.046 | 0.038 | 0.032 | 0.029 | 0.027 | |
| 800 | 0.231 | 0.122 | 0.093 | 0.064 | 0.052 | 0.041 | 0.035 | 0.028 | 0.025 | 0.022 | |
| 10 | 0.507 | 0.324 | 0.243 | 0.187 | 0.153 | 0.128 | 0.104 | 0.096 | 0.083 | 0.076 | |
| 30 | 0.293 | 0.187 | 0.136 | 0.104 | 0.087 | 0.069 | 0.056 | 0.049 | 0.044 | 0.039 | |
| 50 | 0.234 | 0.142 | 0.110 | 0.078 | 0.062 | 0.056 | 0.045 | 0.037 | 0.033 | 0.029 | |
| 70 | 0.200 | 0.126 | 0.092 | 0.068 | 0.055 | 0.046 | 0.037 | 0.031 | 0.027 | 0.026 | |
| 100 | 0.179 | 0.103 | 0.081 | 0.058 | 0.047 | 0.039 | 0.030 | 0.025 | 0.024 | 0.021 | |
| 200 | 0.156 | 0.082 | 0.062 | 0.043 | 0.034 | 0.027 | 0.022 | 0.019 | 0.017 | 0.015 | |
| 400 | 0.135 | 0.067 | 0.047 | 0.034 | 0.027 | 0.020 | 0.016 | 0.014 | 0.011 | 0.012 | |
| 600 | 0.131 | 0.066 | 0.045 | 0.030 | 0.023 | 0.018 | 0.014 | 0.012 | 0.010 | 0.009 | |
| 800 | 0.123 | 0.061 | 0.042 | 0.028 | 0.020 | 0.016 | 0.013 | 0.010 | 0.009 | 0.008 | |
附表23 研究二平衡设计$\tau _{11}^{2}$中等且${{W}_{i}}$为连续变量时线性混合效应模型随机效应估计rbias
| Parameter | I | J | |||||||||
|---|---|---|---|---|---|---|---|---|---|---|---|
| 10 | 20 | 30 | 50 | 70 | 100 | 150 | 200 | 250 | 300 | ||
| 10 | 0.066 | 0.038 | 0.028 | 0.020 | 0.016 | 0.013 | 0.010 | 0.009 | 0.008 | 0.007 | |
| 30 | 0.031 | 0.018 | 0.012 | 0.008 | 0.006 | 0.005 | 0.004 | 0.003 | 0.003 | 0.002 | |
| 50 | 0.024 | 0.012 | 0.009 | 0.006 | 0.004 | 0.003 | 0.002 | 0.002 | 0.002 | 0.001 | |
| 70 | 0.021 | 0.011 | 0.007 | 0.005 | 0.003 | 0.002 | 0.002 | 0.001 | 0.001 | 0.001 | |
| 100 | 0.018 | 0.009 | 0.006 | 0.004 | 0.003 | 0.002 | 0.001 | 0.001 | 0.001 | 0.001 | |
| 200 | 0.013 | 0.006 | 0.004 | 0.002 | 0.002 | 0.001 | 0.001 | 0.001 | 0.001 | 0.000 | |
| 400 | 0.009 | 0.004 | 0.003 | 0.002 | 0.001 | 0.001 | 0.001 | 0.000 | 0.000 | 0.000 | |
| 600 | 0.007 | 0.003 | 0.002 | 0.001 | 0.001 | 0.001 | 0.000 | 0.000 | 0.000 | 0.000 | |
| 800 | 0.006 | 0.003 | 0.002 | 0.001 | 0.001 | 0.001 | 0.000 | 0.000 | 0.000 | 0.000 | |
| 10 | 0.309 | 0.234 | 0.199 | 0.172 | 0.154 | 0.146 | 0.135 | 0.128 | 0.119 | 0.121 | |
| 30 | 0.162 | 0.110 | 0.094 | 0.075 | 0.068 | 0.057 | 0.050 | 0.047 | 0.045 | 0.045 | |
| 50 | 0.123 | 0.085 | 0.066 | 0.054 | 0.048 | 0.042 | 0.035 | 0.032 | 0.029 | 0.030 | |
| 70 | 0.100 | 0.068 | 0.057 | 0.046 | 0.039 | 0.033 | 0.028 | 0.026 | 0.024 | 0.022 | |
| 100 | 0.081 | 0.059 | 0.045 | 0.037 | 0.031 | 0.026 | 0.023 | 0.020 | 0.019 | 0.018 | |
| 200 | 0.058 | 0.040 | 0.033 | 0.025 | 0.023 | 0.018 | 0.016 | 0.014 | 0.012 | 0.011 | |
| 400 | 0.042 | 0.028 | 0.022 | 0.018 | 0.015 | 0.012 | 0.010 | 0.009 | 0.008 | 0.008 | |
| 600 | 0.033 | 0.024 | 0.018 | 0.015 | 0.011 | 0.010 | 0.008 | 0.007 | 0.007 | 0.006 | |
| 800 | 0.030 | 0.020 | 0.017 | 0.013 | 0.011 | 0.009 | 0.007 | 0.006 | 0.006 | 0.005 | |
| 10 | 1.439 | 0.982 | 0.779 | 0.611 | 0.520 | 0.443 | 0.350 | 0.301 | 0.268 | 0.252 | |
| 30 | 0.919 | 0.602 | 0.497 | 0.344 | 0.283 | 0.221 | 0.185 | 0.155 | 0.135 | 0.122 | |
| 50 | 0.761 | 0.494 | 0.386 | 0.262 | 0.206 | 0.172 | 0.139 | 0.122 | 0.100 | 0.095 | |
| 70 | 0.674 | 0.408 | 0.302 | 0.217 | 0.171 | 0.149 | 0.110 | 0.097 | 0.088 | 0.080 | |
| 100 | 0.610 | 0.350 | 0.260 | 0.185 | 0.147 | 0.116 | 0.095 | 0.077 | 0.073 | 0.063 | |
| 200 | 0.440 | 0.256 | 0.178 | 0.128 | 0.103 | 0.086 | 0.067 | 0.057 | 0.051 | 0.045 | |
| 400 | 0.316 | 0.173 | 0.131 | 0.092 | 0.075 | 0.057 | 0.045 | 0.041 | 0.035 | 0.033 | |
| 600 | 0.252 | 0.141 | 0.107 | 0.075 | 0.059 | 0.046 | 0.038 | 0.032 | 0.029 | 0.027 | |
| 800 | 0.231 | 0.122 | 0.093 | 0.064 | 0.052 | 0.041 | 0.035 | 0.028 | 0.025 | 0.022 | |
| 10 | 0.507 | 0.324 | 0.243 | 0.187 | 0.153 | 0.128 | 0.104 | 0.096 | 0.083 | 0.076 | |
| 30 | 0.293 | 0.187 | 0.136 | 0.104 | 0.087 | 0.069 | 0.056 | 0.049 | 0.044 | 0.039 | |
| 50 | 0.234 | 0.142 | 0.110 | 0.078 | 0.062 | 0.056 | 0.045 | 0.037 | 0.033 | 0.029 | |
| 70 | 0.200 | 0.126 | 0.092 | 0.068 | 0.055 | 0.046 | 0.037 | 0.031 | 0.027 | 0.026 | |
| 100 | 0.179 | 0.103 | 0.081 | 0.058 | 0.047 | 0.039 | 0.030 | 0.025 | 0.024 | 0.021 | |
| 200 | 0.156 | 0.082 | 0.062 | 0.043 | 0.034 | 0.027 | 0.022 | 0.019 | 0.017 | 0.015 | |
| 400 | 0.135 | 0.067 | 0.047 | 0.034 | 0.027 | 0.020 | 0.016 | 0.014 | 0.011 | 0.012 | |
| 600 | 0.131 | 0.066 | 0.045 | 0.030 | 0.023 | 0.018 | 0.014 | 0.012 | 0.010 | 0.009 | |
| 800 | 0.123 | 0.061 | 0.042 | 0.028 | 0.020 | 0.016 | 0.013 | 0.010 | 0.009 | 0.008 | |
| Parameter | I | J | |||||||||
|---|---|---|---|---|---|---|---|---|---|---|---|
| 10 | 20 | 30 | 50 | 70 | 100 | 150 | 200 | 250 | 300 | ||
| 10 | 0.063 | 0.036 | 0.027 | 0.019 | 0.016 | 0.014 | 0.011 | 0.008 | 0.008 | 0.007 | |
| 30 | 0.032 | 0.018 | 0.012 | 0.008 | 0.007 | 0.005 | 0.004 | 0.003 | 0.003 | 0.002 | |
| 50 | 0.024 | 0.013 | 0.009 | 0.006 | 0.004 | 0.003 | 0.002 | 0.002 | 0.002 | 0.001 | |
| 70 | 0.021 | 0.010 | 0.007 | 0.004 | 0.003 | 0.002 | 0.002 | 0.001 | 0.001 | 0.001 | |
| 100 | 0.018 | 0.009 | 0.006 | 0.003 | 0.003 | 0.002 | 0.001 | 0.001 | 0.001 | 0.001 | |
| 200 | 0.013 | 0.006 | 0.004 | 0.002 | 0.002 | 0.001 | 0.001 | 0.001 | 0.001 | 0.000 | |
| 400 | 0.009 | 0.004 | 0.003 | 0.002 | 0.001 | 0.001 | 0.001 | 0.000 | 0.000 | 0.000 | |
| 600 | 0.007 | 0.003 | 0.002 | 0.001 | 0.001 | 0.001 | 0.000 | 0.000 | 0.000 | 0.000 | |
| 800 | 0.006 | 0.003 | 0.002 | 0.001 | 0.001 | 0.001 | 0.000 | 0.000 | 0.000 | 0.000 | |
| 10 | 0.418 | 0.310 | 0.273 | 0.227 | 0.194 | 0.183 | 0.160 | 0.159 | 0.163 | 0.148 | |
| 30 | 0.239 | 0.164 | 0.137 | 0.113 | 0.101 | 0.088 | 0.081 | 0.080 | 0.072 | 0.071 | |
| 50 | 0.187 | 0.127 | 0.109 | 0.089 | 0.080 | 0.070 | 0.066 | 0.064 | 0.061 | 0.061 | |
| 70 | 0.155 | 0.109 | 0.092 | 0.076 | 0.066 | 0.064 | 0.061 | 0.058 | 0.058 | 0.056 | |
| 100 | 0.134 | 0.098 | 0.084 | 0.069 | 0.063 | 0.058 | 0.057 | 0.054 | 0.055 | 0.053 | |
| 200 | 0.095 | 0.071 | 0.065 | 0.061 | 0.056 | 0.055 | 0.050 | 0.053 | 0.054 | 0.053 | |
| 400 | 0.073 | 0.061 | 0.056 | 0.053 | 0.054 | 0.053 | 0.053 | 0.052 | 0.052 | 0.052 | |
| 600 | 0.069 | 0.057 | 0.055 | 0.053 | 0.053 | 0.052 | 0.052 | 0.053 | 0.053 | 0.053 | |
| 800 | 0.062 | 0.055 | 0.053 | 0.053 | 0.052 | 0.053 | 0.053 | 0.052 | 0.053 | 0.053 | |
| 10 | 1.428 | 0.915 | 0.786 | 0.630 | 0.530 | 0.424 | 0.350 | 0.315 | 0.269 | 0.256 | |
| 30 | 0.885 | 0.624 | 0.481 | 0.346 | 0.279 | 0.227 | 0.183 | 0.153 | 0.140 | 0.134 | |
| 50 | 0.776 | 0.476 | 0.360 | 0.260 | 0.214 | 0.177 | 0.137 | 0.114 | 0.105 | 0.096 | |
| 70 | 0.681 | 0.413 | 0.310 | 0.225 | 0.180 | 0.138 | 0.118 | 0.097 | 0.086 | 0.078 | |
| 100 | 0.599 | 0.365 | 0.264 | 0.189 | 0.147 | 0.124 | 0.092 | 0.081 | 0.071 | 0.065 | |
| 200 | 0.445 | 0.244 | 0.181 | 0.122 | 0.108 | 0.086 | 0.068 | 0.059 | 0.050 | 0.044 | |
| 400 | 0.310 | 0.178 | 0.129 | 0.093 | 0.071 | 0.058 | 0.048 | 0.040 | 0.036 | 0.031 | |
| 600 | 0.254 | 0.144 | 0.108 | 0.078 | 0.059 | 0.046 | 0.038 | 0.033 | 0.028 | 0.025 | |
| 800 | 0.225 | 0.125 | 0.089 | 0.063 | 0.051 | 0.042 | 0.033 | 0.027 | 0.025 | 0.023 | |
| 10 | 0.494 | 0.310 | 0.256 | 0.194 | 0.150 | 0.138 | 0.101 | 0.089 | 0.082 | 0.073 | |
| 30 | 0.294 | 0.177 | 0.143 | 0.106 | 0.086 | 0.067 | 0.058 | 0.048 | 0.043 | 0.042 | |
| 50 | 0.252 | 0.137 | 0.102 | 0.081 | 0.064 | 0.052 | 0.043 | 0.038 | 0.035 | 0.030 | |
| 70 | 0.208 | 0.120 | 0.092 | 0.070 | 0.055 | 0.045 | 0.037 | 0.033 | 0.029 | 0.025 | |
| 100 | 0.189 | 0.107 | 0.080 | 0.057 | 0.047 | 0.039 | 0.033 | 0.026 | 0.023 | 0.021 | |
| 200 | 0.151 | 0.078 | 0.058 | 0.044 | 0.034 | 0.028 | 0.022 | 0.019 | 0.017 | 0.015 | |
| 400 | 0.130 | 0.068 | 0.047 | 0.033 | 0.027 | 0.022 | 0.016 | 0.014 | 0.012 | 0.011 | |
| 600 | 0.124 | 0.061 | 0.044 | 0.029 | 0.023 | 0.018 | 0.014 | 0.012 | 0.010 | 0.010 | |
| 800 | 0.121 | 0.061 | 0.041 | 0.026 | 0.022 | 0.017 | 0.013 | 0.011 | 0.009 | 0.008 | |
附表24 研究二非平衡设计$\tau _{11}^{2}$中且${{W}_{i}}$为分类变量时线性混合效应模型随机效应估计rbias
| Parameter | I | J | |||||||||
|---|---|---|---|---|---|---|---|---|---|---|---|
| 10 | 20 | 30 | 50 | 70 | 100 | 150 | 200 | 250 | 300 | ||
| 10 | 0.063 | 0.036 | 0.027 | 0.019 | 0.016 | 0.014 | 0.011 | 0.008 | 0.008 | 0.007 | |
| 30 | 0.032 | 0.018 | 0.012 | 0.008 | 0.007 | 0.005 | 0.004 | 0.003 | 0.003 | 0.002 | |
| 50 | 0.024 | 0.013 | 0.009 | 0.006 | 0.004 | 0.003 | 0.002 | 0.002 | 0.002 | 0.001 | |
| 70 | 0.021 | 0.010 | 0.007 | 0.004 | 0.003 | 0.002 | 0.002 | 0.001 | 0.001 | 0.001 | |
| 100 | 0.018 | 0.009 | 0.006 | 0.003 | 0.003 | 0.002 | 0.001 | 0.001 | 0.001 | 0.001 | |
| 200 | 0.013 | 0.006 | 0.004 | 0.002 | 0.002 | 0.001 | 0.001 | 0.001 | 0.001 | 0.000 | |
| 400 | 0.009 | 0.004 | 0.003 | 0.002 | 0.001 | 0.001 | 0.001 | 0.000 | 0.000 | 0.000 | |
| 600 | 0.007 | 0.003 | 0.002 | 0.001 | 0.001 | 0.001 | 0.000 | 0.000 | 0.000 | 0.000 | |
| 800 | 0.006 | 0.003 | 0.002 | 0.001 | 0.001 | 0.001 | 0.000 | 0.000 | 0.000 | 0.000 | |
| 10 | 0.418 | 0.310 | 0.273 | 0.227 | 0.194 | 0.183 | 0.160 | 0.159 | 0.163 | 0.148 | |
| 30 | 0.239 | 0.164 | 0.137 | 0.113 | 0.101 | 0.088 | 0.081 | 0.080 | 0.072 | 0.071 | |
| 50 | 0.187 | 0.127 | 0.109 | 0.089 | 0.080 | 0.070 | 0.066 | 0.064 | 0.061 | 0.061 | |
| 70 | 0.155 | 0.109 | 0.092 | 0.076 | 0.066 | 0.064 | 0.061 | 0.058 | 0.058 | 0.056 | |
| 100 | 0.134 | 0.098 | 0.084 | 0.069 | 0.063 | 0.058 | 0.057 | 0.054 | 0.055 | 0.053 | |
| 200 | 0.095 | 0.071 | 0.065 | 0.061 | 0.056 | 0.055 | 0.050 | 0.053 | 0.054 | 0.053 | |
| 400 | 0.073 | 0.061 | 0.056 | 0.053 | 0.054 | 0.053 | 0.053 | 0.052 | 0.052 | 0.052 | |
| 600 | 0.069 | 0.057 | 0.055 | 0.053 | 0.053 | 0.052 | 0.052 | 0.053 | 0.053 | 0.053 | |
| 800 | 0.062 | 0.055 | 0.053 | 0.053 | 0.052 | 0.053 | 0.053 | 0.052 | 0.053 | 0.053 | |
| 10 | 1.428 | 0.915 | 0.786 | 0.630 | 0.530 | 0.424 | 0.350 | 0.315 | 0.269 | 0.256 | |
| 30 | 0.885 | 0.624 | 0.481 | 0.346 | 0.279 | 0.227 | 0.183 | 0.153 | 0.140 | 0.134 | |
| 50 | 0.776 | 0.476 | 0.360 | 0.260 | 0.214 | 0.177 | 0.137 | 0.114 | 0.105 | 0.096 | |
| 70 | 0.681 | 0.413 | 0.310 | 0.225 | 0.180 | 0.138 | 0.118 | 0.097 | 0.086 | 0.078 | |
| 100 | 0.599 | 0.365 | 0.264 | 0.189 | 0.147 | 0.124 | 0.092 | 0.081 | 0.071 | 0.065 | |
| 200 | 0.445 | 0.244 | 0.181 | 0.122 | 0.108 | 0.086 | 0.068 | 0.059 | 0.050 | 0.044 | |
| 400 | 0.310 | 0.178 | 0.129 | 0.093 | 0.071 | 0.058 | 0.048 | 0.040 | 0.036 | 0.031 | |
| 600 | 0.254 | 0.144 | 0.108 | 0.078 | 0.059 | 0.046 | 0.038 | 0.033 | 0.028 | 0.025 | |
| 800 | 0.225 | 0.125 | 0.089 | 0.063 | 0.051 | 0.042 | 0.033 | 0.027 | 0.025 | 0.023 | |
| 10 | 0.494 | 0.310 | 0.256 | 0.194 | 0.150 | 0.138 | 0.101 | 0.089 | 0.082 | 0.073 | |
| 30 | 0.294 | 0.177 | 0.143 | 0.106 | 0.086 | 0.067 | 0.058 | 0.048 | 0.043 | 0.042 | |
| 50 | 0.252 | 0.137 | 0.102 | 0.081 | 0.064 | 0.052 | 0.043 | 0.038 | 0.035 | 0.030 | |
| 70 | 0.208 | 0.120 | 0.092 | 0.070 | 0.055 | 0.045 | 0.037 | 0.033 | 0.029 | 0.025 | |
| 100 | 0.189 | 0.107 | 0.080 | 0.057 | 0.047 | 0.039 | 0.033 | 0.026 | 0.023 | 0.021 | |
| 200 | 0.151 | 0.078 | 0.058 | 0.044 | 0.034 | 0.028 | 0.022 | 0.019 | 0.017 | 0.015 | |
| 400 | 0.130 | 0.068 | 0.047 | 0.033 | 0.027 | 0.022 | 0.016 | 0.014 | 0.012 | 0.011 | |
| 600 | 0.124 | 0.061 | 0.044 | 0.029 | 0.023 | 0.018 | 0.014 | 0.012 | 0.010 | 0.010 | |
| 800 | 0.121 | 0.061 | 0.041 | 0.026 | 0.022 | 0.017 | 0.013 | 0.011 | 0.009 | 0.008 | |
| Parameter | I | J | |||||||||
|---|---|---|---|---|---|---|---|---|---|---|---|
| 10 | 20 | 30 | 50 | 70 | 100 | 150 | 200 | 250 | 300 | ||
| 10 | 0.065 | 0.038 | 0.028 | 0.019 | 0.016 | 0.013 | 0.010 | 0.009 | 0.008 | 0.007 | |
| 30 | 0.035 | 0.018 | 0.012 | 0.008 | 0.006 | 0.005 | 0.004 | 0.003 | 0.003 | 0.002 | |
| 50 | 0.026 | 0.013 | 0.009 | 0.005 | 0.004 | 0.003 | 0.002 | 0.002 | 0.002 | 0.002 | |
| 70 | 0.021 | 0.010 | 0.007 | 0.005 | 0.003 | 0.003 | 0.002 | 0.002 | 0.001 | 0.001 | |
| 100 | 0.018 | 0.009 | 0.006 | 0.004 | 0.003 | 0.002 | 0.001 | 0.001 | 0.001 | 0.001 | |
| 200 | 0.013 | 0.006 | 0.004 | 0.002 | 0.002 | 0.001 | 0.001 | 0.001 | 0.001 | 0.001 | |
| 400 | 0.009 | 0.004 | 0.003 | 0.002 | 0.001 | 0.001 | 0.001 | 0.000 | 0.000 | 0.000 | |
| 600 | 0.007 | 0.003 | 0.002 | 0.001 | 0.001 | 0.001 | 0.000 | 0.000 | 0.000 | 0.000 | |
| 800 | 0.006 | 0.003 | 0.002 | 0.001 | 0.001 | 0.001 | 0.000 | 0.000 | 0.000 | 0.000 | |
| 10 | 0.458 | 0.345 | 0.296 | 0.262 | 0.237 | 0.229 | 0.223 | 0.212 | 0.215 | 0.216 | |
| 30 | 0.273 | 0.204 | 0.179 | 0.166 | 0.157 | 0.151 | 0.152 | 0.153 | 0.153 | 0.152 | |
| 50 | 0.214 | 0.182 | 0.162 | 0.156 | 0.145 | 0.146 | 0.151 | 0.149 | 0.147 | 0.147 | |
| 70 | 0.194 | 0.161 | 0.158 | 0.148 | 0.148 | 0.144 | 0.149 | 0.145 | 0.148 | 0.148 | |
| 100 | 0.184 | 0.159 | 0.150 | 0.148 | 0.143 | 0.145 | 0.146 | 0.145 | 0.146 | 0.144 | |
| 200 | 0.150 | 0.147 | 0.147 | 0.148 | 0.148 | 0.143 | 0.148 | 0.146 | 0.148 | 0.145 | |
| 400 | 0.148 | 0.144 | 0.149 | 0.148 | 0.147 | 0.144 | 0.145 | 0.145 | 0.146 | 0.146 | |
| 600 | 0.146 | 0.145 | 0.148 | 0.145 | 0.146 | 0.146 | 0.146 | 0.146 | 0.146 | 0.146 | |
| 800 | 0.148 | 0.145 | 0.145 | 0.144 | 0.145 | 0.146 | 0.145 | 0.146 | 0.146 | 0.146 | |
| 10 | 0.851 | 0.588 | 0.470 | 0.359 | 0.308 | 0.263 | 0.218 | 0.198 | 0.185 | 0.182 | |
| 30 | 0.504 | 0.316 | 0.256 | 0.176 | 0.157 | 0.131 | 0.106 | 0.089 | 0.088 | 0.079 | |
| 50 | 0.394 | 0.249 | 0.194 | 0.141 | 0.115 | 0.097 | 0.083 | 0.068 | 0.062 | 0.056 | |
| 70 | 0.324 | 0.208 | 0.157 | 0.120 | 0.097 | 0.081 | 0.067 | 0.056 | 0.052 | 0.047 | |
| 100 | 0.275 | 0.171 | 0.132 | 0.094 | 0.083 | 0.068 | 0.054 | 0.047 | 0.045 | 0.040 | |
| 200 | 0.195 | 0.124 | 0.090 | 0.072 | 0.057 | 0.047 | 0.038 | 0.033 | 0.030 | 0.028 | |
| 400 | 0.148 | 0.085 | 0.068 | 0.051 | 0.041 | 0.033 | 0.028 | 0.023 | 0.020 | 0.018 | |
| 600 | 0.113 | 0.068 | 0.056 | 0.040 | 0.034 | 0.026 | 0.023 | 0.019 | 0.017 | 0.015 | |
| 800 | 0.097 | 0.059 | 0.047 | 0.034 | 0.028 | 0.024 | 0.019 | 0.016 | 0.015 | 0.013 | |
| 10 | 0.537 | 0.323 | 0.254 | 0.193 | 0.157 | 0.123 | 0.107 | 0.087 | 0.084 | 0.073 | |
| 30 | 0.291 | 0.185 | 0.137 | 0.106 | 0.087 | 0.072 | 0.059 | 0.051 | 0.043 | 0.041 | |
| 50 | 0.226 | 0.144 | 0.107 | 0.079 | 0.065 | 0.055 | 0.047 | 0.037 | 0.035 | 0.031 | |
| 70 | 0.205 | 0.122 | 0.090 | 0.068 | 0.057 | 0.044 | 0.035 | 0.031 | 0.028 | 0.026 | |
| 100 | 0.182 | 0.101 | 0.083 | 0.057 | 0.047 | 0.040 | 0.032 | 0.027 | 0.024 | 0.022 | |
| 200 | 0.152 | 0.078 | 0.062 | 0.044 | 0.035 | 0.027 | 0.023 | 0.018 | 0.016 | 0.015 | |
| 400 | 0.137 | 0.070 | 0.050 | 0.033 | 0.027 | 0.021 | 0.017 | 0.014 | 0.012 | 0.010 | |
| 600 | 0.131 | 0.060 | 0.045 | 0.029 | 0.023 | 0.018 | 0.014 | 0.012 | 0.010 | 0.009 | |
| 800 | 0.121 | 0.060 | 0.040 | 0.029 | 0.021 | 0.017 | 0.013 | 0.011 | 0.009 | 0.008 | |
附表25 研究二平衡设计$\tau _{11}^{2}$大且${{W}_{i}}$为分类变量时线性混合效应模型随机效应估计rbias
| Parameter | I | J | |||||||||
|---|---|---|---|---|---|---|---|---|---|---|---|
| 10 | 20 | 30 | 50 | 70 | 100 | 150 | 200 | 250 | 300 | ||
| 10 | 0.065 | 0.038 | 0.028 | 0.019 | 0.016 | 0.013 | 0.010 | 0.009 | 0.008 | 0.007 | |
| 30 | 0.035 | 0.018 | 0.012 | 0.008 | 0.006 | 0.005 | 0.004 | 0.003 | 0.003 | 0.002 | |
| 50 | 0.026 | 0.013 | 0.009 | 0.005 | 0.004 | 0.003 | 0.002 | 0.002 | 0.002 | 0.002 | |
| 70 | 0.021 | 0.010 | 0.007 | 0.005 | 0.003 | 0.003 | 0.002 | 0.002 | 0.001 | 0.001 | |
| 100 | 0.018 | 0.009 | 0.006 | 0.004 | 0.003 | 0.002 | 0.001 | 0.001 | 0.001 | 0.001 | |
| 200 | 0.013 | 0.006 | 0.004 | 0.002 | 0.002 | 0.001 | 0.001 | 0.001 | 0.001 | 0.001 | |
| 400 | 0.009 | 0.004 | 0.003 | 0.002 | 0.001 | 0.001 | 0.001 | 0.000 | 0.000 | 0.000 | |
| 600 | 0.007 | 0.003 | 0.002 | 0.001 | 0.001 | 0.001 | 0.000 | 0.000 | 0.000 | 0.000 | |
| 800 | 0.006 | 0.003 | 0.002 | 0.001 | 0.001 | 0.001 | 0.000 | 0.000 | 0.000 | 0.000 | |
| 10 | 0.458 | 0.345 | 0.296 | 0.262 | 0.237 | 0.229 | 0.223 | 0.212 | 0.215 | 0.216 | |
| 30 | 0.273 | 0.204 | 0.179 | 0.166 | 0.157 | 0.151 | 0.152 | 0.153 | 0.153 | 0.152 | |
| 50 | 0.214 | 0.182 | 0.162 | 0.156 | 0.145 | 0.146 | 0.151 | 0.149 | 0.147 | 0.147 | |
| 70 | 0.194 | 0.161 | 0.158 | 0.148 | 0.148 | 0.144 | 0.149 | 0.145 | 0.148 | 0.148 | |
| 100 | 0.184 | 0.159 | 0.150 | 0.148 | 0.143 | 0.145 | 0.146 | 0.145 | 0.146 | 0.144 | |
| 200 | 0.150 | 0.147 | 0.147 | 0.148 | 0.148 | 0.143 | 0.148 | 0.146 | 0.148 | 0.145 | |
| 400 | 0.148 | 0.144 | 0.149 | 0.148 | 0.147 | 0.144 | 0.145 | 0.145 | 0.146 | 0.146 | |
| 600 | 0.146 | 0.145 | 0.148 | 0.145 | 0.146 | 0.146 | 0.146 | 0.146 | 0.146 | 0.146 | |
| 800 | 0.148 | 0.145 | 0.145 | 0.144 | 0.145 | 0.146 | 0.145 | 0.146 | 0.146 | 0.146 | |
| 10 | 0.851 | 0.588 | 0.470 | 0.359 | 0.308 | 0.263 | 0.218 | 0.198 | 0.185 | 0.182 | |
| 30 | 0.504 | 0.316 | 0.256 | 0.176 | 0.157 | 0.131 | 0.106 | 0.089 | 0.088 | 0.079 | |
| 50 | 0.394 | 0.249 | 0.194 | 0.141 | 0.115 | 0.097 | 0.083 | 0.068 | 0.062 | 0.056 | |
| 70 | 0.324 | 0.208 | 0.157 | 0.120 | 0.097 | 0.081 | 0.067 | 0.056 | 0.052 | 0.047 | |
| 100 | 0.275 | 0.171 | 0.132 | 0.094 | 0.083 | 0.068 | 0.054 | 0.047 | 0.045 | 0.040 | |
| 200 | 0.195 | 0.124 | 0.090 | 0.072 | 0.057 | 0.047 | 0.038 | 0.033 | 0.030 | 0.028 | |
| 400 | 0.148 | 0.085 | 0.068 | 0.051 | 0.041 | 0.033 | 0.028 | 0.023 | 0.020 | 0.018 | |
| 600 | 0.113 | 0.068 | 0.056 | 0.040 | 0.034 | 0.026 | 0.023 | 0.019 | 0.017 | 0.015 | |
| 800 | 0.097 | 0.059 | 0.047 | 0.034 | 0.028 | 0.024 | 0.019 | 0.016 | 0.015 | 0.013 | |
| 10 | 0.537 | 0.323 | 0.254 | 0.193 | 0.157 | 0.123 | 0.107 | 0.087 | 0.084 | 0.073 | |
| 30 | 0.291 | 0.185 | 0.137 | 0.106 | 0.087 | 0.072 | 0.059 | 0.051 | 0.043 | 0.041 | |
| 50 | 0.226 | 0.144 | 0.107 | 0.079 | 0.065 | 0.055 | 0.047 | 0.037 | 0.035 | 0.031 | |
| 70 | 0.205 | 0.122 | 0.090 | 0.068 | 0.057 | 0.044 | 0.035 | 0.031 | 0.028 | 0.026 | |
| 100 | 0.182 | 0.101 | 0.083 | 0.057 | 0.047 | 0.040 | 0.032 | 0.027 | 0.024 | 0.022 | |
| 200 | 0.152 | 0.078 | 0.062 | 0.044 | 0.035 | 0.027 | 0.023 | 0.018 | 0.016 | 0.015 | |
| 400 | 0.137 | 0.070 | 0.050 | 0.033 | 0.027 | 0.021 | 0.017 | 0.014 | 0.012 | 0.010 | |
| 600 | 0.131 | 0.060 | 0.045 | 0.029 | 0.023 | 0.018 | 0.014 | 0.012 | 0.010 | 0.009 | |
| 800 | 0.121 | 0.060 | 0.040 | 0.029 | 0.021 | 0.017 | 0.013 | 0.011 | 0.009 | 0.008 | |
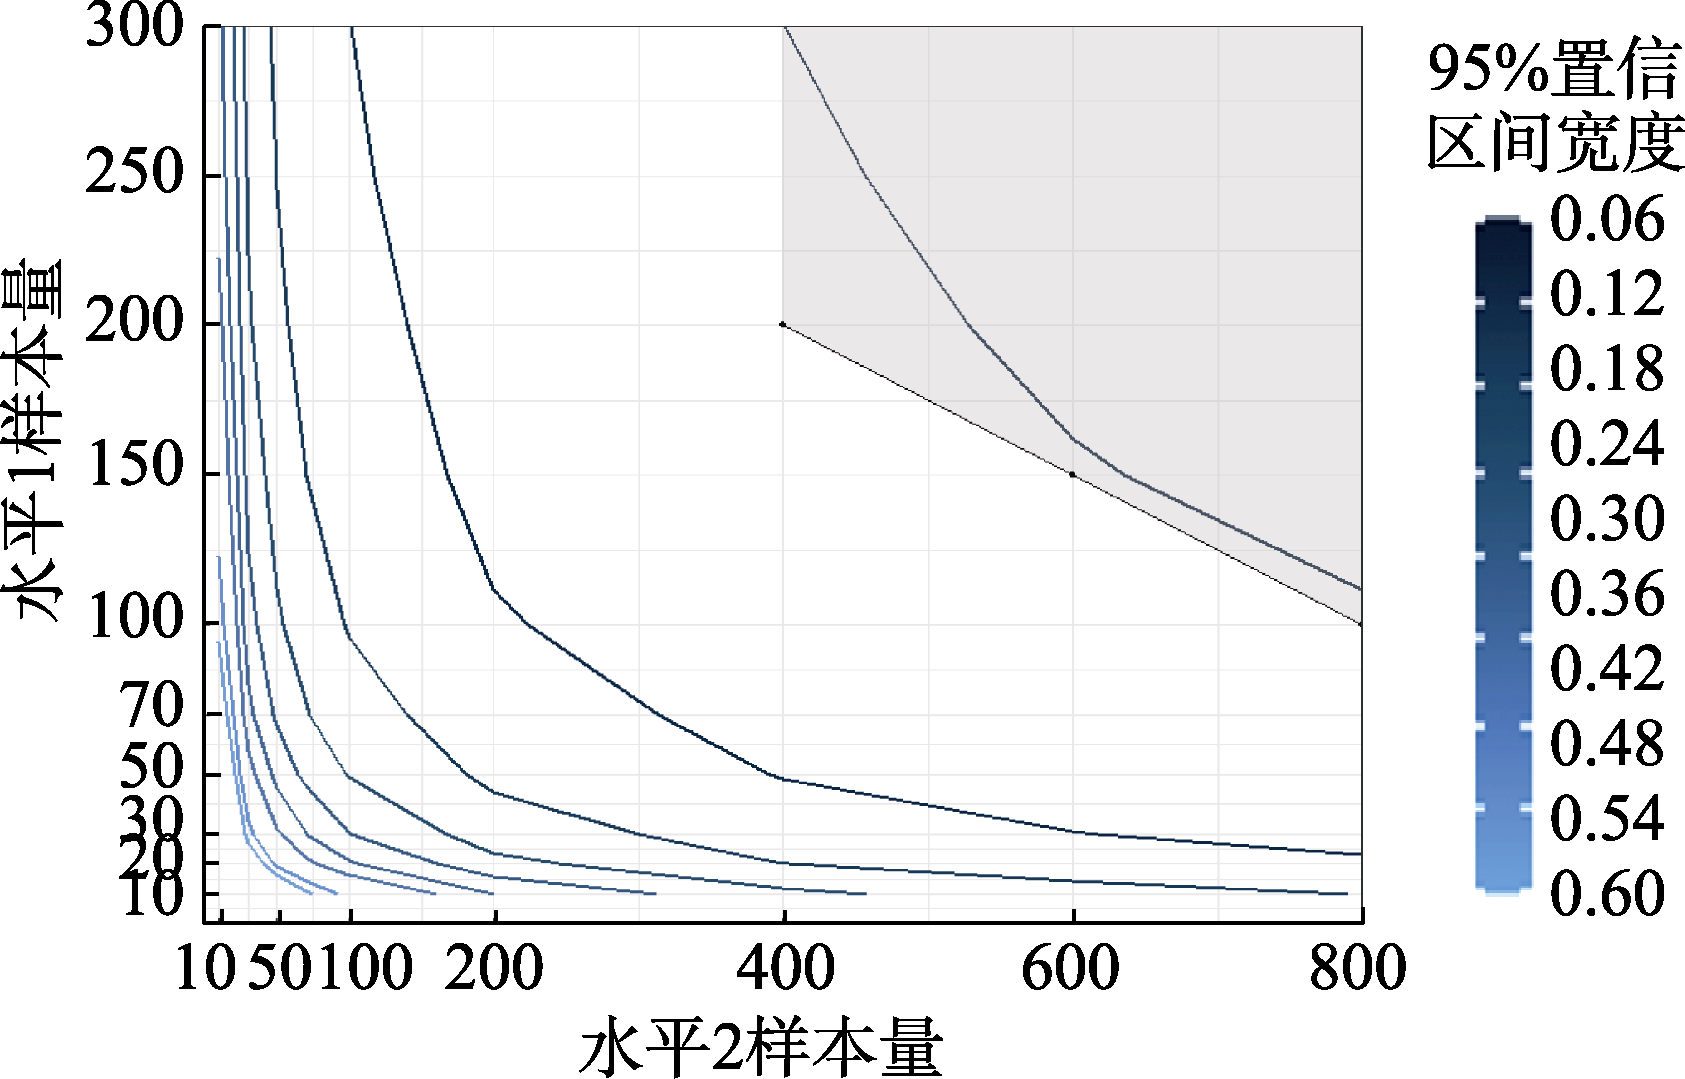
附图4 研究二平衡设计$\tau _{11}^{2}$小且${{W}_{i}}$为分类变量时的检验力 + CI宽度等高线图 注:由于在该情况下符合检验力大于等于0.8并且所有随机效应估计值rbias小于0.1的只有水平1样本量为300,水平2样本量为800的条件,无法呈现阴影区域,因此无法作出检验力+随机效应估计准确性+CI宽度等高线图。

附图5 研究二平衡设计$\tau _{11}^{2}$大且${{W}_{i}}$为分类变量时的检验力 + CI宽度等高线图 注:由于在该情况下没有所有随机效应估计值rbias小于0.1的条件,无法得到同时满足检验力大于等于0.8并且所有随机效应估计值rbias小于0.1的阴影区域,因此无法作出检验力+随机效应估计准确性+CI宽度等高线图。

附图6 研究二非平衡设计$\tau _{11}^{2}$中且${{W}_{i}}$为分类变量时的CI宽度等高线图

附图5 调用线性混合效应模型进行样本量规划函数语句
| [1] |
Arend M. G., & Schäfer T. (2019). Statistical power in two- level models: A tutorial based on monte carlo simulation. Psychological Methods, 24(1), 1-19.
doi: 10.1037/met0000195 URL |
| [2] |
Baker D. H., Vilidaite G., Lygo F. A., Smith A. K., Flack T. R., Gouws A. D., & Andrews T. J. (2021). Power contours: Optimising sample size and precision in experimental psychology and human neuroscience. Psychological Methods, 26(3), 295-314.
doi: 10.1037/met0000337 URL |
| [3] |
Barr D. J., Levy R., Scheepers C., & Tily H. J. (2013). Random effects structure for confirmatory hypothesis testing: Keep it maximal. Journal of Memory and Language, 68(3), 255-278.
doi: 10.1016/j.jml.2012.11.001 URL |
| [4] | Bates D., Maechler M., Bolker B., Walker S., Christensen R. H. B., Singmann H.,... Grothendieck G. (2023). Package ‘lme4’. Linear mixed-effects models using S4 classes. R package version. http://dk.archive.ubuntu.com/pub/pub/cran/web/packages/lme4/lme4.pdf |
| [5] |
Bradley J. V. (1978). Robustness? British Journal of Mathematical and Statistical Psychology, 31(2), 144-152.
doi: 10.1111/bmsp.1978.31.issue-2 URL |
| [6] |
Brauer M., & Curtin J. J. (2018). Linear mixed-effects models and the analysis of nonindependent data: A unified framework to analyze categorical and continuous independent variables that vary within-subjects and/or within-items. Psychological Methods, 23(3), 389-411.
doi: 10.1037/met0000159 pmid: 29172609 |
| [7] |
Cho S. J., de Boeck P., & Lee W. Y. (2017). Evaluating testing, profile likelihood confidence interval estimation, and model comparisons for item covariate effects in linear logistic test models. Applied Psychological Measurement, 41(5), 353-371.
doi: 10.1177/0146621617692078 URL |
| [8] | Cohen J. (1988). Statistical power analysis for the behavioral sciences. Routledge. |
| [9] |
Cohn L. D., & Becker B. J. (2003). How meta-analysis increases statistical power. Psychological Methods, 8(3), 243-253.
doi: 10.1037/1082-989X.8.3.243 pmid: 14596489 |
| [10] |
Green P., & MacLeod C. J. (2016). SIMR: An R package for power analysis of generalized linear mixed models by simulation. Methods in Ecology and Evolution, 7(4), 493-498.
doi: 10.1111/mee3.2016.7.issue-4 URL |
| [11] |
Hecht M., & Zitzmann S. (2021). Sample size recommendations for continuous-time models: Compensating shorter time series with larger numbers of persons and vice versa. Structural Equation Modeling: A Multidisciplinary Journal, 28(2), 229-236.
doi: 10.1080/10705511.2020.1779069 URL |
| [12] | Hox J. J., Moerbeek M., & van de Schoot R. (2017). Multilevel analysis: Techniques and applications. Routledge. |
| [13] |
Jiang Y., Jiang C., Hu T., & Sun H. (2022). Effects of emotion on intertemporal decision-making: Explanation from the single dimension priority model. Acta Psychologica Sinica, 54(2), 122-140.
doi: 10.3724/SP.J.1041.2022.00122 |
|
[ 蒋元萍, 江程铭, 胡天翊, 孙红月. (2022). 情绪对跨期决策的影响: 来自单维占优模型的解释. 心理学报, 54(2), 122-140.]
doi: 10.3724/SP.J.1041.2022.00122 |
|
| [14] |
Judd C. M., Westfall J., & Kenny D. A. (2017). Experiments with more than one random factor: Designs, analytic models, and statistical power. Annual Review of Psychology, 68(1), 601-625.
doi: 10.1146/psych.2017.68.issue-1 URL |
| [15] |
Kelley K., Darku F. B., & Chattopadhyay B. (2018). Accuracy in parameter estimation for a general class of effect sizes: A sequential approach. Psychological Methods, 23(2), 226-243.
doi: 10.1037/met0000127 pmid: 28383948 |
| [16] |
Kelley K., & Rausch J. R. (2006). Sample size planning for the standardized mean difference: Accuracy in parameter estimation via narrow confidence intervals. Psychological Methods, 11(4), 363-385.
pmid: 17154752 |
| [17] |
Koch T., Schultze M., Eid M., & Geiser C. (2014). A longitudinal multilevel CFA-MTMM model for interchangeable and structurally different methods. Frontiers in Psychology, 5, 311. https://doi.org/10.3389/fpsyg.2014.00311
doi: 10.3389/fpsyg.2014.00311 URL pmid: 24860515 |
| [18] |
Kumle L., Võ M. L. H., & Draschkow D. (2021). Estimating power in (generalized) linear mixed models: An open introduction and tutorial in R. Behavior Research Methods, 53(6), 2528-2543.
doi: 10.3758/s13428-021-01546-0 pmid: 33954914 |
| [19] | Lee W. Y. (2018). Generalized linear mixed effect models with crossed random effects for experimental designs having non-repeated items: Model specification and selection (Unpublished doctoral dissertation). Vanderbilt University. |
| [20] |
Maxwell S. E., Kelley K., & Rausch J. R. (2008). Sample size planning for statistical power and accuracy in parameter estimation. Annual Review of Psychology, 59, 537-563.
pmid: 17937603 |
| [21] |
Murayama K., Usami S., & Sakaki M. (2022). Summary- statistics-based power analysis: A new and practical method to determine sample size for mixed-effects modeling. Psychological Methods. 27(6), 1014-1038.
doi: 10.1037/met0000330 pmid: 35099237 |
| [22] |
Nosek B. A., Hardwicke T. E., Moshontz H., Allard A., Corker K. S., Dreber A.,... Vazire S. (2022). Replicability, robustness, and reproducibility in psychological science. Annual Review of Psychology, 73, 719-748.
doi: 10.1146/psych.2022.73.issue-1 URL |
| [23] |
Park J., & Pek J. (2023). Conducting Bayesian-classical hybrid power analysis with R package hybridpower. Multivariate Behavioral Research, 58(3), 543-559.
doi: 10.1080/00273171.2022.2038056 URL |
| [24] |
Pek J., & Park J. (2019). Complexities in power analysis: Quantifying uncertainties with a Bayesian-classical hybrid approach. Psychological Methods, 24(5), 590-605.
doi: 10.1037/met0000208 pmid: 30816728 |
| [25] | R Development Core Team. (2020). R: A language and environment for statistical computing [Computer software Manual]. Vienna, Austria. https://www.r-project.org/ |
| [26] |
Rights J. D., & Sterba S. K. (2019). Quantifying explained variance in multilevel models: An integrative framework for defining R-squared measures. Psychological Methods, 24(3), 309-338.
doi: 10.1037/met0000184 pmid: 29999378 |
| [27] |
Schultzberg M., & Muthén B. (2018). Number of subjects and time points needed for multilevel time-series analysis: A simulation study of dynamic structural equation modeling. Structural Equation Modeling: A Multidisciplinary Journal, 25(4), 495-515.
doi: 10.1080/10705511.2017.1392862 URL |
| [28] | Usami S. (2020). Confidence interval-based sample size determination formulas and some mathematical properties for hierarchical data. British Journal of Mathematical and Statistical Psychology, 73(S1), 1-31. |
| [29] |
Wasserstein R. L., & Lazar N. A. (2016). The ASA statement on p-values: Context, process, and purpose. The American Statistician, 70(2), 129-133.
doi: 10.1080/00031305.2016.1154108 URL |
| [30] |
Williams D. R., Mulder J., Rouder J. N., & Rast P. (2021). Beneath the surface: Unearthing within-person variability and mean relations with Bayesian mixed models. Psychological Methods, 26(1), 74-89.
doi: 10.1037/met0000270 URL |
| [31] |
Xu L., Becker B., Luo R., Zheng X., Zhao W., Zhang Q., & Kendrick K. M. (2020). Oxytocin amplifies sex differences in human mate choice. Psychoneuroendocrinology, 112, 104483. https://doi.org/10.1016/j.psyneuen.2019.104483
doi: 10.1016/j.psyneuen.2019.104483 URL |
| [32] |
Zhang Z. (2014). Monte Carlo based statistical power analysis for mediation models: Methods and software. Behavior Research Methods, 46(4), 1184-1198.
doi: 10.3758/s13428-013-0424-0 pmid: 24338601 |
| [1] | 刘红云, 袁克海, 甘凯宇. 有中介的调节模型的拓展及其效应量[J]. 心理学报, 2021, 53(3): 322-336. |
| [2] | 温忠麟;范息涛;叶宝娟;陈宇帅. 从效应量应有的性质看中介效应量的合理性[J]. 心理学报, 2016, 48(4): 435-443. |
| [3] | Roger A. Dixon, Cindy M. de Frias. 老年人记忆补偿的长期稳定性和变异性:来自维多利亚纵向研究的证据[J]. 心理学报, 2009, 41(11): 1091-1101. |
| [4] | 刘红云,骆方. 多水平项目反应理论模型在测验发展中的应用[J]. 心理学报, 2008, 40(01): 92-100. |
| 阅读次数 | ||||||
|
全文 |
|
|||||
|
摘要 |
|
|||||