ISSN 0439-755X
CN 11-1911/B
主办:中国心理学会
中国科学院心理研究所
出版:科学出版社
CN 11-1911/B
主办:中国心理学会
中国科学院心理研究所
出版:科学出版社
心理学报 ›› 2024, Vol. 56 ›› Issue (9): 1299-1312.doi: 10.3724/SP.J.1041.2024.01299 cstr: 32110.14.2024.01299
• 亲社会行为专刊(1) • 上一篇
吴小燕1, 付洪宇1, 张腾飞1, 鲍东琪2, 胡捷3, 朱睿达4, 封春亮5, 古若雷6,7, 刘超1( )
)
收稿日期:2023-10-14
发布日期:2024-06-25
出版日期:2024-09-25
通讯作者:
刘超, E-mail: liuchao@bnu.edu.cn基金资助:
WU Xiaoyan1, FU Hongyu1, ZHANG Tengfei1, BAO Dongqi2, HU Jie3, ZHU Ruida4, FENG Chunliang5, GU Ruolei6,7, LIU Chao1()
Received:2023-10-14
Online:2024-06-25
Published:2024-09-25
摘要:
在社会互动中, 人们常表现出有条件的合作行为, 即只有在预期他人也合作时人们才愿意合作。当前该过程的认知机制尚不明确。本文采用多回合版本的囚徒困境范式, 两项实验均表明个体的合作行为随合作者合作行为的提高而提高。认知计算模型显示个体同时采用了一阶信念(只根据他人过去的行为)与二阶信念(既根据他人过去的行为, 也考虑自己的行为对他人产生的影响)去更新他们对合作者的合作概率的期望。结果显示个体的有条件合作行为的提升由积极期望(即合作成功使得个体对合作者建立了积极的期望)与社会奖赏(由合作本身带来的额外奖励)共同驱动。这些结果揭示了有条件的合作行为的计算认知学习机制, 阐明了积极期望和社会奖赏对合作的促进作用, 能为社会中各领域合作的成功推动提供了重要的科学证据与参考价值。
中图分类号:
吴小燕, 付洪宇, 张腾飞, 鲍东琪, 胡捷, 朱睿达, 封春亮, 古若雷, 刘超. (2024). 共赢促进合作的认知计算机制: 互惠中积极期望与社会奖赏的作用. 心理学报, 56(9), 1299-1312.
WU Xiaoyan, FU Hongyu, ZHANG Tengfei, BAO Dongqi, HU Jie, ZHU Ruida, FENG Chunliang, GU Ruolei, LIU Chao. (2024). A cognitive computational mechanism for mutual cooperation: The roles of positive expectation and social reward. Acta Psychologica Sinica, 56(9), 1299-1312.

图1 实验范式与实验1行为数据分析结果。a. 单个试次展示。上图和下图分别展示社会和非社会条件下的单个试次展示。b. 实验1合作者的合作概率设置。c-d. 实验1行为数据分析结果。c. 横坐标为自变量, 纵坐标为各个自变量解释被试行为决策的效应量(beta值)。d. 左图展示情景×概率的交互作用; 右图展示在社会条件(高概率减去低概率)和非社会条件(高概率减去低概率)中被试合作概率差值。右图的跨过条形图上的每根线条表示每位被试的数据。***表示p < 0.001; ns. 表示统计上未显著, 即p值 > 0.05。彩图见电子版, 下同。

图2 实验1模型比较与模型变量分析结果。a. 模型比较。横坐标为各个模型(详见方法部分), 纵坐标为Bayesian Information Criterion (BIC)值, 其计算公式为BIC = k·ln(n) − 2 ln(L)。在社会条件(黄色条形)和非社会条件(蓝色条形), 被试的行为均由模型6解释得最好, protected exceedance probability (PEP, Rigoux et al., 2014) 显示模型6相比于其他所有模型在群体上可能是最优模型的概率大于98%。b. 模型恢复(model recovery)。模型6所产生的数据由模型6最好地解释得概率为0.79。c. 被试数据与最优模型预测的吻合度。横坐标为试次数, 纵坐标为被试的平均合作概率。蓝色实线表示被试的真实选择, 黑色实线表示最优模型的预测均值, 阴影部分为模型预测的合作率的95%的置信区间。这里仅展示单个子条件(非社会条件下合作者的行为从变动到稳定的情况下)的数据, 所有条件的模型预测吻合度比对图请见网络版附图1。d-e. 从最优模型中得到的社会奖赏(ω, social reward)和预期(p, expectation)的参数值的分析统计结果。***表示p < 0.001。

图3 实验2行为数据与模型变量分析结果。a. 实验2合作者的合作概率设置。b. 实验2被试的行为决策分析结果。c. 模型比较。d. 被试合作概率的统计分析结果。e & f 分别展示社会奖赏和预期的统计分析结果。***表示p < 0.001。

附图1 实验1模型预测。左侧图片展示了社会条件下被试的合作概率(黄色实线)和最优模型预测合作概率(黑色实线)。右侧图片展示非社会条件下被试的合作概率(蓝色实线)和最优模型的预测合作概率(黑色实线)。阴影部分展示模型预测的合作概率的95%的置信区间。横坐标为试次数, 纵坐标为p (cooperation)表示所有被试的平均合作概率。上图和下图分别表示不同的顺序, 上图为伙伴的合作概率从高概率到低概率而下图为伙伴的合作概率从低概率到高概率。

附图2 参数恢复(parameter recovery)。a-g为实验1的参数恢复, h-n为实验2的参数恢复。图中每个点代表每个被试, 线条为线性拟合, 阴影部分为95%的置信区间。r值为皮尔逊相关系数。

附图3 实验1被试对合作者的合作概率的动态期望。左图右图分别展示在社会条件(黄色实线)和非社会条件(蓝色实线)下, 被试对合作者的合作概率的动态期望变化。黑色虚线表示合作者的真实合作概率。上下图片表示不同的顺序, 分别是合作者的行为从高概率转为低概率, 以及从低概率转为高概率。
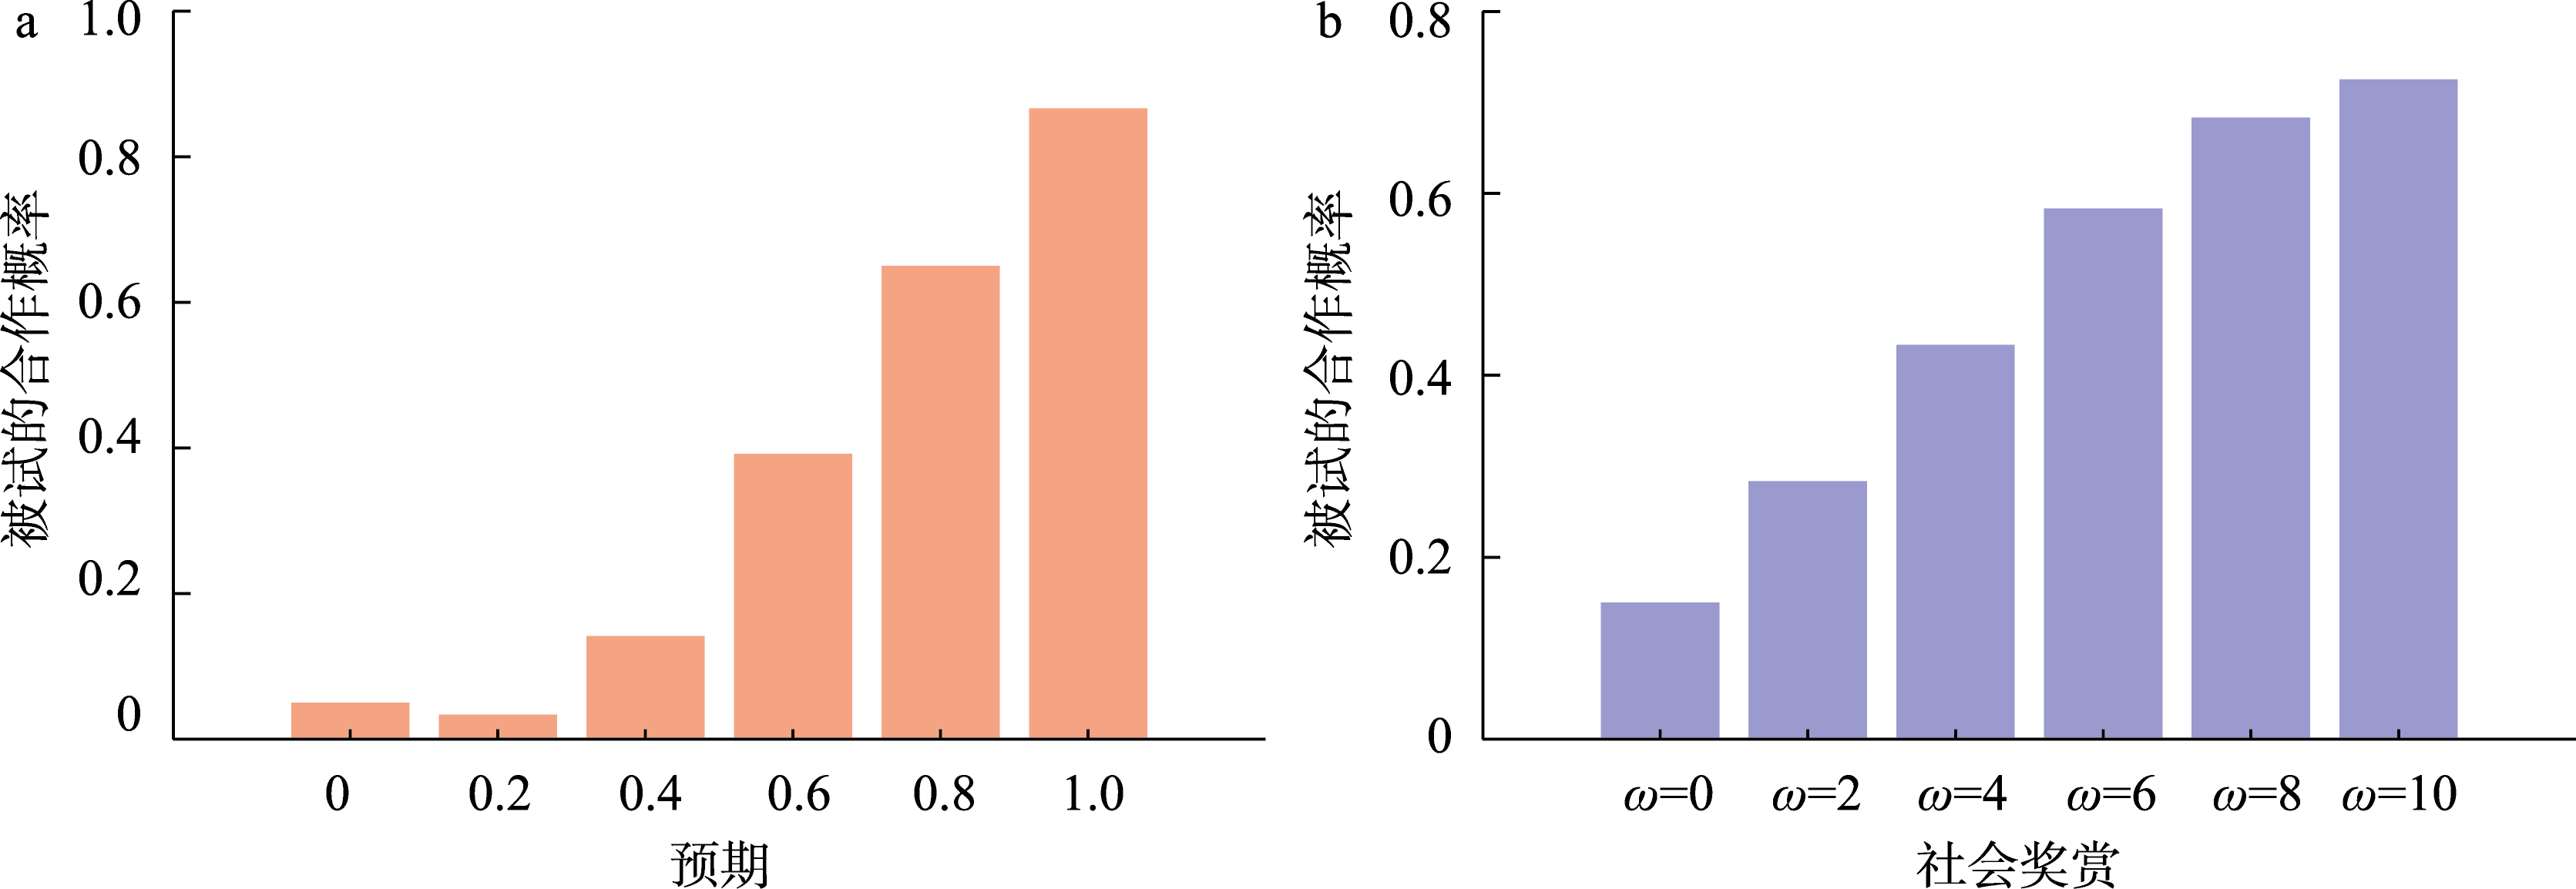
附图4 模拟分析。图a展示预期从低(左)倒高(右)的变化对个体合作行为的提升。图b展示社会奖赏从小(左)到大(右)对个体合作行为的提升。

附图5 实验1的社会奖赏与亲社会人格相关性分析。横轴代表个体在社会价值取向问卷上的得分, 得分较低表示个体更加自利, 不太考虑他人利益, 而得分较高则表明个体更加利他。纵轴显示了优选模型中的社会奖赏参数值, 左图(右图)展示的是在社会(非社会)条件下个体的社会奖赏参数值。通过皮尔逊相关分析探究了二者之间的关系。图中, 每个灰色点代表一名被试在这两个维度上的数据, 蓝色线表示二者之间的线性关系拟合。

附图6 实验2被试对合作者的合作概率的动态期望。左侧图片展示了社会条件下被试的合作概率(黄色实线)和最优模型预测合作概率(黑色实线)。右侧图片展示非社会条件下被试的合作概率(蓝色实线)和最优模型的预测合作概率(黑色实线)。阴影部分展示模型预测的合作概率的95%的置信区间。横坐标为试次数, 纵坐标为p (cooperation)表示所有被试的平均合作概率。上图和下图分别表示不同子条件, 第一行和第二行的图片为伙伴的合作行为为低概率(low probability), 第三行和第四行的图片为伙伴的合作行为为高概率(high probability)。第1行和第3行为先稳定再变动(stable-volatile), 而第2行和第4行为伙伴的合作概率先变动再稳定(volatile-stable)。

附图7 实验2被试对合作者的合作概率的期望的动态更新过程。左右图分别展示在社会条件(黄色实线)和非社会条件(蓝色实线)下被试对合作者的合作概率的动态期望变化。黑色虚线表示合作者的真实合作概率。社会条件和非社会条件纵向的四张图片分别代表不同的实验子条件, 从上至下分别为低概率−先稳定再变动、低概率−先稳定再变动、高概率−先稳定再变动、高概率−先变动再稳定。
| Model | Task | Number of parameters | Mean BIC | PEP |
|---|---|---|---|---|
| Model 1 | Social | 1 | 151.19 | 0.00% |
| Model 2 | Social | 2 | 152.85 | 0.00% |
| Model 3 | Social | 1 | 156.37 | 0.00% |
| Model 4 | Social | 3 | 147.46 | 0.00% |
| Model 5 | Social | 5 | 137.59 | 0.00% |
| Model 6 | Social | 7 | 128.32 | 100.00% |
| Model 1 | Non-social | 1 | 115.94 | 0.00% |
| Model 2 | Non-social | 2 | 111.72 | 0.07% |
| Model 3 | Non-social | 1 | 117.38 | 0.00% |
| Model 4 | Non-social | 3 | 116.21 | 0.00% |
| Model 5 | Non-social | 5 | 108.00 | 0.00% |
| Model 6 | Non-social | 7 | 100.83 | 93.00% |
附表1: 实验1的模型比较
| Model | Task | Number of parameters | Mean BIC | PEP |
|---|---|---|---|---|
| Model 1 | Social | 1 | 151.19 | 0.00% |
| Model 2 | Social | 2 | 152.85 | 0.00% |
| Model 3 | Social | 1 | 156.37 | 0.00% |
| Model 4 | Social | 3 | 147.46 | 0.00% |
| Model 5 | Social | 5 | 137.59 | 0.00% |
| Model 6 | Social | 7 | 128.32 | 100.00% |
| Model 1 | Non-social | 1 | 115.94 | 0.00% |
| Model 2 | Non-social | 2 | 111.72 | 0.07% |
| Model 3 | Non-social | 1 | 117.38 | 0.00% |
| Model 4 | Non-social | 3 | 116.21 | 0.00% |
| Model 5 | Non-social | 5 | 108.00 | 0.00% |
| Model 6 | Non-social | 7 | 100.83 | 93.00% |
| scenario | parameter | Mean ± SD | ||
|---|---|---|---|---|
| Experiment 1 | social | αhigh | 0.23 ± 0.27 (95% CI = 0.18, 0.27) | |
| αlow | 0.26 ± 0.24 (95% CI = 0.22, 0.30) | |||
| κhigh | 0.33 ± 0.28 (95% CI = 0.28, 0.38) | |||
| κlow | 0.37 ± 0.21 (95% CI = 0.34, 0.41) | |||
| ωhigh | 4.57 ± 1.97 (95% CI = 4.24, 4.90) | |||
| ωlow | 3.19 ± 1.38 (95% CI = 2.96, 3.42) | |||
| β | 1.93 ± 2.05 (95% CI = 1.59, 2.28) | |||
| nonsocial | αhigh | 0.32 ± 0.25 (95% CI = 0.28, 0.36) | ||
| αlow | 0.31 ± 0.22 (95% CI = 0.28, 0.35) | |||
| κhigh | 0.34 ± 0.25 (95% CI = 0.30, 0.38) | |||
| κlow | 0.30 ± 0.22 (95% CI = 0.27, 0.34) | |||
| ωhigh | 2.83 ± 1.80 (95% CI = 2.53, 3.13) | |||
| ωlow | 3.12 ± 1.57 (95% CI = 2.85, 3.38) | |||
| β | 3.03 ± 2.69 (95% CI = 2.58, 3.49) | |||
| Experiment 2 | High probability group | social | αstable | 0.43 ± 0.27 (95% CI = 0.35, 0.50) |
| αvolatile | 0.43 ± 0.25 (95% CI = 0.37, 0.50) | |||
| κstable | 0.24 ± 0.21 (95% CI = 0.18, 0.30) | |||
| κvolatile | 0.28 ± 0.23 (95% CI = 0.22, 0.34) | |||
| ωstable | 4.32 ± 1.65 (95% CI = 3.87, 4.76) | |||
| ωvolatile | 4.38 ± 1.48 (95% CI = 3.98, 4.78) | |||
| β | 2.33 ± 2.05 (95% CI = 1.77, 2.89) | |||
| nonsocial | αstable | 0.35 ± 0.25 (95% CI = 0.29, 0.42) | ||
| αvolatile | 0.35 ± 0.25 (95% CI = 0.28, 0.42) | |||
| κstable | 0.29 ± 0.22 (95% CI = 0.23, 0.35) | |||
| κvolatile | 0.28 ± 0.21 (95% CI = 0.23, 0.34) | |||
| ωstable | 3.55 ± 1.33 (95% CI = 3.19, 3.91) | |||
| ωvolatile | 3.72 ± 1.39 (95% CI = 3.34, 4.09) | |||
| β | 2.32 ± 1.00 (95% CI = 2.04, 2.59) | |||
| Low probability group | social | αstable | 0.37 ± 0.25 (95% CI = 0.30, 0.44) | |
| αvolatile | 0.40 ± 0.19 (95% CI = 0.34, 0.45) | |||
| κstable | 0.30 ± 0.22 (95% CI = 0.24, 0.36) | |||
| κvolatile | 0.27 ± 0.19 (95% CI = 0.22, 0.32) | |||
| ωstable | 3.70 ± 0.94 (95% CI = 3.44, 3.95) | |||
| ωvolatile | 3.92 ± 0.93 (95% CI = 3.67, 4.17) | |||
| β | 1.93 ± 0.89 (95% CI = 1.69, 2.18) | |||
| nonsocial | αstable | 0.30 ± 0.22 (95% CI = 0.24, 0.36) | ||
| αvolatile | 0.33 ± 0.23 (95% CI = 0.27, 0.39) | |||
| κstable | 0.33 ± 0.24 (95% CI = 0.26, 0.39) | |||
| κvolatile | 0.30 ± 0.19 (95% CI = 0.24, 0.35) | |||
| ωstable | 3.05 ± 1.42 (95% CI = 2.66, 3.43) | |||
| ωvolatile | 2.99 ± 1.46 (95% CI = 2.59, 3.39) | |||
| β | 2.41 ± 1.89 (95% CI = 1.90, 2.92) | |||
附表2: 最优模型的自由参数
| scenario | parameter | Mean ± SD | ||
|---|---|---|---|---|
| Experiment 1 | social | αhigh | 0.23 ± 0.27 (95% CI = 0.18, 0.27) | |
| αlow | 0.26 ± 0.24 (95% CI = 0.22, 0.30) | |||
| κhigh | 0.33 ± 0.28 (95% CI = 0.28, 0.38) | |||
| κlow | 0.37 ± 0.21 (95% CI = 0.34, 0.41) | |||
| ωhigh | 4.57 ± 1.97 (95% CI = 4.24, 4.90) | |||
| ωlow | 3.19 ± 1.38 (95% CI = 2.96, 3.42) | |||
| β | 1.93 ± 2.05 (95% CI = 1.59, 2.28) | |||
| nonsocial | αhigh | 0.32 ± 0.25 (95% CI = 0.28, 0.36) | ||
| αlow | 0.31 ± 0.22 (95% CI = 0.28, 0.35) | |||
| κhigh | 0.34 ± 0.25 (95% CI = 0.30, 0.38) | |||
| κlow | 0.30 ± 0.22 (95% CI = 0.27, 0.34) | |||
| ωhigh | 2.83 ± 1.80 (95% CI = 2.53, 3.13) | |||
| ωlow | 3.12 ± 1.57 (95% CI = 2.85, 3.38) | |||
| β | 3.03 ± 2.69 (95% CI = 2.58, 3.49) | |||
| Experiment 2 | High probability group | social | αstable | 0.43 ± 0.27 (95% CI = 0.35, 0.50) |
| αvolatile | 0.43 ± 0.25 (95% CI = 0.37, 0.50) | |||
| κstable | 0.24 ± 0.21 (95% CI = 0.18, 0.30) | |||
| κvolatile | 0.28 ± 0.23 (95% CI = 0.22, 0.34) | |||
| ωstable | 4.32 ± 1.65 (95% CI = 3.87, 4.76) | |||
| ωvolatile | 4.38 ± 1.48 (95% CI = 3.98, 4.78) | |||
| β | 2.33 ± 2.05 (95% CI = 1.77, 2.89) | |||
| nonsocial | αstable | 0.35 ± 0.25 (95% CI = 0.29, 0.42) | ||
| αvolatile | 0.35 ± 0.25 (95% CI = 0.28, 0.42) | |||
| κstable | 0.29 ± 0.22 (95% CI = 0.23, 0.35) | |||
| κvolatile | 0.28 ± 0.21 (95% CI = 0.23, 0.34) | |||
| ωstable | 3.55 ± 1.33 (95% CI = 3.19, 3.91) | |||
| ωvolatile | 3.72 ± 1.39 (95% CI = 3.34, 4.09) | |||
| β | 2.32 ± 1.00 (95% CI = 2.04, 2.59) | |||
| Low probability group | social | αstable | 0.37 ± 0.25 (95% CI = 0.30, 0.44) | |
| αvolatile | 0.40 ± 0.19 (95% CI = 0.34, 0.45) | |||
| κstable | 0.30 ± 0.22 (95% CI = 0.24, 0.36) | |||
| κvolatile | 0.27 ± 0.19 (95% CI = 0.22, 0.32) | |||
| ωstable | 3.70 ± 0.94 (95% CI = 3.44, 3.95) | |||
| ωvolatile | 3.92 ± 0.93 (95% CI = 3.67, 4.17) | |||
| β | 1.93 ± 0.89 (95% CI = 1.69, 2.18) | |||
| nonsocial | αstable | 0.30 ± 0.22 (95% CI = 0.24, 0.36) | ||
| αvolatile | 0.33 ± 0.23 (95% CI = 0.27, 0.39) | |||
| κstable | 0.33 ± 0.24 (95% CI = 0.26, 0.39) | |||
| κvolatile | 0.30 ± 0.19 (95% CI = 0.24, 0.35) | |||
| ωstable | 3.05 ± 1.42 (95% CI = 2.66, 3.43) | |||
| ωvolatile | 2.99 ± 1.46 (95% CI = 2.59, 3.39) | |||
| β | 2.41 ± 1.89 (95% CI = 1.90, 2.92) | |||
| Fixed effects | Estimated beta value | SE | t value | p value |
|---|---|---|---|---|
| (Intercept) | −1.43 | 0.43 | −3.32 | p < 0.001 |
| cooperation probability | −0.24 | 0.06 | −3.83 | p < 0.001 |
| order | 0.002 | 0.08 | 0.02 | p = 0.983 |
| subject’s choice t-1 | 1.38 | 0.03 | 43.04 | p < 0.001 |
| subject’s choice t-2 | 0.63 | 0.03 | 18.60 | p < 0.001 |
| subject’s choice t-3 | 0.22 | 0.03 | 6.62 | p < 0.001 |
| partner’s choice t-1 | 0.50 | 0.03 | 15.64 | p < 0.001 |
| partner’s choice t-2 | 0.05 | 0.03 | 1.69 | p = 0.090 |
| partner’s choice t-3 | −0.05 | 0.03 | −1.49 | p = 0.136 |
| scenario | 1.19 | 0.09 | 12.68 | p < 0.001 |
| gender | −0.15 | 0.08 | −1.78 | p = 0.076 |
| age | −0.03 | 0.02 | −1.52 | p = 0.128 |
| cooperation probability ×scemario | −0.52 | 0.06 | −8.20 | p < 0.001 |
附表3: 实验1中以被试选择为因变量的广义线性混合模型效应
| Fixed effects | Estimated beta value | SE | t value | p value |
|---|---|---|---|---|
| (Intercept) | −1.43 | 0.43 | −3.32 | p < 0.001 |
| cooperation probability | −0.24 | 0.06 | −3.83 | p < 0.001 |
| order | 0.002 | 0.08 | 0.02 | p = 0.983 |
| subject’s choice t-1 | 1.38 | 0.03 | 43.04 | p < 0.001 |
| subject’s choice t-2 | 0.63 | 0.03 | 18.60 | p < 0.001 |
| subject’s choice t-3 | 0.22 | 0.03 | 6.62 | p < 0.001 |
| partner’s choice t-1 | 0.50 | 0.03 | 15.64 | p < 0.001 |
| partner’s choice t-2 | 0.05 | 0.03 | 1.69 | p = 0.090 |
| partner’s choice t-3 | −0.05 | 0.03 | −1.49 | p = 0.136 |
| scenario | 1.19 | 0.09 | 12.68 | p < 0.001 |
| gender | −0.15 | 0.08 | −1.78 | p = 0.076 |
| age | −0.03 | 0.02 | −1.52 | p = 0.128 |
| cooperation probability ×scemario | −0.52 | 0.06 | −8.20 | p < 0.001 |
| Fixed effects | Estimated beta value | SE | t value | p value |
|---|---|---|---|---|
| (Intercept) | 3.91 | 0.76 | 5.11 | p < 0.001 |
| cooperation probability | 0.28 | 0.17 | 1.65 | p = 0.100 |
| order | 0.06 | 0.14 | 0.43 | p = 0.668 |
| scenario | 1.70 | 0.17 | 10.13 | p < 0.001 |
| gender | −0.28 | 0.17 | −1.71 | p = 0.088 |
| age | −0.04 | 0.04 | −1.21 | p = 0.226 |
| cooperation probability ×scemario | −1.67 | 0.22 | −7.68 | p < 0.001 |
附表4: 实验1中以社会奖赏为因变量的线性混合模型效应
| Fixed effects | Estimated beta value | SE | t value | p value |
|---|---|---|---|---|
| (Intercept) | 3.91 | 0.76 | 5.11 | p < 0.001 |
| cooperation probability | 0.28 | 0.17 | 1.65 | p = 0.100 |
| order | 0.06 | 0.14 | 0.43 | p = 0.668 |
| scenario | 1.70 | 0.17 | 10.13 | p < 0.001 |
| gender | −0.28 | 0.17 | −1.71 | p = 0.088 |
| age | −0.04 | 0.04 | −1.21 | p = 0.226 |
| cooperation probability ×scemario | −1.67 | 0.22 | −7.68 | p < 0.001 |
| Fixed effects | Estimated beta value | SE | t value | p value |
|---|---|---|---|---|
| (Intercept) | 0.18 | 0.08 | 2.24 | p = 0.025 |
| cooperation probability | −0.03 | 0.01 | −2.43 | p = 0.015 |
| order | 0.02 | 0.02 | 0.91 | p = 0.365 |
| subject's choice t-1 | 0.07 | 0.003 | 22.03 | p < 0.001 |
| subject’s choice t-2 | 0.04 | 0.004 | 12.16 | p < 0.001 |
| subject’s choice t-3 | 0.03 | 0.003 | 9.11 | p < 0.001 |
| partner’s choice t-1 | 0.22 | 0.003 | 77.03 | p < 0.001 |
| partner’s choice t-2 | 0.06 | 0.003 | 20.13 | p < 0.001 |
| partner’s choice t-3 | 0.04 | 0.003 | 12.54 | p < 0.001 |
| scenario | 0.20 | 0.02 | 10.86 | p < 0.001 |
| gender | −0.002 | 0.02 | −0.10 | p = 0.919 |
| age | −0.001 | 0.003 | −0.50 | p = 0.619 |
| cooperation probability ×scemario | −0.17 | 0.01 | −30.63 | p < 0.001 |
附表5: 实验1中以期望为因变量的线性混合模型效应
| Fixed effects | Estimated beta value | SE | t value | p value |
|---|---|---|---|---|
| (Intercept) | 0.18 | 0.08 | 2.24 | p = 0.025 |
| cooperation probability | −0.03 | 0.01 | −2.43 | p = 0.015 |
| order | 0.02 | 0.02 | 0.91 | p = 0.365 |
| subject's choice t-1 | 0.07 | 0.003 | 22.03 | p < 0.001 |
| subject’s choice t-2 | 0.04 | 0.004 | 12.16 | p < 0.001 |
| subject’s choice t-3 | 0.03 | 0.003 | 9.11 | p < 0.001 |
| partner’s choice t-1 | 0.22 | 0.003 | 77.03 | p < 0.001 |
| partner’s choice t-2 | 0.06 | 0.003 | 20.13 | p < 0.001 |
| partner’s choice t-3 | 0.04 | 0.003 | 12.54 | p < 0.001 |
| scenario | 0.20 | 0.02 | 10.86 | p < 0.001 |
| gender | −0.002 | 0.02 | −0.10 | p = 0.919 |
| age | −0.001 | 0.003 | −0.50 | p = 0.619 |
| cooperation probability ×scemario | −0.17 | 0.01 | −30.63 | p < 0.001 |
| Model | Task | Number of parameters | Mean BIC | PEP |
|---|---|---|---|---|
| Model 1 | Social | 1 | 194.80 | 0.00% |
| Model 2 | Social | 2 | 196.59 | 0.00% |
| Model 3 | Social | 1 | 220.54 | 0.00% |
| Model 4 | Social | 3 | 151.31 | 0.00% |
| Model 5 | Social | 5 | 201.36 | 0.02% |
| Model 6 | Social | 7 | 140.21 | 98.00% |
| Model 1 | Non-social | 1 | 170.76 | 0.00% |
| Model 2 | Non-social | 2 | 164.91 | 0.00% |
| Model 3 | Non-social | 1 | 179.03 | 0.00% |
| Model 4 | Non-social | 3 | 173.86 | 0.00% |
| Model 5 | Non-social | 5 | 144.67 | 0.00% |
| Model 6 | Non-social | 7 | 133.30 | 100.00% |
附表6: 实验2的模型比较
| Model | Task | Number of parameters | Mean BIC | PEP |
|---|---|---|---|---|
| Model 1 | Social | 1 | 194.80 | 0.00% |
| Model 2 | Social | 2 | 196.59 | 0.00% |
| Model 3 | Social | 1 | 220.54 | 0.00% |
| Model 4 | Social | 3 | 151.31 | 0.00% |
| Model 5 | Social | 5 | 201.36 | 0.02% |
| Model 6 | Social | 7 | 140.21 | 98.00% |
| Model 1 | Non-social | 1 | 170.76 | 0.00% |
| Model 2 | Non-social | 2 | 164.91 | 0.00% |
| Model 3 | Non-social | 1 | 179.03 | 0.00% |
| Model 4 | Non-social | 3 | 173.86 | 0.00% |
| Model 5 | Non-social | 5 | 144.67 | 0.00% |
| Model 6 | Non-social | 7 | 133.30 | 100.00% |
| Fixed effects | Estimated beta value | SE | t value | p value |
|---|---|---|---|---|
| (Intercept) | −2.58 | 0.48 | −5.37 | p < 0.001 |
| cooperation probability | 0.53 | 0.21 | 2.53 | p = 0.011 |
| volatility | −0.12 | 0.08 | −1.36 | p = 0.174 |
| order | 0.07 | 0.11 | 0.68 | p = 0.498 |
| subject’s choice t-1 | 1.69 | 0.04 | 44.06 | p < 0.001 |
| subject’s choice t-2 | 0.65 | 0.04 | 16.19 | p < 0.001 |
| subject’s choice t-3 | 0.26 | 0.04 | 6.98 | p < 0.001 |
| partner’s choice t-1 | 2.22 | 0.04 | 60.64 | p < 0.001 |
| partner’s choice t-2 | 0.33 | 0.04 | 8.90 | p < 0.001 |
| partner’s choice t-3 | 0.01 | 0.04 | 0.23 | p = 0.819 |
| scenario | 1.20 | 0.15 | 8.07 | p < 0.001 |
| gender | −0.12 | 0.11 | −1.14 | p = 0.253 |
| age | −0.05 | 0.02 | −2.59 | p = 0.010 |
| cooperation probability×volatility | 0.16 | 0.12 | 1.31 | p = 0.192 |
| cooperation probability×scenario | 0.89 | 0.21 | −4.21 | p < 0.001 |
| volatility×scenario | 0.22 | 0.09 | 2.39 | p = 0.017 |
| cooperation probability×volatility×scenario | −0.17 | 0.13 | −1.32 | p = 0.187 |
附表7: 实验2中以被试选择为因变量的广义线性混合模型效应
| Fixed effects | Estimated beta value | SE | t value | p value |
|---|---|---|---|---|
| (Intercept) | −2.58 | 0.48 | −5.37 | p < 0.001 |
| cooperation probability | 0.53 | 0.21 | 2.53 | p = 0.011 |
| volatility | −0.12 | 0.08 | −1.36 | p = 0.174 |
| order | 0.07 | 0.11 | 0.68 | p = 0.498 |
| subject’s choice t-1 | 1.69 | 0.04 | 44.06 | p < 0.001 |
| subject’s choice t-2 | 0.65 | 0.04 | 16.19 | p < 0.001 |
| subject’s choice t-3 | 0.26 | 0.04 | 6.98 | p < 0.001 |
| partner’s choice t-1 | 2.22 | 0.04 | 60.64 | p < 0.001 |
| partner’s choice t-2 | 0.33 | 0.04 | 8.90 | p < 0.001 |
| partner’s choice t-3 | 0.01 | 0.04 | 0.23 | p = 0.819 |
| scenario | 1.20 | 0.15 | 8.07 | p < 0.001 |
| gender | −0.12 | 0.11 | −1.14 | p = 0.253 |
| age | −0.05 | 0.02 | −2.59 | p = 0.010 |
| cooperation probability×volatility | 0.16 | 0.12 | 1.31 | p = 0.192 |
| cooperation probability×scenario | 0.89 | 0.21 | −4.21 | p < 0.001 |
| volatility×scenario | 0.22 | 0.09 | 2.39 | p = 0.017 |
| cooperation probability×volatility×scenario | −0.17 | 0.13 | −1.32 | p = 0.187 |
| Fixed effects | Estimated beta value | SE | t value | p value |
|---|---|---|---|---|
| (Intercept) | 4.62 | 0.75 | 6.14 | p < 0.001 |
| cooperation probability | 0.45 | 0.24 | 1.90 | p = 0.058 |
| volatility | −0.03 | 0.18 | −0.15 | p = 0.884 |
| order | −0.19 | 0.15 | −1.30 | p = 0.193 |
| scenario | 1.20 | 0.20 | 6.10 | p < 0.001 |
| gender | −0.38 | 0.16 | −2.39 | p = 0.017 |
| age | −0.06 | 0.03 | −1.82 | p = 0.069 |
| cooperation probability×volatility | 0.16 | 0.26 | 0.63 | p = 0.528 |
| cooperation probability×scenario | −1.08 | 0.28 | −3.90 | p < 0.001 |
| volatility×scenario | 0.11 | 0.23 | 0.50 | p = 0.621 |
| cooperation probability×volatility×scenario | −0.05 | 0.33 | −0.16 | p = 0.873 |
附表8: 实验2中以社会奖赏为因变量的线性混合模型效应
| Fixed effects | Estimated beta value | SE | t value | p value |
|---|---|---|---|---|
| (Intercept) | 4.62 | 0.75 | 6.14 | p < 0.001 |
| cooperation probability | 0.45 | 0.24 | 1.90 | p = 0.058 |
| volatility | −0.03 | 0.18 | −0.15 | p = 0.884 |
| order | −0.19 | 0.15 | −1.30 | p = 0.193 |
| scenario | 1.20 | 0.20 | 6.10 | p < 0.001 |
| gender | −0.38 | 0.16 | −2.39 | p = 0.017 |
| age | −0.06 | 0.03 | −1.82 | p = 0.069 |
| cooperation probability×volatility | 0.16 | 0.26 | 0.63 | p = 0.528 |
| cooperation probability×scenario | −1.08 | 0.28 | −3.90 | p < 0.001 |
| volatility×scenario | 0.11 | 0.23 | 0.50 | p = 0.621 |
| cooperation probability×volatility×scenario | −0.05 | 0.33 | −0.16 | p = 0.873 |
| Fixed effects | Estimated beta value | SE | t value | p value |
|---|---|---|---|---|
| (Intercept) | 0.11 | 0.06 | 1.92 | p = 0.055 |
| cooperation probability | 0.02 | 0.03 | 0.60 | p = 0.550 |
| volatility | −0.02 | 0.01 | −1.23 | p = 0.218 |
| order | −0.004 | 0.01 | −0.43 | p = 0.667 |
| subject’s choice t-1 | 0.06 | 0.004 | 15.90 | p < 0.001 |
| subject’s choice t-2 | 0.03 | 0.004 | 7.62 | p < 0.001 |
| subject’s choice t-3 | 0.03 | 0.003 | 8.15 | p < 0.001 |
| partner’s choice t-1 | 0.34 | 0.003 | 112.40 | p < 0.001 |
| partner’s choice t-2 | 0.09 | 0.003 | 28.67 | p < 0.001 |
| partner’s choice t-3 | 0.04 | 0.003 | 13.85 | p < 0.001 |
| scenario | 0.16 | 0.02 | 7.11 | p < 0.001 |
| gender | 0.01 | 0.02 | 0.32 | p = 0.747 |
| age | 0.001 | 0.002 | 0.30 | p = 0.762 |
| cooperation probability×volatility | −0.002 | 0.02 | −0.08 | p = 0.936 |
| cooperation probability×scenario | −0.16 | 0.03 | −5.25 | p < 0.001 |
| volatility×scenario | 0.01 | 0.01 | 1.63 | p = 0.102 |
| cooperation probability×volatility×scenario | −0.02 | 0.01 | −1.62 | p = 0.104 |
附表9: 实验2中以期望为因变量的线性混合模型效应
| Fixed effects | Estimated beta value | SE | t value | p value |
|---|---|---|---|---|
| (Intercept) | 0.11 | 0.06 | 1.92 | p = 0.055 |
| cooperation probability | 0.02 | 0.03 | 0.60 | p = 0.550 |
| volatility | −0.02 | 0.01 | −1.23 | p = 0.218 |
| order | −0.004 | 0.01 | −0.43 | p = 0.667 |
| subject’s choice t-1 | 0.06 | 0.004 | 15.90 | p < 0.001 |
| subject’s choice t-2 | 0.03 | 0.004 | 7.62 | p < 0.001 |
| subject’s choice t-3 | 0.03 | 0.003 | 8.15 | p < 0.001 |
| partner’s choice t-1 | 0.34 | 0.003 | 112.40 | p < 0.001 |
| partner’s choice t-2 | 0.09 | 0.003 | 28.67 | p < 0.001 |
| partner’s choice t-3 | 0.04 | 0.003 | 13.85 | p < 0.001 |
| scenario | 0.16 | 0.02 | 7.11 | p < 0.001 |
| gender | 0.01 | 0.02 | 0.32 | p = 0.747 |
| age | 0.001 | 0.002 | 0.30 | p = 0.762 |
| cooperation probability×volatility | −0.002 | 0.02 | −0.08 | p = 0.936 |
| cooperation probability×scenario | −0.16 | 0.03 | −5.25 | p < 0.001 |
| volatility×scenario | 0.01 | 0.01 | 1.63 | p = 0.102 |
| cooperation probability×volatility×scenario | −0.02 | 0.01 | −1.62 | p = 0.104 |
| [1] | Astington, J. W., & Jenkins, J. M. (1995). Theory of mind development and social understanding. Cognition and Emotion, 9(2-3), 151-165. https://doi.org/10.1080/02699939508409006 |
| [2] |
Bai, L., Yuan, B., Zhang, W., Zhang, Z., Lan, J., & Yiwen, W. (2014). Interpersonal cooperation and conflict influenced outcome evaluation in social decision-making. Acta Psychologica Sinica, 46(11), 1760. https://doi.org/10.3724/SP.J.1041.2014.01760
doi: 10.3724/SP.J.1041.2014.01760 URL |
| [白丽英, 袁博, 张蔚, 张振, 兰姣, 王益文. (2014). 人际合作与冲突影响博弈决策的结果评价. 心理学报, 46(11), 1760-1771. https://doi.org/10.3724/SP.J.1041.2014.01760] | |
| [3] | Baker, F., & Rachlin, H. (2001). Probability of reciprocation in repeated prisoner's dilemma games. Journal of Behavioral Decision Making, 14(1), 51-67. https://doi.org/10.1002/1099-0771(200101)14:1<51::AID-BDM365>3.0.CO;2-K |
| [4] | De Cremer, D., & Van Lange, P. A. (2001). Why prosocials exhibit greater cooperation than proselfs: The roles of social responsibility and reciprocity. European Journal of Personality, 15(S1), S5-S18. https://doi.org/10.1002/per.418 |
| [5] | Fang, Z., Zhao, M., Xu, T., Li, Y., Xie, H., Quan, P., Geng, H., & Zhang, R.-Y. (2024). Individuals with anxiety and depression use atypical decision strategies in an uncertain world. eLife, 13, RP93887. https://doi.org/10.7554/eLife.93887.1 |
| [6] |
Fareri, D. S., Chang, L. J., & Delgado, M. R. (2012). Effects of direct social experience on trust decisions and neural reward circuitry. Frontiers in Neuroscience, 6, 148. https://doi.org/10.3389/fnins.2012.00148
doi: 10.3389/fnins.2012.00148 URL pmid: 23087604 |
| [7] |
Fareri, D. S., Chang, L. J., & Delgado, M. R. (2015). Computational substrates of social value in interpersonal collaboration. Journal of Neuroscience, 35(21), 8170-8180. https://doi.org/10.1523/jneurosci.4775-14.2015
doi: 10.1523/JNEUROSCI.4775-14.2015 URL pmid: 26019333 |
| [8] | Fehr, E., & Fischbacher, U. (2003). The nature of human altruism. Nature, 425(6960), 785-791. https://doi.org/ 10.1038/nature02043 |
| [9] |
Fehr, E., & Schurtenberger, I. (2018). Normative foundations of human cooperation. Nature Human Behaviour, 2(7), 458-468. https://doi.org/10.1038/s41562-018-0385-5
doi: 10.1038/s41562-018-0385-5 URL pmid: 31097815 |
| [10] | Fischbacher, U., Gächter, S., & Fehr, E. (2001). Are people conditionally cooperative? Evidence from a public goods experiment. Economics Letters, 71(3), 397-404. https://doi.org/10.2139/ssrn.203288 |
| [11] | Gächter, S. (2007). Conditional cooperation:Behavioral regularities from the lab and the field and their policy implications. In B. S.Frey & A.Stutzer (Eds.), Economics and psychology: A promising new cross-disciplinary field (pp. 19-50). MIT Press. |
| [12] | Gächter, S., Lee, K., & Sefton, M. (2022). The variability of conditional cooperation in sequential prisoner's dilemmas. The Centre for Decision Research and Experimental Economics, School of Economics, University of Nottingham. |
| [13] | Hampton, A. N., Bossaerts, P., & O'Doherty, J. P. (2008). Neural correlates of mentalizing-related computations during strategic interactions in humans. Proceedings of the National Academy of Sciences, 105(18), 6741-6746. https://doi.org/10.1073/pnas.0711099105 |
| [14] |
Henco, L., Brandi, M.-L., Lahnakoski, J. M., Diaconescu, A. O., Mathys, C., & Schilbach, L. (2020). Bayesian modelling captures inter-individual differences in social belief computations in the putamen and insula. Cortex, 131, 221-236. https://doi.org/10.1016/j.cortex.2020.02.024
doi: S0010-9452(20)30145-3 URL pmid: 32571519 |
| [15] |
Hill, C. A., Suzuki, S., Polania, R., Moisa, M., O'Doherty, J. P., & Ruff, C. C. (2017). A causal account of the brain network computations underlying strategic social behavior. Nature Neuroscience, 20(8), 1142-1149. https://doi.org/10.1038/nn.4602
doi: 10.1038/nn.4602 URL pmid: 28692061 |
| [16] | Kreps, D. M., Milgrom, P., Roberts, J., & Wilson, R. (1982). Rational cooperation in the finitely repeated prisoners' dilemma. Journal of Economic Theory, 27(2), 245-252. https://doi.org/10.1016/0022-0531(82)90029-1 |
| [17] | Mukherjee, D., Filipowicz, A. L., Vo, K., Satterthwaite, T. D., & Kable, J. W. (2020). Reward and punishment reversal- learning in major depressive disorder. Journal of Abnormal Psychology, 129(8), 810-823. https://doi.org/10.1037/abn0000641 |
| [18] | Murphy, R. O., Ackermann, K. A., & Handgraaf, M. (2011). Measuring social value orientation. Judgment and Decision Making, 6(8), 771-781. https://doi.org/10.1017/S1930297500004204 |
| [19] | Nowak, M., & Sigmund, K. (1993). A strategy of win-stay, lose-shift that outperforms tit-for-tat in the Prisoner's Dilemma game. Nature, 364(6432), 56-58. https://doi.org/ 10.1038/364056a0 |
| [20] |
Pal, S., & Hilbe, C. (2022). Reputation effects drive the joint evolution of cooperation and social rewarding. Nature Communications, 13, 5928. https://doi.org/10.1038/s41467-022-33551-y
doi: 10.1038/s41467-022-33551-y URL pmid: 36207309 |
| [21] |
Park, S. A., Sestito, M., Boorman, E. D., & Dreher, J.-C. (2019). Neural computations underlying strategic social decision-making in groups. Nature Communications, 10, 5287. https://doi.org/10.1038/s41467-019-12937-5
doi: 10.1038/s41467-019-12937-5 URL pmid: 31754103 |
| [22] |
Rigoux, L., Stephan, K. E., Friston, K. J., & Daunizeau, J. (2014). Bayesian model selection for group studies— revisited. Neuroimage, 84, 971-985. https://doi.org/10.1016/j.neuroimage.2013.08.065
doi: 10.1016/j.neuroimage.2013.08.065 URL pmid: 24018303 |
| [23] |
Rilling, J. K., Gutman, D. A., Zeh, T. R., Pagnoni, G., Berns, G. S., & Kilts, C. D. (2002). A neural basis for social cooperation. Neuron, 35(2), 395-405. https://doi.org/10.1016/S0896-6273(02)00755-9
doi: 10.1016/s0896-6273(02)00755-9 URL pmid: 12160756 |
| [24] | Rusch, T., Steixner-Kumar, S., Doshi, P., Spezio, M., & Gläscher, J. (2020). Theory of mind and decision science: Towards a typology of tasks and computational models. Neuropsychologia, 146, 107488. https://doi.org/10.1016/j.neuropsychologia.2020.107488 |
| [25] |
Sanfey, A. G., Rilling, J. K., Aronson, J. A., Nystrom, L. E., & Cohen, J. D. (2003). The neural basis of economic decision- making in the ultimatum game. Science, 300(5626), 1755-1758. https://doi.org/10.1126/science.1082976
doi: 10.1126/science.1082976 URL pmid: 12805551 |
| [26] | Schwarz, G. (1978). Estimating the dimension of a model. Annals of Statistics, 6(2), 461-464. |
| [27] |
Sorgi, K. M., & van’t Wout, M. (2016). The influence of cooperation and defection on social decision making in depression: A study of the iterated Prisoner's Dilemma Game. Psychiatry Research, 246, 512-519. https://doi.org/10.1016/j.psychres.2016.10.025
doi: S0165-1781(15)30667-3 URL pmid: 27821362 |
| [28] |
Stallen, M., Smidts, A., & Sanfey, A. G. (2013). Peer influence: neural mechanisms underlying in-group conformity. Frontiers in Human Neuroscience, 7, 50. https://doi.org/10.3389/fnhum.2013.00050
doi: 10.3389/fnhum.2013.00050 URL pmid: 23482688 |
| [29] |
Tamir, D. I., & Hughes, B. L. (2018). Social rewards: from basic social building blocks to complex social behavior. Perspectives on Psychological Science, 13(6), 700-717. https://doi.org/10.1177/1745691618776263
doi: 10.1177/1745691618776263 URL pmid: 30415630 |
| [30] |
Tang, H., Li, X., Wei, Y., Li, X., Chen, L., & Zhang, Y. (2022). The impact of partner choice on cooperative behavior and its mechanisms. Advances in Psychological Science, 30(10), 2356. https://doi.org/10.3724/SP.J.1042.2022.02356
doi: 10.3724/SP.J.1042.2022.02356 URL |
|
[唐辉, 李鑫宇, 魏一帆, 李晓彩, 陈柳燕, 张曜. (2022). 伙伴选择对合作行为的影响作用与机制. 心理科学进展, 30(10), 2356-2371. https://doi.org/10.3724/SP.J.1042.2022.02356]
doi: 10.3724/SP.J.1042.2022.02356 URL |
|
| [31] |
van Baar, J. M., Chang, L. J., & Sanfey, A. G. (2019). The computational and neural substrates of moral strategies in social decision-making. Nature Communications, 10, 1483. https://doi.org/10.1038/s41467-019-09161-6
doi: 10.1038/s41467-019-09161-6 URL pmid: 30940815 |
| [32] | Wilson, R., & Collins, A. (2019). Ten simple rules for the computational modeling of behavioral data. eLife, 8, e49547. https://doi.org/10.7554/eLife.49547 |
| [33] |
Wu, H., Liu, X., Hagan, C. C., & Mobbs, D. (2020). Mentalizing during social InterAction: A four component model. Cortex, 126, 242-252. https://doi.org/10.1016/j.cortex.2019.12.031
doi: S0010-9452(20)30027-7 URL pmid: 32092493 |
| [1] | 李琎, 孙宇, 杨子鹿, 钟毅平. 社会价值取向对自我社会奖赏加工的影响——来自ERPs的证据[J]. 心理学报, 2020, 52(6): 786-800. |
| 阅读次数 | ||||||
|
全文 |
|
|||||
|
摘要 |
|
|||||