

自20世纪以来, 统计推断在科学研究中起到越来越重要的作用(Salsburg, 2001), 科学研究结论的正确性也越来越依赖于统计推断的正确应用。目前, 使用最为广泛的统计推断方法是零假设检验(Null hypothesis significance testing, NHST) (Wasserstein & Lazar, 2016)。然而, 与NHST在各个领域中广泛使用相伴的是研究者对NHST及p值的误解和盲目使用(Gigerenzer, 2004; Greenland et al., 2016; Ziliak & McCloskey, 2008; 胡传鹏等, 2016; 骆大森, 2017), 因此带来一些消极的后果。例如, p值被用来支持不合理且无法重复的研究结果(如, Bem, 2011), 引起了关于NHST是否适合于科学研究的争论(Miller, 2011)。在这个背景之下, 有研究者推荐使用贝叶斯因子替代NHST (Wagenmakers, Wetzels, Borsboom, & van der Maas, 2011; 钟建军, Dienes, 陈中永, 2017)。
贝叶斯因子(Bayes factor)是贝叶斯统计(Bayesian statistics)中用来进行模型比较和假设检验的方法。在假设检验中, 其代表的是当前数据对零假设与备择假设支持的强度之间的比率。正如下一节将要详述的, 贝叶斯因子能够量化地反映当前数据对各个假设支持的程度, 因此可能更加适用于科研中的假设检验。但由于贝叶斯因子的统计原理及实现相对复杂, 其在各个学科的研究中并未获得广泛应用。
近年来, 随着计算机运算能力的大大提升, 贝叶斯统计在计算机等领域获得了巨大的成功(如Zhu, Chen, Hu, & Zhang, 2017)。贝叶斯统计的工具迅速发展, 如WinBUGs (Lunn, Spiegelhalter, Thomas, & Best, 2009)、JAGS (Plummer, 2003)、Stan (Carpenter et al., 2017)和Python语言的工具包PyMC3 (Salvatier, Wiecki, & Fonnesbeck, 2016)等。这些软件和工具包的出现, 促进贝叶斯方法在各个研究领域中的使用(Depaoli & van de Schoot, 2017; van de Schoot, Winter, Ryan, Zondervan- Zwijnenburg, & Depaoli, 2017)。在这些工具中, 也出现了用于计算贝叶斯因子的工具, 如R语言中的BayesFactor (http://bayesfactorpcl.r-forge.r-project. org/)。在心理学及相关领域, 最近有不少研究者试图引入贝叶斯统计的方法(Dienes, 2008, 2011, 2014; Hoijtink, 2011; Klugkist, Laudy, & Hoijtink, 2005; Kruschke, 2014; Masson, 2011; Morey & Rouder, 2011; Mulder et al., 2009; Rouder, Morey, Speckman, & Province, 2012; Rouder, Speckman, Sun, Morey, & Iverson, 2009; Vanpaemel, 2010; Wagenmakers, Lodewyckx, Kuriyal, & Grasman, 2010)。在心理学(Open Science Collaboration, 2015; 胡传鹏等, 2016)、神经成像研究(Chen, Lu, & Yan, 2018; Zuo & Xing, 2014)等领域出现“重复危机”的背景之下, 使用合理的统计方法显得更加迫切。但对于不少心理学及相关领域的研究者来说, 使用R语言或其他计算机语言进行贝叶斯因子计算仍然较为困难。为解决这一障碍, 研究者们开发了与商业统计软件SPSS具有相似图形界面的统计工具JASP (
本文旨在为向心理学及相关学科的研究者介绍贝叶斯因子及其使用。首先本文将介绍贝叶斯因子的原理, 及其相对于传统假设检验中p值的优势; 再以独立样本t检验为例, 介绍了如何使用JASP计算贝叶斯因子, 以及如何解读和报告其结果。在此基础上, 讨论了贝叶斯因子的应用价值及其不足。
1 贝叶斯因子的原理
贝叶斯因子是贝叶斯统计在假设检验上的应用, 因此要理解贝叶斯因子, 首先需要理解贝叶斯统计的原理。
1.1 贝叶斯统计简介
贝叶斯学派(Bayesian statistics)与频率学派(Frequentist statistics)是统计学中主要的两个学派, 其核心的差异在于他们对于概率(probability)所代表的意义有着不一样的解读。对于频率学派而言, 概率是通过无数次重复抽样中频率(frequency)的预期值。与之相反, 贝叶斯学派则认为, 概率是对一件事情的相信程度, 从0到1表示人们基于所获得的信息, 在多大程度上相信某件事情是真的。由于不同人对同一事件的相信程度可能不同, 因此, 贝叶斯学派的概率是具有主观性。但贝叶斯学派的概率却不是任意的:人们通过合理的方式, 不断获取并更新已知信息, 可以最终消除主观性, 从而达成一致。
正由于频率学派将概率看作长期行为表现的结果, 要理解频率学派的概率, 通常需要假想尚未发生的事件。例如, 在NHST框架之下, p值的意义是假定H0为真的情况下, 出现当前结果及比当前结果更加极端结果的概率。换句话说, p值表达的意思是:假如H0为真, 如果采用完全相同的条件, 无数次地重复当前实验, 这些实验中将有多大比例会出现当前结果模式或者比当前结果模式更极端的模式。因此, p值的意义暗含一个重要的假设:我们能够无数次地重复试验。但研究者却经常忽略这种无数次重复相同试验的假定, 误认为p值是单次检验中拒绝零假设时犯错误的概率(Greenland et al., 2016)。这种对NHST的误解, 恰好是带有贝叶斯统计色彩, 即根据当前的数据计算某个模型正确或者错误的概率。
与频率学派统计不同, 贝叶斯统计最大的特点之一在于:它考虑了不同可能性对于个体来说的可信度(credibility) (Kruschke, 2014)。而通过不断获得的数据, 人们可以改变对不同可能性的相应程度。这种思维方式与人们在日常生活中的经验非常相似:当我们不断地获得支持某个观点的证据时, 我们会更加相信该观点。
虽然贝叶斯统计对概率的理解与频率学派不同, 但是其对概率的计算却严格依照概率的基本原则:加法原则与乘法原则。贝叶斯统计中最核心的贝叶斯法则(Bayes rule), 也是根据简单的加法原则与乘法原则推导而来。依据概率的乘法原则, 随机事件A与随机事件B同时发生的概率为:
$p(\text{A}\cap \text{B})=p(A\text{ }\!\!|\!\!\text{ }B)\times p(B)=p(B\text{ }\!\!|\!\!\text{ }A)\times p(A)$ (1)
式(1)即为联合概率的公式, 即A与B同时发生的概率。其意义为:A与B的联合概率(p(A∩B))为, 在B发生的条件下A发生的概率(p (A|B))与B发生的的概率(p(B))的乘积, 也等于在A发生的条件下B发生的概率(p(B|A))与A发生的概率(p (A))的乘积。其中, p (A|B)和p (B|A)均为条件概率(conditional probability), 二者意义不同。
对式(1)进行变换, 即可以得到如下公式:
$p(A\text{ }\!\!|\!\!\text{ }B)=\frac{p(\text{A}\cap \text{B})}{p(B)}=\frac{p(B\text{ }\!\!|\!\!\text{ }A)\times p(A)}{p(B)}$ (2)
式(2)即为贝叶斯定理公式。其代表的意义是, 如果我们要计算B发生的条件下A发生的概率(p(A|B)), 可以通过使用A与B同时发生的概率(p(A∩B))除以B发生的概率(p(B)), 也就等于在A发生的条件下B发生的概率, 与A发生概率的乘积, 再除以B发生的概率。式(2)将两个条件概率联系起来, 从而使得计算不同的条件概率成为可能。
在贝叶斯统计的框架之下, 式(2)可以看作是一次信息的更新。假定我们需要根据一次实验收集到的数据(data)来检验某个理论模型为真的可能性。以心理学研究中常用的零假设H0为例, 则可以将式(2)改写如下:
$p({{H}_{0}}\text{ }\!\!|\!\!\text{ }data)=\frac{p(data\text{ }\!\!|\!\!\text{ }{{H}_{0}})\times p({{H}_{0}})}{p(data)}$ (3)
p(H0|data)表示数据更新之后理论模型H0正确的概率, 即后验概率(posterior); p (H0)表示更新数据之前认为理论模型H0正确的概率, 即先验概率(prior); 而p (data|H0)则是在模型H0之下, 出现当前数据的概率, 即边缘似然性(marginal likelihood)。由此可以看出, 在贝叶斯统计之中, 一次数据收集(实验)的主要功能在于帮助我们更新理论模型的可信度。
根据式(3), 我们可以使用数据对任意的模型为真的概率进行更新。在假设检验中, 我们可以根据观测数据同时对零假设(理论模型H0)和备择假设(理论模型H1)的可信度进行更新(分别见式(3)和式(4)), 得到它们更新的后验概率。
$p({{H}_{1}}\text{ }\!\!|\!\!\text{ }data)=\frac{p(data\text{ }\!\!|\!\!\text{ }{{H}_{1}})\times p({{H}_{1}})}{p(data)}$ (4)
得到H0和H1的后验概率后, 可能对两者进行比较, 即式(5):
$\frac{p\text{(}{{H}_{1}}\text{ }\!\!|\!\!\text{ }data)}{p\text{(}{{H}_{0}}\text{ }\!\!|\!\!\text{ }data)}~=~\frac{p\left( data\text{ }\!\!|\!\!\text{ }{{H}_{1}} \right)}{p\left( data\text{ }\!\!|\!\!\text{ }{{H}_{0}} \right)}\times \frac{p\left( {{H}_{1}} \right)}{p\left( {{H}_{0}} \right)}$ (5)
其中, 贝叶斯因子为:
$\text{B}{{\text{F}}_{10}}\frac{p\text{(}data\text{ }\!\!|\!\!\text{ }{{H}_{1}})}{p(data{{H}_{0}})}$ (6)
在式(6)中, BF10下标的1代表的是H1, 0代表的是H0, 因此, BF10即代表的是H1与H0对比的贝叶斯因子, 而BF01则代表的是H0与H1对比的贝叶斯因子。例如, BF10 = 19表示的是, 在备择假设H1为真条件下出现当前数据的可能性是虚无假设H0条件下出现当前数据的可能性的19倍。从这个定义公式中可以看出, 贝叶斯因子是体现了当前数据将先验概率更新为后验概率过程中的变化。
正是如此, 贝叶斯因子与NHST回答了不同的问题。NHST试图回答“假定我们已知两个变量的关系(如, 两种条件没有差异), 出现当前观测数据的模式或者更加极端模式的概率(p (more extreme > observed data|H0))有多大”的问题; 而贝叶斯因子试图回答的是:“在当前数据更可能在哪个理论模型下出现”的问题。在假设检验中, 贝叶斯因子具有一些NHST不具备的优势(见表1), 下一小节将对这些优势进行详细说明。
表1 假设检验中贝叶斯推断与传统NHST推断的比较
| 假设检验中的问题 | 贝叶斯因子 | 传统推理 | 参考文献 |
|---|---|---|---|
| 1. 同时考虑H0和H1的支持证据 | √ | × | 10, 11 |
| 2. 可以用来支持H0 | √ | × | 12, 13 |
| 3. 不“严重”地倾向于反对H0 | √ | × | 14, 15, 16 |
| 4. 可以随着数据累积来监控证据的强度 | √ | × | 17, 18 |
| 5. 不依赖于未知的或者不存在的抽样计划 | √ | × | 19, 20 |
注:10 =
在Jeffreys (1961)的基础上, Wagenmakers, Love等人(2017)对贝叶斯因子的大小所代表的意义进行原则上的划分(见表2)。但是这个划分仅是大致参考, 不能严格对应, 研究者需要根据具体的研究来判断贝叶斯因子的意义。
表2 贝叶斯因子决策标准
| 贝叶斯因子, BF10 | 解释 |
|---|---|
| > 100 | 极强的证据支持H1 |
| 30 ~ 100 | 非常强的证据支持H1 |
| 10 ~ 30 | 较强的证据支持H1 |
| 3 ~ 10 | 中等程度的证据支持H1 |
| 1 ~ 3 | 较弱的证据支持H1 |
| 1 | 没有证据 |
| 1/3 ~ 1 | 较弱的证据支持H0 |
| 1/10 ~ 1/3 | 中等程度的证据支持H0 |
| 1/30 ~ 1/10 | 较强的证据支持H0 |
| 1/100 ~ 1/30 | 非常强的证据支持H0 |
| < 1/100 | 极强的证据支持H0 |
1.2 备择假设的默认先验
由于贝叶斯因子中先验概率具有至关重要的作用, 如何选择备择假设的先验分布变得尤其重要。其中一个较为合理的做法是, 根据某问题的先前研究结果(如元分析得到的效应量)来设定备择假设的先验分布。但这种做法在很多情况下并不现实:首先根据范式的不同, 效应量的可能分布不同; 更重要地, 由于许多研究本身具有一定的探索性, 并没有先前研究结果作为指导。因此, 更加常用的做法是使用一个综合的、标准化的先验。
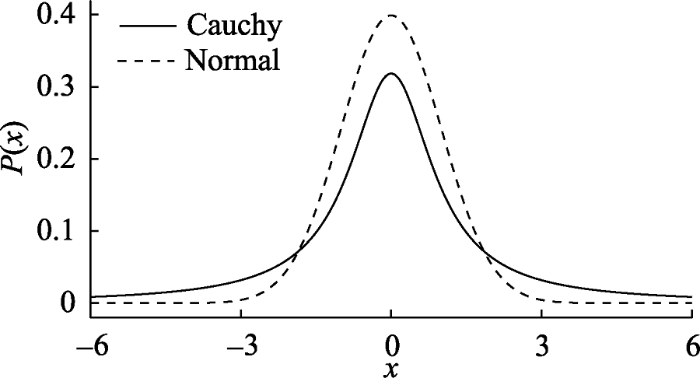
例如, 在贝叶斯t检验中, 使用柯西分布(Cauchy distribution)作为备择假设的先验可能是比较合理的选择(Jeffreys, 1961; Ly, Verhagen, & Wagenmakers, 2016a, 2016b; Rouder et al., 2009)。与标准正态分布相比, 柯西分布在0附近概率密度相对更小一些, 因此其比标准的正态允许更多较大的效应(见图1); 而与均匀分布(即效应量在所有值上的分布完全相同)相比, 柯西分布更偏好零假设一些(Jeffreys, 1961; Rouder et al., 2009)。因此, 对于备择假设的先验分布, 可以如下表示:
$\text{ }\!\!\delta\!\!\text{ }\!\!~\!\!\text{ }\!\!\tilde{\ }\!\!\text{ }Cauchy\left( {{x}_{0}}=0,\text{ }\!\!\gamma\!\!\text{ }=1 \right)$
其中x0为柯西分布的位置(position)参数, γ为尺度参数(Cauchy scale, 也有文献中使用r来表示)。Jeffreys (1961)最早提出在贝叶斯因子中使用柯西分布作为先验来比较两样本的问题。最近研究者的进一步验证表明, 柯西分布可以作为先验用于计算心理学研究中常用的贝叶斯因子分析, 如t检验(Rouder et al., 2009)、ANOVA (Rouder et al., 2012)和相关分析(Ly, Marsman, & Wagenmakers, 2018; Ly et al., 2016b)等。这些验证性的工作, 为贝叶斯因子在心理学及相关学科研究中的应用打下了基础。
图1
2 贝叶斯因子的优势
如前所述, 在假设检验中, 贝叶斯因子除了更加符合人们的直觉之外, 还具有一些NHST所不具备的优势。这些优势可以总结为五个方面(见表1)。以下将从这五个方面展开。
2.1 同时考虑H0和H1
贝叶斯因子的计算同时考虑H0和H1, 并根据全部现有数据对H0和H1为真的先验概率进行更新, 在此基础之上, 比较在当前数据下哪个理论模型(H0和H1)更合理。这种思路与NHST不同:在NHST框架之下, 计算p值仅需要假定H0为真, 而对H1不做任何假设, 因此p值与H1无关。NHST的逻辑是, 如果H0为真的条件下, 观察到当前数据出现的概率非常小, 则拒绝H0, 接受H1。这种情况下, NHST忽略了一种可能性:当前数据下, H1为真的概率与H0为真的概率相当或者更小(Wagenmakers, Verhagen, et al., 2017)。例如, 在Bem (2011) 中, H0是被试的反应不受到未来出现刺激的影响, H1是未来出现的刺激会影响到被试当前反应, 即被试能够“预知”尚未出现的刺激。虽然采用NHST的逻辑Bem (2011)得到了p < 0.05的结果, 即H0为真时, 得到当前数据的概率(p (data|H0))很低, 因此作者选择拒绝H0而接受H1, 认为被试能够预知未来出现的刺激。然而, 研究者更关心的是, 根据当前数据, 我们能够得到某个模型/假设(如H1)为真的概率(p (H1|data)), 而非零假设H0为真时得到当前数据的概率(p (data| H0))。在Bem (2011)这个研究中, 先验知识告诉我们H1本身为真的概率可能非常低, 在当前数据模式下, H1为真的可能性p (H1|data)极可能比H0为真的可能性p (H0|data)更低(Rouder & Morey, 2011; Wagenmakers et al., 2011), 但NHST却完全忽视了这一点。
2.2 可以用来支持H0
同样, 由于贝叶斯因子同时量化当前数据对H0和H1各自的支持强度, 其可以用来支持H0 (Dienes, 2014)。但是, 在传统的NHST框架之下, 假设检验仅在H0为真的假设下进行, 仅凭借小于显著性水平(比如0.05或0.005)无法为H0是否为真提供证据。比如, 仅依据假设检验的结果p = 0.2并不能推断有证据表明没有效应(evidence of absence) (除非结合样本量、效应量和统计效力Power做出综合判断)。
实际的研究中, 能够对H0提供量化的证据具有非常重要的意义(Gallistel, 2009; Rouder et al., 2009), 它可以直观地让研究者区分出有证据表明没有效应(evidence of absence)和没有证据表明有效应(absence of evidence)这两种情况(Dienes, 2014)。具体来说, 贝叶斯因子的结果有三种状态:(1)提供了支持H1的证据(即有证据表明有效应); (2)支持H0的证据(即有证据表明没有效应); 或(3)证据对两者都不支持(没有足够的证据表明有效应还是无效应)。例如, 贝叶斯因子BF01 = 15表明观察到的数据出现在H0为真情况下的可能性是在H1为真情况下的可能性的15倍, 表明当前数据更加支持没有效应的假设H0。但是, 假如BF01 = 1.5, 则说明观察到的数据出现在H0为真情况下的可能性是在H1为真情况下的可能性的1.5倍, 则说明当前数据对于两个假设的支持程度相当, 没有足够的证据支持H0或者H1 (见表2关于贝叶斯因子大小意义的建议)。
值得注意的是, 不管是支持H1, 还是支持H0, 贝叶斯因子提供的证据是相对的, 即相对于某个假设更支持另一个假设, 因此可能存在第三个模型H2比H1和H0均更接近真实情况, 具有更高的后验概率。值得指出的是, 最近有研究者在NHST框架之下发展出可以接受零假设的方法:等同性检验(Equivalence Test)。这种方法通过设定多个H0来检验效应量是否与0没有差异, 从而检验是否能接受H0 (Lakens, 2017)。但等同性检验仍然使用了p值, 无法提供对证据的直接测量(Schervish, 1996)。
2.3 不“严重”地倾向于反对H0
贝叶斯因子同时分别量化了当前数据对H0和H1支持的强度, 其与传统NHST相比, 其对H0和H1的支持更加均衡, 从而其拒绝H0的倾向也相对没有那么强烈。
在传统NHST假设之下, 只要研究者能够收集足够多的数据, 总能够得到p < 0.05从而拒绝H0, 与之相反的是, 贝叶斯因子会随着数据的增加而逐渐趋于稳定(见后文3.2小节关于贝叶斯因子收敛的讨论)。对于同样的数据, p值也似乎比贝叶斯因子对H0的反对程度更强。例如, 有研究者分析了美国总统选举中候选人的身高与当选之间的关系, 对相关系数进行显著性检验之后发现r = 0.39, p = 0.007 (Stulp, Buunk, Verhulst, & Pollet, 2013)。如果使用贝叶斯因子分析, 则会得到BF10 = 6.33 (Wagenmakers, Marsman, et al., 2017)。虽然两种方法大致上支持了同样的结论(即拒绝H0与中等程度的证据支持H1), 但是从p值上看, 似乎表明拒绝H0的证据很强, 而贝叶斯因子得到的支持则是有保留的。Wetzels等人(2011)比较了855个t检验的结果, 发现虽然大部分的情况下p值与贝叶斯因子在结论上的方向一致, 但是贝叶斯因子相对来说更加谨慎:p值在0.01与0.05之间的统计显著结果, 其对应的贝叶斯因子只表明有非常弱的证据。对传统p值的贝叶斯解读, 详见(Johnson, 2013; Marsman & Wagenmakers, 2017b)。
2.4 可以监控证据的强度变化
计算贝叶斯因子时, 可以根据数据来更新对H0和H1支持的程度, 因此, 随着新数据的出现, 可以不断对不同假设的支持程度进行更新。在贝叶斯框架之下, 贝叶斯因子的计算与解读均不需要假定存在无数的重复实验, 而是按照似然性法则对贝叶斯因子进行更新, 此外数据的出现顺序不会影响贝叶斯因子的解读(Rouder, 2014)。
贝叶斯统计的框架之下, 不需要假定无数次重复试验, 对贝叶斯因子的解读不会受到何时停止收集数据的影响(Rouder, 2014)。实际上, 如果研究者们能够采用序列贝叶斯因子设计, 在实验开始前提前设置贝叶斯因子的合理阈值(通常是10, 即较强的证据), 则能够在实验中根据数据增加对后验概率进行更新, 可以在适当的时候停止收集数据(Schlaifer & Raiffa, 1961; Schönbrodt, Wagenmakers, Zehetleitner, & Perugini, 2017)。这种不受到停止规则影响的原则, 对实际研究具有重要的意义, 使得研究者能合理有效地收集数据。
2.5 不受抽样计划的影响
抽样计划指研究者根据数据分析的假设, 在研究开始之前对样本选择以及数据收集过程进行计划以保证数据符合统计假设。例如, 心理学实验中通常采用的随机抽样以及随机分配的做法。由于NHST的使用包含了一些潜在的假设, 抽样计划(尤其是功效分析, power analysis)对于解读p值具有重要意义(Halsey, Curran-Everett, Vowler, & Drummond, 2015)。
但对于贝叶斯因子的解读, 则不受到抽样计划的影响, 原因在于贝叶斯因子的计算使用似然性原则(Berger & Wolpert, 1988), 其对数据的分析没有预先的假设。换句话说, 即使研究者对数据收集的过程不清楚, 仍能够计算和解读贝叶斯因子。这个特点对于分析自然情境中获得的数据非常实用。
仍然以上述的美国总统选举中候选人的身高与当选之间关系的研究为例, 研究者发现r = 0.39, p = 0.007 (Stulp et al., 2013)。在NHST框架之下, 要对p值进行合理的解读, 我们必须假定实验者在总统选举之前已经计划好进行46次选举, 并且在第46次选举后停止收集数据, 并在此基础之上计算相关系数。如果不满足这些假设条件, p = 0.007代表的意义很难解读。但很明显的是, 这些假设是不成立的。
同样, 这个例子还包含与停止规则(stopping rule, 即什么条件下停止收集数据)相关的问题:在真实的生活中, 美国的总统选举还会继续, 数据会继续增加。如何分析未来的这些数据呢?如果每新增加一个数据均进行一次NHST分析, 则会引起多重比较的问题, 使得假阳性增加①(① 对于频率主义的分析来说, 多重比较是非独立的, 校正的方法减少但不能消除一类错误。)。
与NHST不同, 贝叶斯因子能够随着新数据不断地出现而不断地更新, 从而能够分析实验室之外的真实数据, 也能够对数据进行有意义的解读。从这个角度来讲, 贝叶斯因子实时监控证据的优势与不受抽样计划影响的优势是相互关联的:这两个优势均是因为贝叶斯因子不依赖于研究者收集数据的意图。但是, 正如我们在后面要提到的, 虽然随着数据更新而更新贝叶斯因子不会影响到对其解读, 但这种忽略假阳性的做法并不能避免假阳性的升高, 研究者仍需要通过提前设置合理的阈值和(或)选择合适的先验来控制假阳性。
总之, 贝叶斯因子以观察到的数据为条件, 定量地分析当前数据对H0和H1提供的支持程度。通过实时地监控证据强度的变化, 贝叶斯因子让研究者可以在收集数据的同时监控证据强度的变化。如果预先确定贝叶斯因子的停止阈值(比如BF10大于10或者BF10小于1/10时停止收集数据), 研究者能够在证据足够充足停止收集数据。此外, 即使缺乏数据收集计划信息的情况下, 贝叶斯因子仍然能够从观测数据中得到证据来更加支持哪个假设。
3 使用JASP计算贝叶斯因子
由于贝叶斯因子的独特优势, 因此很早就有研究者试图将其引入心理学的研究之中(Edwards et al., 1963)。但贝叶斯因子的计算在实际情况中随着数据类型和分析类型不同而变得更加复杂(相关公式可以参考, Morey & Rouder, 2011; Rouder et al., 2012; Rouder, Morey, Verhagen, Swagman, & Wagenmakers, 2017; Rouder et al., 2009)。正是由于这个原因, 贝叶斯因子在心理学的研究中一直受到很大的限制。最近, 研究者利用R语言丰富的软件包, 开发了可视化的统计工具JASP (https://jasp-stats.org/), 该软件采用与SPSS类似的图形界面, 让贝叶斯因子的计算变得更加容易实现, 本小节将介绍JASP软件及其使用②(② 本小节内容部分来自于Wagenmakers, E.-J., Love, J., Marsman, M., Jamil, T., Ly, A., Verhagen, J., et al. (2017). Bayesian Inference for Psychology. Part II: Example Applications with JASP. Psychonomic Bulletin & Review.)。
3.1 JASP软件简介
JASP是一个免费、开源的统计软件, 其使用R语言的工具包进行数据处理, 但其使用不需要安装R。JASP的长期目标是让所有人能够通过免费的统计软件进行最先进统计技术, 尤其是贝叶斯因子。
JASP是在心理学研究面临可重复危机的背景下开发的, 其开发理念如下:第一, 开源与免费, 因为开源应该是科学研究的本质元素; 第二, 包容性, 既包括贝叶斯分析, 也包括NHST分析方法, 而且NHST分析方法中, 增加了对效应量及其置信区间的输出(Cumming, 2014); 第三, 简洁性, 即JASP的基本软件中仅包括最常用的分析, 而更高级的统计方法又可以通过插件模块进行补充; 第四, 友好的图形界面, 例如, 输出部分随着用户选择变量输入而实时更新, 表格使用APA格式。同时, JASP的使用递进式输出, 即默认的结果输出是最简洁的, 更多的结果输出可以由研究者自己进行定义。此外, 为方便公开和分享分析过程, JASP将输入的数据与输出结果保存于同一个后缀为.jasp的文件之中, 每个分析的结果均与相应的分析和变量数据相关联。这种结果与数据整合的文件可以与开放科学平台Open science framework (OSF,
3.2 贝叶斯因子分析在JASP的实现及其结果解读
目前, JASP中可以实现多种实验设计的贝叶斯因子分析, 包括单样本t检验、独立样本t检验、配对样本t检验、方差分析、重复测量的方差分析、ANCOVA和相关分析。对于每一种分析, 均提供了频率学派的方法和贝叶斯的方法。JASP的贝叶斯因子分析中采用默认先验分布, 但也可以修改。接下来本文将Wagenmakers等人(2015,
在Topolinski和Sparenberg (2012)的第二个实验中, 一组被试以顺时针方向拔动一个厨房用的钟, 而另一组则以逆时针方向拨动。随后, 被试填写一个评估经验开放性的问卷。他们的数据表明, 被试顺时针转时比逆时针转的被试报告更高的对经验的开放性(Topolinski & Sparenberg, 2012) (但是见Francis, 2013)。Wagenmakers等人(2015)采用提前注册(preregistration)的方式对该研究进行重复, 在实验开始前确定停止收集数据的标准:当支持某一个假设的贝叶斯因子达到10时即停止收集数据, 或者每条件下达到50个样本后停止收集数据。此外, 预注册时采用单侧t检验的默认先验, 即γ = 1的柯西分布。而单侧的t检验的先验是只有正效应的柯西分布, 即备择假设为H+ : Cauchy (0, 1)。
有研究者认为, 默认先验分布Cauchy (0, 1)是不现实的, 因为在这个分布中, 大的效应量占的比例太大(大于1的效应量在分布中占了50%以上); 相反, 另一些人觉得这个分布不现实是因为这个分布中, 靠近0的效应量的比重太大, 即效应量为0是最可能的值。一个避免这些问题的做法是减小柯西分布的尺度参数γ。在BayesFactor工具包中, 默认采用的
$\text{ }\!\!\gamma\!\!\text{ }=\frac{1}{2}\sqrt{2}\approx 0.707$
JASP中对于单侧的t检验同样采用这个先验。γ减小意味着H1和H0相似, 他们对观测数据的预测相似, 更难得到支持H0的强证据。
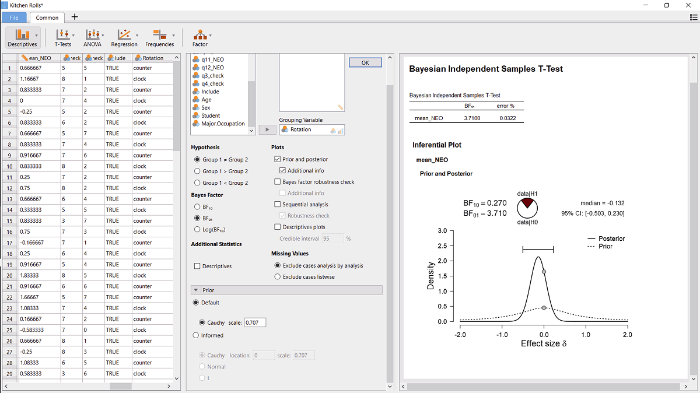
使用JASP可以对这批数据进行贝叶斯的独立样本t检验。首先用JASP打开数据(File → Examples → “Kitchen Rolls”, 或者从
图2
通过这个初步的展示, 我们可以了解到如何进行贝叶斯独立样本t检验的操作。接下来展示如何按照提前注册过的方法, 对这批数据进行贝叶斯单侧独立样本t检验。由于描述性统计输出表明顺时针是组1而逆时针是组2, 我们将在” Hypothesis”的面板处勾选“group 1 > group 2”, 正如图3中间所示。
图3
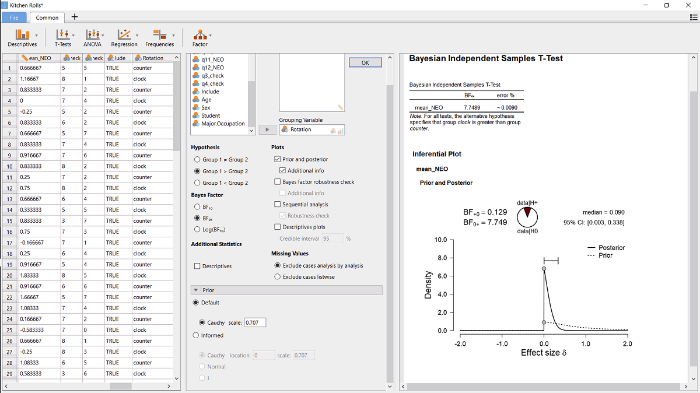
图3
使用JASP对Wagenmakers等人(2015)数据进行贝叶斯单侧独立样本t检验的示意图。左侧是数据, 中间为操作过程, 右侧为结果输出。细节见文中的描述。
单侧检验的结果如图3右边部分所示。与预期的一致, 如果观察到的效应是与假设相反, 则这种使用单侧检验将先验知识整合到分析之中的做法, 增加支持H0的相对证据(也见Matzke等人(2015)), 即贝叶斯因子BF01从3.71增加到了7.74, 意味着观察到的数据在H0下的可能是在H+可能性的7.74倍。
值得注意的是, 在H+下的后验分布是集中在0但不是没有负值(见图3右侧), 与H+中的顺序限制是一致的。这一点与传统频率主义的单侧置信区间不同, 传统方法的单尾置信区间为[-0.23 +∞)③(③ 可以使用R语言中的t.test函数来得到p值的区间[-.23 +∞)。)。虽然传统频率主义的区间在数学上是良好定义的(即, 它包括了全部的不会被单尾的a = 0.05显著性检验拒绝的值), 但是大部分研究者会发现这个区间即不好理解也没有信息量(Morey, Hoekstra, Rouder, Lee, & Wagenmakers, 2016)。
除了计算贝叶斯因子外, JASP还可以进行稳健性分析(Bayesian robustness check), 从而量化柯西先验分布尺度参数γ对贝叶斯因子的影响。
图4
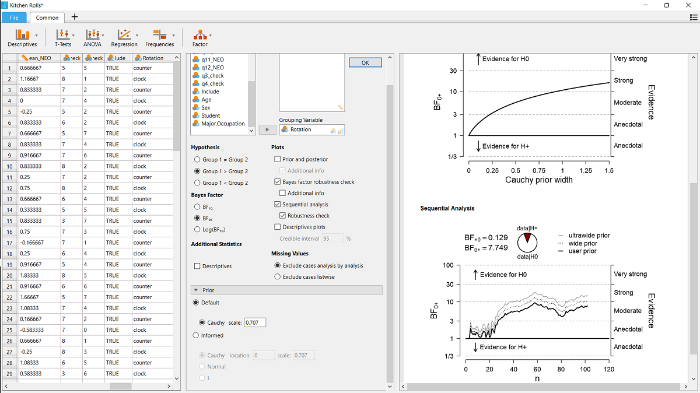
此外, 还可以勾选图4中间的部分的“Sequential analysis”及其子选项“Robustness check”, 进行序列分析。其结果见图4右侧下半部分的图。序列分析显示的是贝叶斯因子随着着抽样而变化的结果, 也就是说, 研究都可以在新数据收集到时对证据的积累进行监控和可视化。从图中可以看到, 实际上Wagenmakers等人(2015)并未按预注册时的γ = 1先验来计算BF0+并在BF0+ > 10或者BF+0 > 10时立刻停止收集数据: 在55个被试之后, 虚线超过了BF0+ > 10, 但是数据仍然继续收集。在实践中, 每隔几天检验一次贝叶斯因子, 有助于了解贝叶斯因子是否在某个时间点上超过预先决定的标准, 并据此决定是否停止数据。
序列分析的一个优点是它可视化了贝叶斯因子在不同先验条件下的收敛过程, 即贝叶斯因子在log尺度上差异开始稳定不变(如, Bahadur & Bickel, 2009; Gronau & Wagenmakers, 2017)。在当前的例子中, 当被试数量达到35时, 不同先验下的贝叶斯因子开始出现收敛。要理解为什么在贝叶斯因子的log值的差异会在一些初步的观测数据之后不再变化, 我们可以假定数据y包括两个部分y1和y2, 根据条件概率公式, BF0+ (y) = BF0+ (y1) × BF0+ (y2|y1)。这个公式表明, 贝叶斯因子并非是对不同数据进行盲目地相乘, 实际上公式中的第二个因子——BF0+(y2|y1)——反映的是:当先验分布已经根据数据y1进行更新后, 数据y2对贝叶斯因子再次更新(Jeffreys, 1961, p. 333)。对这个公式进行log转换后, 得到log (BF0+ (y)) = log (BF0+ (y1)) + log (BF0+(y2|y1))。假定数据y1包括了足够的信息, 不管γ如何变化, 通过y1更新后均得到大致相同的结果分布(在大部分情况下, 这种情况很快就会出现)。而通过y1得到的这个后验分布, 又变成了数据y2的先验分布, 即成为log (BF0+(y2|y1))的先验。在这种情况下, log (BF0+(y2|y1))的值大致相似(相似的先验分布, 相同的数据)。因此, 不一样的γ值会让数据y1产生不同的后验分布, 但当数据y1是足够的大后, 使得y1的后验分布大致相似, 此时y2再次对模型进行更新的大小也是相似, 这就使得log (BF0+(y2|y1))在不同的γ下相似, 产生收敛的现象。
3.3 如何报告贝叶斯因子结果
贝叶斯统计在目前的心理学研究中并不常见。虽然大部分杂志的编辑和审稿人会欣赏采用更加合理的统计手段, 但是出于对贝叶斯方法的陌生, 研究者使用贝叶斯因子时, 需要提供相关的背景信息让编辑和审稿人了解这种背景。因此, 除了报告贝叶斯因子的结果之外, 还需要首先报告如下几点(Kruschke, 2014)。第一, 选用贝叶斯因子的动机与原因, 即为什么在某个报告中使用贝叶斯因子而不是NHST。如前所述, 可以说明贝叶斯因子提供了更加丰富的信息, 或者数据特点不满足NHST的前提假设(如在自然情境下收集的数据, 无法判断数据收集的动机和实验假设)。第二, 描述贝叶斯因子在模型比较中的基本逻辑。即, 假定读者并不非常了解贝叶斯因子, 简单地解释贝叶斯因子中模型比较的思想。第三, 描述贝叶斯因子分析中的先验分布以及采用该先验的原因, 先验分布应该或多或少对数据分析提供一些信息。第四, 解释贝叶斯因子, 将贝叶斯因子与研究中的理论或假设结合起来。
贝叶斯因子不使用统计显著, 而是描述数据对假设的支持程度。例如, 在Wagenmakers等(2015)中, 对Jeffreys默认先验下的贝叶斯因子结果进行如下描述:
“贝叶斯因子为BF01 = 10.76, 说明在(假定没有效应的)零假设下出现当前数据的可能性是在(假定存在效应的)备择假设下可能性的10.76倍。根据Jeffreys (1961)提出的分类标准, 这是较强的证据支持了零假设, 即在顺时针和立逆时针转钟表指针的人在经验开放性(NEO)得分上没有差异。”
此外, 使用贝叶斯因子进行分析时, 还可以报告探索性的结果, 如稳健分析和序列分析的结果, 这将进一步丰富结果, 给其他研究者提供更加全面的信息。
4 总结与展望
近年来, 科学研究的可重复问题备受关注(Baker, 2016; Begley & Ellis, 2012; Munafò et al., 2017), 在心理学(Ebersole et al., 2016; Klein et al., 2014; Open Science Collaboration, 2015)、神影像学(Poldrack et al., 2017; Zuo & Xing, 2014)尤其如此。而对NHST的过度依赖正是原因之一(Lindsay, 2015; 胡传鹏等, 2016)。因此, 研究者们希望贝叶斯因子作为一种假设检验方法, 能改变当前心理学研究过度依赖NHST的现状。当然, 也有研究者提出了其他的方案, 例如, 将显著性的阈限下降到0.005 (Benjamin et al., 2018)或是采用模型比较的似然性比(likelihood ratio) (Etz, in press)的方法。但是值得注意的是, 心理学研究重复失败的原因多种多样, 仅改变统计方法不能让心理学的研究变得可重复。数据不开放以及研究过程不透明(Chambers, Feredoes, Muthukumaraswamy, & Etchells, 2014; Lindsay, 2015; Nosek et al., 2015)、对探索性分析与验证性分析不加区分(Kerr, 1998; Wagenmakers, Wetzels, Borsboom, van der Maas, & Kievit, 2012)、以发表论文为核心的奖励体系(Nosek, Spies, & Motyl, 2012)等都可能是造成当前研究可重复率低的原因。因此从某种程度上来讲, 对数据分析过程与数据结果保持开放与透明是关键的解决方案(如, Poldrack & Gorgolewski, 2017; Zuo et al., 2014)。
即便如此, 作为一种不同于传统NHST的方法, 贝叶斯因子有助于研究者使用多种的方法对同一研究进行分析, 从而得到准确的统计推断, 得到更加接近真实的结论。需要指出的是, 采用多种方法进行分析时, 需要报告全部的分析过程和结果, 而非选择最有利于自己结论的分析结果进行报告。
4.1 贝叶斯因子的不足
贝叶斯因子是贝叶斯统计在假设检验方面的应用, 而贝叶斯学派与频率学派统计的争议一直存在(Miller, 2011)。实际上, 研究者指出贝叶斯因子也可能存在许多问题, 充分了解这些反对的观点, 将更加有利于我们在研究中合理地使用贝叶斯因子。
对贝叶斯因子最强烈的质疑来自于对其先验概率的设定, 可能会认为先验概率过于主观、过于保守从而不容易出现较强的证据等(Wagenmakers, Marsman, et al., 2017)。也有研究者认为, 默认的先验对小的效应不利。例如, Bem, Utts和Johnson (2011) 认为, Wagenmakers等人(2011)对Bem (2011)的数据进行重新分析时, 采用了不合适的先验概率是他们未能得到与Bem (2011)一致结论的原因。这种批评实质上是对贝叶斯因子的误用, 即未将先验知识转化成为合适的先验概率(Hoijtink, van Kooten, & Hulsker, 2016)。有趣的是, 只要研究者将自己使用的先验概率保持透明与公开, 其他研究者可以采用交叉验证, 从而起到充分探索的作用。
其次, 也有研究者认为, 贝叶斯因子没有考虑假阳性的问题。在NHST框架之下, 研究者非常强调控制一类错误与二类错误的问题。例如心理学研究中一般将一类错误控制在5%以内, 因此显著性水平设置为0.05。也正是需要控制一类错误, NHST框架之下有许多方法用来调整阈值使其一类错误率不至于太高, 例如多重比较校正的方法。而贝叶斯统计主要是为了不断地对证据的强度进行测量, 其不考虑控制假阳性(即一类错误)的问题。因此, 当研究者基于贝叶斯因子进行决策(效应是否存在)时, 就可能犯下一类错误(Kruschke & Liddell, 2017a)。在实际的贝叶斯因子分析中, 可以通过先验来解决多重比较的问题(Jeffreys, 1938; Scott & Berger, 2006, 2010)。例如, 直接说明研究者预期假阳性率有多大(Stephens & Balding, 2009)。
还有研究者指出, 基于估计的统计总是要比假设检验更优, 因为估计本身将不确定性考虑进来。例如, Cumming (2014)建议使用效应量及其置信区间以替代p值。但是考虑到参数估计与假设检验在科研中均有其相应最适用的问题, 因此贝叶斯因子无法直接与基于估计的频率主义学派统计进行比较。但是, 贝叶斯统计中, 也有基于估计的方法(Kruschke & Liddell, 2017b)。
最后, 贝叶斯因子进行假设检验, 本质上是证据的不断累积, 而非得到二分的结论。因此, 一次实验的结果可以被看作是试探性的, 研究者可以继续收集数据或者进行重复实验(Ly, Etz, Marsman, & Wagenmakers, 2017)。
4.2 贝叶斯因子的应用前景
贝叶斯因子作为基于贝叶斯统计的假设检验方法, 与NHST相比具有一些优势, 其使得研究者可以直接检验数据是否支持零假设, 不再受抽样意图和停止收集数据标准的影响, 从而更加灵活地进行数据分析。这些优势可能帮助心理学家更好地在研究过程中进行决策, 同时, 贝叶斯因子的采用也可以促进研究者去更加深入地理解贝叶斯方向法的适用范围以及前提条件等(Depaoli & van de Schoot, 2017)。
JASP的开发, 使用贝叶斯因子的计算和解读变得更加简便, 研究者即便没有很强的编程基础, 也能够使用JASP地进行贝叶斯因子分析。这可能有助于推动研究者更加广泛地使用贝叶斯因子。此外, JASP本身正在快速发展, 其功能的深度和广度正在不断地扩大, 新的方法和标准将不断地整合到软件之中, 可能帮助研究者更科学地进行研究。
参考文献
心理学可重复性危机两种根源的评估
心理学的可重复性危机有两大已知的根源:传统统计学中虚无假设显著性检验体系的局限,和心理学的学术传统中的弊端,本文以开放科学协作组2015年报告的数据为依据,试对这两个根源的影响作一粗略的估算。采用Goodman(1992)和Cumming(2008)提出的方法对传统统计体系所加诸于可重复性的限制加以分析后,估算的结果表明传统统计学体系的制约,虽然有举足轻重的影响,却远不能完全解释该报告中低至36%的可重复率,该报告所反映的状况,显然还另有重大的非统计学的根源。本文进一步用Ioannidis(2005)提出的模型对这类非统计学因素的影响加以分析。分析后得到的若干组人为偏差率和Ha真实概率的估算,表明在原来研究所获得的几乎清一色的阳性结果中,大约只有不到三分之一或更低的比例是真阳性,而且相当部分的阳性结果,可能由人为偏差所造成。这样的分析可比较具体地描述该类因素对当前可重复性危机的可能影响。
心理研究中引入贝叶斯统计推断的必要性、应用思路与领域
本文从科学范式演变和概率统计推断特征分析出发,就贝叶斯统计推断引入心理学的必要性、怎么应用、在哪些领域应用进行了论述。首先在分析科学范式演进各阶段统计推断任务需要、经典的频率概率统计推断不足基础上,得出科学范式处于危机和革命阶段时需要对相关理论做可信度检验。然后,在介绍贝叶斯定理及其统计推断的基础上,进一步分析了贝叶斯推断能解决理论可信度的多种假设检验情景。最后本文还就贝叶斯统计推断在心理学理论争鸣与建构、心理技术产品开发与评估具体领域应用做了分析。
An optimality property of Bayes' test statistics
DOI:10.2307/30250033
URL
[本文引用: 1]

The links between the British economy and the world economy are becoming more important every year. As a result, change in Britain and the rest of the world is now directly related as never before. But British research on urban and regional change has been slow to take account of this fact and, in general, remains committed to a view of the world in which the British economy stops at the shoreline of Britain and the world economy appears as a set of 0900external factors' or 0900macrotrends in the economy0964, or 0900international processes0964 that are conjured up by the outside world and then fed into the British economy as something called 0900restructuring0964. This parochial point of view, so inappropriate in the modern world, is illustrated by the Economic and Social Research Council Environment and Planning Committee document, 0904Research policy and priorities09.
1,500 scientists lift the lid on reproducibility
DOI:10.1038/533452a
URL
PMID:27225100
[本文引用: 1]
Survey sheds light on the ‘crisis’ rocking research.
Drug development: Raise standards for preclinical cancer research
DOI:10.1038/483531a URL [本文引用: 1]
Feeling the future: Experimental evidence for anomalous retroactive influences on cognition and affect
DOI:10.1037/a0021524
URL
PMID:21280961
[本文引用: 6]
Abstract The term psi denotes anomalous processes of information or energy transfer that are currently unexplained in terms of known physical or biological mechanisms. Two variants of psi are precognition (conscious cognitive awareness) and premonition (affective apprehension) of a future event that could not otherwise be anticipated through any known inferential process. Precognition and premonition are themselves special cases of a more general phenomenon: the anomalous retroactive influence of some future event on an individual's current responses, whether those responses are conscious or nonconscious, cognitive or affective. This article reports 9 experiments, involving more than 1,000 participants, that test for retroactive influence by "time-reversing" well-established psychological effects so that the individual's responses are obtained before the putatively causal stimulus events occur. Data are presented for 4 time-reversed effects: precognitive approach to erotic stimuli and precognitive avoidance of negative stimuli; retroactive priming; retroactive habituation; and retroactive facilitation of recall. The mean effect size (d) in psi performance across all 9 experiments was 0.22, and all but one of the experiments yielded statistically significant results. The individual-difference variable of stimulus seeking, a component of extraversion, was significantly correlated with psi performance in 5 of the experiments, with participants who scored above the midpoint on a scale of stimulus seeking achieving a mean effect size of 0.43. Skepticism about psi, issues of replication, and theories of psi are also discussed. (c) 2011 APA, all rights reserved
Must psychologists change the way they analyze their data?
DOI:10.1037/a0024777
URL
PMID:21928916
[本文引用: 1]
Wagenmakers, Wetzels, Borsboom, and van der Maas (2011) argued that psychologists should replace the familiar "frequentist" statistical analyses of their data with bayesian analyses. To illustrate their argument, they reanalyzed a set of psi experiments published recently in this journal by Bem (2011), maintaining that, contrary to his conclusion, his data do not yield evidence in favor of the psi hypothesis. We argue that they have incorrectly selected an unrealistic prior distribution for their analysis and that a bayesian analysis using a more reasonable distribution yields strong evidence in favor of the psi hypothesis. More generally, we argue that there are advantages to bayesian analyses that merit their increased use in the future. However, as Wagenmakers et al.'s analysis inadvertently revealed, they contain hidden traps that must be better understood before being more widely substituted for the familiar frequentist analyses currently employed by most research psychologists.
Redefine statistical significance
DOI:10.1038/s41562-017-0189-z URL [本文引用: 1]
Statistical analysis and the illusion of objectivity
DOI:10.1016/S0730-725X(97)00243-9
URL
[本文引用: 2]
Introduces the debate in statistical analysis between the subjectivists, or Bayesians, and the nonsubjectivists. Two situations where differences in interpretation arise; Testing of a precise hypothesis; Standard statistical approach; Bayesian approach; Analysis of accumulating data; Role of subjectivity. INSET: Calculating the Final Probability of H..
Testing precise hypotheses
DOI:10.1214/ss/1177013238 URL [本文引用: 1]
Stan: A probabilistic programming language
DOI:10.18637/jss.v076.i01
URL
[本文引用: 1]
Stan is a probabilistic programming language for specifying statistical models. A Stan program imperatively defines a log probability function over parameters conditioned on specified data and constants. As of version 2.14.0, Stan provides full Bayesian inference for continuous-variable models through Markov chain Monte Carlo methods such as the No-U-Turn sampler, an adaptive form of Hamiltonian Monte Carlo sampling. Penalized maximum likelihood estimates are calculated using optimization methods such as the limited memory Broyden-Fletcher-Goldfarb-Shanno algorithm. Stan is also a platform for computing log densities and their gradients and Hessians, which can be used in alternative algorithms such as variational Bayes, expectation propagation, and marginal inference using approximate integration. To this end, Stan is set up so that the densities, gradients, and Hessians, along with intermediate quantities of the algorithm such as acceptance probabilities, are easily accessible. Stan can be called from the command line using the cmdstan package, through R using the rstan package, and through Python using the pystan package. All three interfaces support sampling and optimization-based inference with diagnostics and posterior analysis. rstan and pystan also provide access to log probabilities, gradients, Hessians, parameter transforms, and specialized plotting.
Instead of “playing the game” it is time to change the rules: Registered Reports at AIMS Neuroscience and beyond
Reproducibility of R-fMRI metrics on the impact of different strategies for multiple comparison correction and sample sizes
DOI:10.1002/hbm.23843
URL
PMID:29024299
[本文引用: 1]
Reproducibility is one of the key defining features of science and plays a central role in knowledge accumulation. In the field of resting-state functional magnetic resonance imaging (R-fMRI), concerns regarding the reproducibility of findings have been raised. In response, we comprehensively assessed the reproducibility of widely used R-fMRI metrics and systematically investigated the impact of different strategies correcting for multiple comparisons and for small sample sizes. We found that multiple comparison correction strategies with liberal thresholds yield higher reproducibility but can dramatically increase the family wise error rate (FWER) to unacceptable levels. We noted permutation test with Threshold-Free Cluster Enhancement (TFCE), a strict multiple comparison correction strategy, reached the best balance between FWER (under 5%) and reproducibility (e.g., 0.68 for within-subject reproducibility of amplitude of low-frequency fluctuations). Although the sex differences in R-fMRI metrics can be moderately reproduced from a scan to another scan within subjects, they are poorly reproduced in another different dataset (between-subject reproducibility < 0.3). Among the brain regions showing the most reproducible sex differences, posterior cingulate cortex demonstrated consistent lower spontaneous activity in males than in females. Defining the most reproducible brain regions in two large sample datasets as -old standard-, we found that small sample size not only minimized power (sensitivity < 5%), but also decreased the likelihood that significant results reflect true effects. For the liberal multiple comparison correction, results were unlikely to reflect true effects (positive predictive value = 10%). Fortunately, voxels determined to be significant using permutation test with TFCE have a 71% probability of reflecting true effects. Our findings have implications for how to select multiple comparison correction strategies and highlight the need for sufficiently large sample sizes in future R-fMRI studies.
The new statistics: Why and how
DOI:10.1177/0956797613504966 URL [本文引用: 2]
Improving transparency and replication in Bayesian statistics: The WAMBS-Checklist
DOI:10.1037/met0000065
URL
PMID:26690773
[本文引用: 2]
Bayesian statistical methods are slowly creeping into all fields of science and are becoming ever more popular in applied research. Although it is very attractive to use Bayesian statistics, our personal experience has led us to believe that naively applying Bayesian methods can be dangerous for at least 3 main reasons: the potential influence of priors, misinterpretation of Bayesian features and results, and improper reporting of Bayesian results. To deal with these 3 points of potential danger, we have developed a succinct checklist: the WAMBS-checklist (When to worry and how to Avoid the Misuse of Bayesian Statistics). The purpose of the questionnaire is to describe 10 main points that should be thoroughly checked when applying Bayesian analysis. We provide an account of "when to worry" for each of these issues related to: (a) issues to check before estimating the model, (b) issues to check after estimating the model but before interpreting results, understanding the influence of priors, and (d) actions to take after interpreting results. To accompany these key points of concern, we will present diagnostic tools that can be used in conjunction with the development and assessment of a Bayesian model. We also include examples of how to interpret results when "problems" in estimation arise, as well as syntax and instructions for implementation. Our aim is to stress the importance of openness and transparency of all aspects of Bayesian estimation, and it is our hope that the WAMBS questionnaire can aid in this process.
Bayesian versus orthodox statistics: Which side are you on?
DOI:10.1177/1745691611406920
URL
PMID:26168518
[本文引用: 1]
Researchers are often confused about what can be inferred from significance tests. One problem occurs when people apply Bayesian intuitions to significance testing-two approaches that must be firmly separated. This article presents some common situations in which the approaches come to different conclusions; you can see where your intuitions initially lie. The situations include multiple testing, deciding when to stop running participants, and when a theory was thought of relative to finding out results. The interpretation of nonsignificant results has also been persistently problematic in a way that Bayesian inference can clarify. The Bayesian and orthodox approaches are placed in the context of different notions of rationality, and I accuse myself and others as having been irrational in the way we have been using statistics on a key notion of rationality. The reader is shown how to apply Bayesian inference in practice, using free online software, to allow more coherent inferences from data.
Using Bayes to get the most out of non-significant results
DOI:10.3389/fpsyg.2014.00781
URL
PMID:4114196
[本文引用: 3]
No scientific conclusion follows automatically from a statistically non-significant result, yet people routinely use non-significant results to guide conclusions about the status of theories (or the effectiveness of practices). To know whether a non-significant result counts against a theory, or if it just indicates data insensitivity, researchers must use one of: power, intervals (such as confidence or credibility intervals), or else an indicator of the relative evidence for one theory over another, such as a Bayes factor. I argue Bayes factors allow theory to be linked to data in a way that overcomes the weaknesses of the other approaches. Specifically, Bayes factors use the data themselves to determine their sensitivity in distinguishing theories (unlike power), and they make use of those aspects of a theory predictions that are often easiest to specify (unlike power and intervals, which require specifying the minimal interesting value in order to address theory). Bayes factors provide a coherent approach to determining whether non-significant results support a null hypothesis over a theory, or whether the data are just insensitive. They allow accepting and rejecting the null hypothesis to be put on an equal footing. Concrete examples are provided to indicate the range of application of a simple online Bayes calculator, which reveal both the strengths and weaknesses of Bayes factors.
Many Labs 3: Evaluating participant pool quality across the academic semester via replication
DOI:10.1016/j.jesp.2015.10.012
URL
[本文引用: 1]
The university participant pool is a key resource for behavioral research, and data quality is believed to vary over the course of the academic semester. This crowdsourced project examined time of semester variation in 10 known effects, 10 individual differences, and 3 data quality indicators over the course of the academic semester in 20 participant pools ( N 02=022696) and with an online sample ( N 02=02737). Weak time of semester effects were observed on data quality indicators, participant sex, and a few individual differences—conscientiousness, mood, and stress. However, there was little evidence for time of semester qualifying experimental or correlational effects. The generality of this evidence is unknown because only a subset of the tested effects demonstrated evidence for the original result in the whole sample. Mean characteristics of pool samples change slightly during the semester, but these data suggest that those changes are mostly irrelevant for detecting effects.
Tactical note on the relation between scientific and statistical hypotheses
DOI:10.1037/h0021967
URL
PMID:14314074
[本文引用: 1]
Abstract Grant, Binder, and others have debated what should be the appropriate relationship between the scientific hypotheses that a scientist is interested in and the customary procedures of classical statistical inference. Classical significance tests are violently biased against the null hypothesis. A conservative theorist will therefore associate his theory with the null hypothesis, while an enthusiast will not-nd they may often reach conflicting conclusions, whether or not the theory is correct. No procedure can satisfactorily test the goodness of fit of a single model to data. The remedy is to compare the fit of several models to the same data. Such procedures do not compare null with alternative hypotheses, and so are in this respect unbiased. (PsycINFO Database Record (c) 2012 APA, all rights reserved)
Bayesian statistical inference for psychological research
DOI:10.1037/h0044139
URL
[本文引用: 2]
Bayesian statistics, a currently controversial viewpoint concerning statistical inference, is based on a definition of probability as a particular measure of the opinions of ideally consistent people.
Introduction to the concept of likelihood and its applications
.
DOI:10.1177/2515245917744314
URL
We introduce the statistical concept known as likelihood and discuss how it underlies common Frequentist and Bayesian statistical methods. This article is suitable for researchers interested in understanding the basis of their statistical tools, and is also ideal for teachers to use in their classrooms to introduce the topic to students at a conceptual level.
Replication, statistical consistency, and publication bias
DOI:10.1016/j.jmp.2013.02.003
URL
[本文引用: 1]
Scientific methods of investigation offer systematic ways to gather information about the world; and in the field of psychology application of such methods should lead to a better understanding of human behavior. Instead, recent reports in psychological science have used apparently scientific methods to report strong evidence for unbelievable claims such as precognition. To try to resolve the apparent conflict between unbelievable claims and the scientific method many researchers turn to empirical replication to reveal the truth. Such an approach relies on the belief that true phenomena can be successfully demonstrated in well-designed experiments, and the ability to reliably reproduce an experimental outcome is widely considered the gold standard of scientific investigations. Unfortunately, this view is incorrect; and misunderstandings about replication contribute to the conflicts in psychological science. Because experimental effects in psychology are measured by statistics, there should almost always be some variability in the reported outcomes. An absence of such variability actually indicates that experimental replications are invalid, perhaps because of a bias to suppress contrary findings or because the experiments were run improperly. Recent investigations have demonstrated how to identify evidence of such invalid experiment sets and noted its appearance for prominent findings in experimental psychology. The present manuscript explores those investigative methods by using computer simulations to demonstrate their properties and limitations. The methods are shown to be a check on the statistical consistency of a set of experiments by comparing the reported power of the experiments with the reported frequency of statistical significance. Overall, the methods are extremely conservative about reporting inconsistency when experiments are run properly and reported fully. The manuscript also considers how to improve scientific practice to avoid inconsistency, and discusses criticisms of the investigative method.
The importance of proving the null
DOI:10.1037/a0015251
URL
PMID:2859953
[本文引用: 1]
Null hypotheses are simple, precise, and theoretically important. Conventional statistical analysis cannot support them; Bayesian analysis can. The challenge in a Bayesian analysis is to formulate a suitably vague alternative, because the vaguer the alternative is (the more it spreads out the unit mass of prior probability), the more the null is favored. A general solution is a sensitivity analysis: Compute the odds for or against the null as a function of the limit(s) on the vagueness of the alternative. If the odds on the null approach 1 from above as the hypothesized maximum size of the possible effect approaches 0, then the data favor the null over any vaguer alternative to it. The simple computations and the intuitive graphic representation of the analysis are illustrated by the analysis of diverse examples from the current literature. They pose 3 common experimental questions: (a) Are 2 means the same? (b) Is performance at chance? (c) Are factors additive?
Mindless statistics
DOI:10.1016/j.socec.2004.09.033 URL [本文引用: 1]
Statistical tests, P values, confidence intervals, and power: A guide to misinterpretations
DOI:10.1007/s10654-016-0149-3
URL
[本文引用: 2]
Misinterpretation and abuse of statistical tests, confidence intervals, and statistical power have been decried for decades, yet remain rampant. A key problem is that there are no interpretations of...
Bayesian evidence accumulation in experimental mathematics: A case study of four irrational numbers
DOI:10.1080/10586458.2016.1256006
URL
[本文引用: 1]
Many questions in experimental mathematics are fundamentally inductive in nature. Here we demonstrate how Bayesian inference --the logic of partial beliefs-- can be used to quantify the evidence that finite data provide in favor of a general law. As a concrete example we focus on the general law which posits that certain fundamental constants (i.e., the irrational numbers $\pi$, $e$, $\sqrt2$, and $\ln{2}$) are normal; specifically, we consider the more restricted hypothesis that each digit in the constant's decimal expansion occurs equally often. Our analysis indicates that for each of the four constants, the evidence in favor of the general law is overwhelming. We argue that the Bayesian paradigm is particularly apt for applications in experimental mathematics, a field in which the plausibility of a general law is in need of constant revision in light of data sets whose size is increasing continually and indefinitely.
The fickle P value generates irreproducible results
DOI:10.1038/nmeth.3288
URL
PMID:25719825
[本文引用: 1]
The reliability and reproducibility of science are under scrutiny. However, a major cause of this lack of repeatability is not being considered: the wide sample-to-sample variability in the P value. We explain why P is fickle to discourage the ill-informed practice of interpreting analyses based predominantly on this statistic.
Informative hypotheses: Theory and practice for behavioral and social scientists
Why Bayesian psychologists should change the way they use the Bayes factor
DOI:10.1080/00273171.2014.969364
URL
PMID:26881951
[本文引用: 1]
The discussion following Bem’s (2011) psi research highlights that applications of the Bayes factor in psychological research are not without problems. The first problem is the omission to translate subjective prior knowledge into subjective prior distributions. In the words of Savage (1961): “they make the Bayesian omelet without breaking the Bayesian egg.” The second problem occurs if the Bayesian egg isnotbroken: the omission to choose default prior distributions such that the ensuing inferences are well calibrated. The third problem is the adherence to inadequate rules for the interpretation of the size of the Bayes factor. The current paper will elaborate these problems and show how to avoid them using the basic hypotheses and statistical model used in the first experiment described in Bem (2011). It will be argued that a thorough investigation of these problems in the context of more encompassing hypotheses and statistical models is called for if Bayesian psychologists want to add a well-founded Bayes factor to the tool kit of psychological researchers.
Some tests of significance, treated by the theory of probability
DOI:10.1017/S030500410001330X URL [本文引用: 1]
Significance tests when several degrees of freedom arise simultaneously
DOI:10.1098/rspa.1938.0052
URL
[本文引用: 1]
Not Available
Revised standards for statistical evidence
DOI:10.1073/pnas.1313476110 URL [本文引用: 1]
HARKing: Hypothesizing after the results are known
DOI:10.1207/s15327957pspr0203_4
URL
PMID:15647155
[本文引用: 2]
Abstract This article considers a practice in scientific communication termed HARKing (Hypothesizing After the Results are Known). HARKing is defined as presenting a post hoc hypothesis (i.e., one based on or informed by one's results) in one's research report as i f it were, in fact, an a priori hypotheses. Several forms of HARKing are identified and survey data are presented that suggests that at least some forms of HARKing are widely practiced and widely seen as inappropriate. I identify several reasons why scientists might HARK. Then I discuss several reasons why scientists ought not to HARK. It is conceded that the question of whether HARKing ' s costs exceed its benefits is a complex one that ought to be addressed through research, open discussion, and debate. To help stimulate such discussion (and for those such as myself who suspect that HARKing's costs do exceed its benefits), I conclude the article with some suggestions for deterring HARKing.
Investigating variation in replicability: A “many labs” replication project
DOI:10.1027/1864-9335/a000178 URL
Inequality constrained analysis of variance: A Bayesian approach
DOI:10.1037/1082-989X.10.4.477
URL
PMID:16393001
[本文引用: 1]
Researchers often have one or more theories or expectations with respect to the outcome of their empirical research. When researchers talk about the expected relations between variables if a certain theory is correct, their statements are often in terms of one or more parameters expected to be larger or smaller than one or more other parameters. Stated otherwise, their statements are often formulated using inequality constraints. In this article, a Bayesian approach to evaluate analysis of variance or analysis of covariance models with inequality constraints on the (adjusted) means is presented. This evaluation contains two issues: estimation of the parameters given the restrictions using the Gibbs sampler and model selection using Bayes factors in the case of competing theories. The article concludes with two illustrations: a one-way analysis of covariance and an analysis of a three-way table of ordered means.
Bayesian data analysis for newcomers
DOI:10.3758/s13423-017-1272-1
URL
PMID:28405907
[本文引用: 1]
This article explains the foundational concepts of Bayesian data analysis using virtually no mathematical notation. Bayesian ideas already match your intuitions from everyday reasoning and from traditional data analysis. Simple examples of Bayesian data analysis are presented that illustrate how the information delivered by a Bayesian analysis can be directly interpreted. Bayesian approaches to null-value assessment are discussed. The article clarifies misconceptions about Bayesian methods that newcomers might have acquired elsewhere. We discuss prior distributions and explain how they are not a liability but an important asset. We discuss the relation of Bayesian data analysis to Bayesian models of mind, and we briefly discuss what methodological problems Bayesian data analysis is not meant to solve. After you have read this article, you should have a clear sense of how Bayesian data analysis works and the sort of information it delivers, and why that information is so intuitive and useful for drawing conclusions from data.
b). The Bayesian New Statistics: Hypothesis testing, estimation, meta-analysis, and power analysis from a Bayesian perspective
Equivalence tests: A practical primer for t-Tests, correlations, and meta-analyses
DOI:10.1177/1948550617697177 URL [本文引用: 1]
The analysis of experimental data: The appreciation of tea and wine
DOI:10.1111/j.1467-9639.1993.tb00252.x
URL
[本文引用: 1]
Summary A classical experiment on the tasting of tea is used to show that many standard methods of analysis of the resulting data are unsatisfactory. A similar experiment with wine is used to show how a more sensible method may be developed.
Replication in psychological science
DOI:10.1177/0956797615616374 URL [本文引用: 2]
The BUGS project: Evolution, critique and future directions
DOI:10.1002/sim.3680
URL
PMID:19630097
[本文引用: 1]
Abstract BUGS is a software package for Bayesian inference using Gibbs sampling. The software has been instrumental in raising awareness of Bayesian modelling among both academic and commercial communities internationally, and has enjoyed considerable success over its 20-year life span. Despite this, the software has a number of shortcomings and a principal aim of this paper is to provide a balanced critical appraisal, in particular highlighting how various ideas have led to unprecedented flexibility while at the same time producing negative side effects. We also present a historical overview of the BUGS project and some future perspectives.
Replication Bayes factors from evidence updating
Analytic posteriors for Pearson’s correlation coefficient
DOI:10.1111/stan.12111
URL
[本文引用: 1]
Abstract: Pearson's correlation is one of the most common measures of linear dependence. Recently, Bernardo (2015) introduced a flexible class of priors to study this measure in a Bayesian setting. For this large class of priors we show that the (marginal) posterior for Pearson's correlation coefficient and all of the posterior moments are analytic. Our results are available in the open-source software package JASP.
An evaluation of alternative methods for testing hypotheses, from the perspective of Harold Jeffreys
DOI:10.1016/j.jmp.2016.01.003
URL
[本文引用: 1]
Our original article provided a relatively detailed summary of Harold Jeffreys’s philosophy on statistical hypothesis testing. In response, Robert (2016) maintains that Bayes factors have a number of serious shortcomings. These shortcomings, Robert argues, may be addressed by an alternative approach that conceptualizes model selection as parameter estimation in a mixture model. In a second comment, Chandramouli and Shiffrin (2016) seek to extend Jeffreys’s framework by also taking into consideration data distributions that do not originate from either of the models under test. In this rejoinder we argue that Robert’s (2016) alternative view on testing has more in common with Jeffreys’s Bayes factor than he suggests, as they share the same “shortcomings”. On the other hand, we show that the proposition of Chandramouli and Shiffrin (2016) to extend the Bayes factor is in fact further removed from Jeffreys’s view on testing than the authors suggest. By elaborating on these points, we hope to clarify our case for Jeffreys’s Bayes factors.
Harold Jeffreys’s default Bayes factor hypothesis tests: Explanation, extension, and application in psychology
DOI:10.1016/j.jmp.2015.06.004
URL
[本文引用: 2]
Harold Jeffreys pioneered the development of default Bayes factor hypothesis tests for standard statistical problems. Using Jeffreys’s Bayes factor hypothesis tests, researchers can grade the decisiveness of the evidence that the data provide for a point null hypothesis H 0 H 0 mathContainer Loading Mathjax versus a composite alternative hypothesis H 1 H 1 mathContainer Loading Mathjax . Consequently, Jeffreys’s tests are of considerable theoretical and practical relevance for empirical researchers in general and for experimental psychologists in particular. To highlight this relevance and to facilitate the interpretation and use of Jeffreys’s Bayes factor tests we focus on two common inferential scenarios: testing the nullity of a normal mean (i.e.,the Bayesian equivalent of the t t mathContainer Loading Mathjax -test) and testing the nullity of a correlation. For both Bayes factor tests, we explain their development, we extend them to one-sided problems, and we apply them to concrete examples from experimental psychology.
Bayesian benefits with JASP
DOI:10.1080/17405629.2016.1259614 URL [本文引用: 1]
Three insights from a bayesian interpretation of the one-sided P value
DOI:10.1177/0013164416669201
URL
[本文引用: 1]
P values have been critiqued on several grounds but remain entrenched as the dominant inferential method in the empirical sciences. In this article, we elaborate on the fact that in many statistical models, the one-sided "P" value has a direct Bayesian interpretation as the approximate posterior mass for values lower than zero. The connection between the one-sided "P" value and posterior probability mass reveals three insights: (1) "P" values can be interpreted as Bayesian tests of direction, to be used only when the null hypothesis is known from the outset to be false; (2) as a measure of evidence, "P" values are biased against a point null hypothesis; and (3) with "N" fixed and effect size variable, there is an approximately linear relation between "P" values and Bayesian point null hypothesis tests.
A tutorial on a practical Bayesian alternative to null-hypothesis significance testing
DOI:10.3758/s13428-010-0049-5
URL
PMID:21302025
[本文引用: 1]
Null-hypothesis significance testing remains the standard inferential tool in cognitive science despite its serious disadvantages. Primary among these is the fact that the resulting probability value does not tell the researcher what he or she usually wants to know: How probable is a hypothesis, given the obtained data? Inspired by developments presented by Wagenmakers ( Psychonomic Bulletin & Review, 14 , 779-804, 2007 ), I provide a tutorial on a Bayesian model selection approach that requires only a simple transformation of sum-of-squares values generated by the standard analysis of variance. This approach generates a graded level of evidence regarding which model (e.g., effect absent [null hypothesis] vs. effect present [alternative hypothesis]) is more strongly supported by the data. This method also obviates admonitions never to speak of accepting the null hypothesis. An Excel worksheet for computing the Bayesian analysis is provided as supplemental material .
The effect of horizontal eye movements on free recall: A preregistered adversarial collaboration
DOI:10.1037/xge0000038
URL
PMID:25621378
[本文引用: 1]
A growing body of research has suggested that horizontal saccadic eye movements facilitate the retrieval of episodic in free recall and recognition tasks. Nevertheless, a minority of studies have failed to replicate this effect. This article attempts to resolve the inconsistent results by introducing a novel variant of proponent-skeptic collaboration. The proposed approach combines the features of adversarial collaboration and purely confirmatory preregistered research. Prior to data collection, the adversaries reached consensus on an optimal research design, formulated their expectations, and agreed to submit the findings to an academic journal regardless of the outcome. To increase transparency and secure the purely confirmatory nature of the investigation, the 2 parties set up a publicly available adversarial collaboration agreement that detailed the proposed design and all foreseeable aspects of the data analysis. As anticipated by the skeptics, a series of Bayesian hypothesis tests indicated that horizontal eye movements did not improve free recall performance. The skeptics suggested that the nonreplication may partly reflect the use of suboptimal and questionable research practices in earlier eye movement studies. The proponents countered this suggestion and used a p curve analysis to argue that the effect of horizontal eye movements on explicit did not merely reflect selective reporting.
ESP paper rekindles discussion about statistics
DOI:10.1126/science.331.6015.272
URL
PMID:21252321
[本文引用: 2]
Not Available
The fallacy of placing confidence in confidence intervals
DOI:10.3758/s13423-015-0947-8
URL
PMID:26450628
[本文引用: 1]
Interval estimates – estimates of parameters that include an allowance for sampling uncertainty – have long been touted as a key component of statistical analyses. There are several kinds of interval estimates, but the most popular are confidence intervals (CIs): intervals that contain the true parameter value in some known proportion of repeated samples, on average. The width of confidence intervals is thought to index the precision of an estimate; CIs are thought to be a guide to which parameter values are plausible or reasonable; and the confidence coefficient of the interval (e.g., 95 %) is thought to index the plausibility that the true parameter is included in the interval. We show in a number of examples that CIs do not necessarily have any of these properties, and can lead to unjustified or arbitrary inferences. For this reason, we caution against relying upon confidence interval theory to justify interval estimates, and suggest that other theories of interval estimation should be used instead.
Bayes factor approaches for testing interval null hypotheses
DOI:10.1037/a0024377
URL
PMID:21787084
[本文引用: 3]
Psychological theories are statements of constraint. The role of hypothesis testing in psychology is to test whether specific theoretical constraints hold in data. Bayesian statistics is well suited to the task of finding supporting evidence for constraint, because it allows for comparing evidence for 2 hypotheses against each another. One issue in hypothesis testing is that constraints may hold only approximately rather than exactly, and the reason for small deviations may be trivial or uninteresting. In the large-sample limit, these uninteresting, small deviations lead to the rejection of a useful constraint. In this article, we develop several Bayes factor 1-sample tests for the assessment of approximate equality and ordinal constraints. In these tests, the null hypothesis covers a small interval of non-0 but negligible effect sizes around 0. These Bayes factors are alternatives to previously developed Bayes factors, which do not allow for interval null hypotheses, and may especially prove useful to researchers who use statistical equivalence testing. To facilitate adoption of these Bayes factor tests, we provide easy-to-use software.
Bayesian model selection of informative hypotheses for repeated measurements
DOI:10.1016/j.jmp.2009.09.003
URL
[本文引用: 1]
When analyzing repeated measurements data, researchers often have expectations about the relations between the measurement means. The expectations can often be formalized using equality and inequality constraints between (i) the measurement means over time, (ii) the measurement means between groups, (iii) the means adjusted for time-invariant covariates, and (iv) the means adjusted for time-varying covariates. The result is a set of informative hypotheses. In this paper, the Bayes factor is used to determine which hypothesis receives most support from the data. A pivotal element in the Bayesian framework is the specification of the prior. To avoid subjective prior specification, training data in combination with restrictions on the measurement means are used to obtain so-called constrained posterior priors. A simulation study and an empirical example from developmental psychology show that this prior results in Bayes factors with desirable properties.
A manifesto for reproducible science
DOI:10.1038/s41562-016-0021
URL
[本文引用: 1]
Improving the reliability and efficiency of scientific research will increase the credibility of the published scientific literature and accelerate discovery. Here we argue for the adoption of measures to optimize key elements of the scientific process: methods, reporting and dissemination, reproducibility, evaluation and incentives. There is some evidence from both simulations and empirical studies supporting the likely effectiveness of these measures, but their broad adoption by researchers, institutions, funders and journals will require iterative evaluation and improvement. We discuss the goals of these measures, and how they can be implemented, in the hope that this will facilitate action toward improving the transparency, reproducibility and efficiency of scientific research.
Promoting an open research culture
DOI:10.1126/science.aab2374 URL
Scientific Utopia: II. Restructuring incentives and practices to promote truth over publishability
DOI:10.1177/1745691612459058 URL [本文引用: 3]
Estimating the reproducibility of psychological science
JAGS: A program for analysis of Bayesian graphical models using Gibbs sampling
Scanning the horizon: Towards transparent and reproducible neuroimaging research
DOI:10.1038/nrn.2016.167
URL
PMID:28053326
[本文引用: 1]
Functional neuroimaging techniques have transformed our ability to probe the neurobiological basis of behaviour and are increasingly being applied by the wider neuroscience community. However, concerns have recently been raised that the conclusions that are drawn from some human neuroimaging studies are either spurious or not generalizable. Problems such as low statistical power, flexibility in data analysis, software errors and a lack of direct replication apply to many fields, but perhaps particularly to functional MRI. Here, we discuss these problems, outline current and suggested best practices, and describe how we think the field should evolve to produce the most meaningful and reliable answers to neuroscientific questions.
OpenfMRI: Open sharing of task fMRI data
DOI:10.1016/j.neuroimage.2015.05.073
URL
PMID:4669234
OpenfMRI is a repository for the open sharing of task-based fMRI data. Here we outline its goals, architecture, and current status of the repository, as well as outlining future plans for the project.
Optional stopping: No problem for Bayesians
DOI:10.3758/s13423-014-0595-4
URL
PMID:24659049
[本文引用: 3]
Abstract Optional stopping refers to the practice of peeking at data and then, based on the results, deciding whether or not to continue an experiment. In the context of ordinary significance-testing analysis, optional stopping is discouraged, because it necessarily leads to increased type I error rates over nominal values. This article addresses whether optional stopping is problematic for Bayesian inference with Bayes factors. Statisticians who developed Bayesian methods thought not, but this wisdom has been challenged by recent simulation results of Yu, Sprenger, Thomas, and Dougherty (2013) and Sanborn and Hills (2013). In this article, I show through simulation that the interpretation of Bayesian quantities does not depend on the stopping rule. Researchers using Bayesian methods may employ optional stopping in their own research and may provide Bayesian analysis of secondary data regardless of the employed stopping rule. I emphasize here the proper interpretation of Bayesian quantities as measures of subjective belief on theoretical positions, the difference between frequentist and Bayesian interpretations, and the difficulty of using frequentist intuition to conceptualize the Bayesian approach.
A Bayes factor meta-analysis of Bem’s ESP claim
DOI:10.3758/s13423-011-0088-7
URL
PMID:21573926
[本文引用: 3]
Abstract In recent years, statisticians and psychologists have provided the critique that p-values do not capture the evidence afforded by data and are, consequently, ill suited for analysis in scientific endeavors. The issue is particular salient in the assessment of the recent evidence provided for ESP by Bem (2011) in the mainstream Journal of Personality and Social Psychology. Wagenmakers, Wetzels, Borsboom, and van der Maas (Journal of Personality and Social Psychology, 100, 426-432, 2011) have provided an alternative Bayes factor assessment of Bem's data, but their assessment was limited to examining each experiment in isolation. We show here that the variant of the Bayes factor employed by Wagenmakers et al. is inappropriate for making assessments across multiple experiments, and cannot be used to gain an accurate assessment of the total evidence in Bem's data. We develop a meta-analytic Bayes factor that describes how researchers should update their prior beliefs about the odds of hypotheses in light of data across several experiments. We find that the evidence that people can feel the future with neutral and erotic stimuli to be slight, with Bayes factors of 3.23 and 1.57, respectively. There is some evidence, however, for the hypothesis that people can feel the future with emotionally valenced nonerotic stimuli, with a Bayes factor of about 40. Although this value is certainly noteworthy, we believe it is orders of magnitude lower than what is required to overcome appropriate skepticism of ESP.
Default Bayes factors for ANOVA designs
DOI:10.1016/j.jmp.2012.08.001 URL [本文引用: 1]
Bayesian analysis of factorial designs
DOI:10.1037/met0000057
URL
PMID:27280448
[本文引用: 6]
Abstract This article provides a Bayes factor approach to multiway analysis of variance (ANOVA) that allows researchers to state graded evidence for effects or invariances as determined by the data. ANOVA is conceptualized as a hierarchical model where levels are clustered within factors. The development is comprehensive in that it includes Bayes factors for fixed and random effects and for within-subjects, between-subjects, and mixed designs. Different model construction and comparison strategies are discussed, and an example is provided. We show how Bayes factors may be computed with BayesFactor package in R and with the JASP statistical package. (PsycINFO Database Record
Bayesian t tests for accepting and rejecting the null hypothesis
The lady tasting tea: How statistics revolutionized science in the twentieth century
Probabilistic programming in Python using PyMC3
DOI:10.7717/peerj-cs.55
URL
[本文引用: 1]
Probabilistic programming (PP) allows flexible specification of Bayesian statistical models in code. PyMC3 is a new, open-source PP framework with an intutive and readable, yet powerful, syntax that is close to the natural syntax statisticians use to describe models. It features next-generation Markov chain Monte Carlo (MCMC) sampling algorithms such as the No-U-Turn Sampler (NUTS; Hoffman, 2014), a self-tuning variant of Hamiltonian Monte Carlo (HMC; Duane, 1987). Probabilistic programming in Python confers a number of advantages including multi-platform compatibility, an expressive yet clean and readable syntax, easy integration with other scientific libraries, and extensibility via C, C++, Fortran or Cython. These features make it relatively straightforward to write and use custom statistical distributions, samplers and transformation functions, as required by Bayesian analysis.
P values: What they are and what they are not
DOI:10.2307/2684655
URL
[本文引用: 1]
P values (or significance probabilities) have been used in place of hypothesis tests as a means of giving more information about the relationship between the data and the hypothesis than does a simple reject/do not reject decision. Virtually all elementary statistics texts cover the calculation of P values for one-sided and point-null hypotheses concerning the mean of a sample from a normal distribution. There is, however, a third case that is intermediate to the one-sided and point-null cases, namely the interval hypothesis, that receives no coverage in elementary texts. We show that P values are continuous functions of the hypothesis for fixed data. This allows a unified treatment of all three types of hypothesis testing problems. It also leads to the discovery that a common informal use of P values as measures of support or evidence for hypotheses has serious logical flaws.
Applied statistical decision theory
Sequential hypothesis testing with Bayes factors: Efficiently testing mean differences
DOI:10.1037/met0000061
URL
PMID:26651986
[本文引用: 1]
Unplanned optional stopping rules have been criticized for inflating Type I error rates under the null hypothesis significance testing (NHST) paradigm. Despite these criticisms, this research practice is not uncommon, probably because it appeals to researcher's intuition to collect more data to push an indecisive result into a decisive region. In this contribution, we investigate the properties of a procedure for Bayesian hypothesis testing that allows optional stopping with unlimited multiple testing, even after each participant. In this procedure, which we call Sequential Bayes Factors (), Bayes factors are computed until an a priori defined level of evidence is reached. This allows flexible sampling plans and is not dependent upon correct effect size guesses in an a priori power analysis. We investigated the long-term rate of misleading evidence, the average expected sample sizes, and the biasedness of effect size estimates when an design is applied to a test of mean differences between 2 groups. Compared with optimal NHST, the design typically needs 50% to 70% smaller samples to reach a conclusion about the presence of an effect, while having the same or lower long-term rate of wrong inference. (PsycINFO Database Record.
An exploration of aspects of Bayesian multiple testing
DOI:10.1016/j.jspi.2005.08.031
URL
[本文引用: 1]
There has been increased interest of late in the Bayesian approach to multiple testing (often called the multiple comparisons problem), motivated by the need to analyze DNA microarray data in which it is desired to learn which of potentially several thousand genes are activated by a particular stimulus. We study the issue of prior specification for such multiple tests; computation of key posterior quantities; and useful ways to display these quantities. A decision-theoretic approach is also considered.
Bayes and empirical- Bayes multiplicity adjustment in the variable-selection problem
DOI:10.1214/10-AOS792
URL
[本文引用: 1]
This paper studies the multiplicity-correction effect of standard Bayesian variable-selection priors in linear regression. Our first goal is to clarify when, and how, multiplicity correction happens automatically in Bayesian analysis, and to distinguish this correction from the Bayesian Ockham's-razor effect. Our second goal is to contrast empirical-Bayes and fully Bayesian approaches to variable selection through examples, theoretical results and simulations. Considerable differences between the two approaches are found. In particular, we prove a theorem that characterizes a surprising aymptotic discrepancy between fully Bayes and empirical Bayes. This discrepancy arises from a different source than the failure to account for hyperparameter uncertainty in the empirical-Bayes estimate. Indeed, even at the extreme, when the empirical-Bayes estimate converges asymptotically to the true variable-inclusion probability, the potential for a serious difference remains.
Calibration of ρ values for testing precise null hypotheses
DOI:10.1198/000313001300339950
URL
[本文引用: 1]
P values are the most commonly used tool to measure evidence against a hypothesis or hypothesized model. Unfortunately, they are often incorrectly viewed as an error probability for rejection of the hypothesis or, even worse, as the posterior probability that the hypothesis is true. The fact that these interpretations can be completely misleading when testing precise hypotheses is first reviewed, through consideration of two revealing simulations. Then two calibrations of a value are developed, the first being interpretable as odds and the second as either a (conditional) frequentist error probability or as the posterior probability of the hypothesis.
Bayesian statistical methods for genetic association studies
DOI:10.1038/nrg2615
URL
PMID:1976315119763151
[本文引用: 2]
Bayesian statistical methods have recently made great inroads into many areas of science, and this advance is now extending to the assessment of association between genetic variants and disease or other phenotypes. We review these methods, focusing on single-SNP tests in genome-wide association studies. We discuss the advantages of the Bayesian approach over classical (frequentist) approaches in this setting and provide a tutorial on basic analysis steps, including practical guidelines for appropriate prior specification. We demonstrate the use of Bayesian methods for fine mapping in candidate regions, discuss meta-analyses and provide guidance for refereeing manuscripts that contain Bayesian analyses.
Tall claims? Sense and nonsense about the importance of height of US presidents
DOI:10.1016/j.leaqua.2012.09.002
URL
[本文引用: 1]
According to both the scientific literature and popular media, all one needs to win a US presidential election is to be taller than one's opponent. Yet, such claims are often based on an arbitrary selection of elections, and inadequate statistical analysis. Using data on all presidential elections, we show that height is indeed an important factor in the US presidential elections. Candidates that were taller than their opponents received more popular votes, although they were not significantly more likely to win the actual election. Taller presidents were also more likely to be reelected. In addition, presidents were, on average, much taller than men from the same birth cohort. The advantage of taller candidates is potentially explained by perceptions associated with height: taller presidents are rated by experts as 'greater', and having more leadership and communication skills. We conclude that height is an important characteristic in choosing and evaluating political leaders. (C) 2012 Elsevier Inc. All rights reserved.
Turning the hands of time
DOI:10.1177/1948550611419266
URL
[本文引用: 5]
ABSTRACT The omnipresent abstract symbol for time progression and regression is clockwise versus counterclockwise rotation. It was tested whether merely executing and seeing clockwise (vs. counterclockwise) movements would induce psychological states of temporal progression (vs. regression) and according to motivational orientations toward the future and novelty (vs. the past and familiarity). Supporting this hypothesis, participants who turned cranks counterclockwise preferred familiar over novel stimuli, but participants who turned cranks clockwise preferred novel over old stimuli, reversing the classic mere exposure effect (Experiment 1). Also, participants rotating a cylinder clockwise reported higher scores in the personality measure openness to experience than participants rotating counterclockwise (Experiment 2). Merely passively watching a rotating square had similar but weaker effects on exposure and openness (Experiment 3). Finally, participants chose more unconventional candies from a clockwise than from a counterclockwise Lazy Susan, that is, a turntable (Experiment 4).
A systematic review of Bayesian papers in psychology: The last 25 years
DOI:10.1037/met0000100
URL
PMID:28594224
Abstract Although the statistical tools most often used by researchers in the field of psychology over the last 25 years are based on frequentist statistics, it is often claimed that the alternative Bayesian approach to statistics is gaining in popularity. In the current article, we investigated this claim by performing the very first systematic review of Bayesian psychological articles published between 1990 and 2015 (n = 1,579). We aim to provide a thorough presentation of the role Bayesian statistics plays in psychology. This historical assessment allows us to identify trends and see how Bayesian methods have been integrated into psychological research in the context of different statistical frameworks (e.g., hypothesis testing, cognitive models, IRT, SEM, etc.). We also describe take-home messages and provide "big-picture" recommendations to the field as Bayesian statistics becomes more popular. Our review indicated that Bayesian statistics is used in a variety of contexts across subfields of psychology and related disciplines. There are many different reasons why one might choose to use Bayes (e.g., the use of priors, estimating otherwise intractable models, modeling uncertainty, etc.). We found in this review that the use of Bayes has increased and broadened in the sense that this methodology can be used in a flexible manner to tackle many different forms of questions. We hope this presentation opens the door for a larger discussion regarding the current state of Bayesian statistics, as well as future trends. (PsycINFO Database Record (c) 2017 APA, all rights reserved).
Prior sensitivity in theory testing: An apologia for the Bayes factor
DOI:10.1016/j.jmp.2010.07.003
URL
[本文引用: 1]
A commonly voiced concern with the Bayes factor is that, unlike many other Bayesian and non-Bayesian quantitative measures of model evaluation, it is highly sensitive to the parameter prior. This paper argues that, when dealing with psychological models that are quantitatively instantiated theories, being sensitive to the prior is an attractive feature of a model evaluation measure. This assertion follows from the observation that in psychological models parameters are not completely unknown, but correspond to psychological variables about which theory often exists. This theory can be formally captured in the prior range and prior distribution of the parameters, indicating which parameter values are allowed, likely, unlikely and forbidden. Because the prior is a vehicle for expressing psychological theory, it should, like the model equation, be considered as an integral part of the model. It is argued that the combined practice of building models using informative priors, and evaluating models using prior sensitive measures advances knowledge.
A practical solution to the pervasive problems of p values
DOI:10.3758/BF03194105
URL
PMID:18087943
[本文引用: 1]
In the field of psychology, the practice of p value null-hypothesis testing is as widespread as ever. Despite this popularity, or perhaps because of it, most psychologists are not aware of the statistical peculiarities of the p value procedure. In particular, p values are based on data that were never observed, and these hypothetical data are themselves influenced by subjective intentions. Moreover, p values do not quantify statistical evidence. This article reviews these p value problems and illustrates each problem with concrete examples. The three problems are familiar to statisticians but may be new to psychologists. A practical solution to these p value problems is to adopt a model selection perspective and use the Bayesian information criterion (BIC) for statistical inference (Raftery, 1995). The BIC provides an approximation to a Bayesian hypothesis test, does not require the specification of priors, and can be easily calculated from SPSS output.
Turning the hands of time again: A purely confirmatory replication study and a Bayesian analysis
DOI:10.3389/fpsyg.2015.00494
URL
PMID:25964771
[本文引用: 5]
Abstract In a series of four experiments, Topolinski and Sparenberg (2012) found support for the conjecture that clockwise movements induce psychological states of temporal progression and an orientation toward the future and novelty. Here we report the results of a preregistered replication attempt of Experiment 2 from Topolinski and Sparenberg (2012). Participants turned kitchen rolls either clockwise or counterclockwise while answering items from a questionnaire assessing openness to experience. Data from 102 participants showed that the effect went slightly in the direction opposite to that predicted by Topolinski and Sparenberg (2012), and a preregistered Bayes factor hypothesis test revealed that the data were 10.76 times more likely under the null hypothesis than under the alternative hypothesis. Our findings illustrate the theoretical importance and practical advantages of preregistered Bayes factor replication studies, both for psychological science and for empirical work in general.
Bayesian hypothesis testing for psychologists: A tutorial on the Savage-Dickey method
DOI:10.1016/j.cogpsych.2009.12.001
URL
PMID:20064637
[本文引用: 1]
In the field of cognitive psychology, the p-value hypothesis test has established a stranglehold on statistical reporting. This is unfortunate, as the p-value provides at best a rough estimate of the evidence that the data provide for the presence of an experimental effect. An alternative and arguably more appropriate measure of evidence is conveyed by a Bayesian hypothesis test, which prefers the model with the highest average likelihood. One of the main problems with this Bayesian hypothesis test, however, is that it often requires relatively sophisticated numerical methods for its computation. Here we draw attention to the Savage–Dickey density ratio method, a method that can be used to compute the result of a Bayesian hypothesis test for nested models and under certain plausible restrictions on the parameter priors. Practical examples demonstrate the method’s validity, generality, and flexibility.
Bayesian inference for psychology. Part II: Example applications with JASP
DOI:10.3758/s13423-017-1323-7
URL
PMID:28685272
[本文引用: 4]
Abstract Bayesian hypothesis testing presents an attractive alternative to p value hypothesis testing. Part I of this series outlined several advantages of Bayesian hypothesis testing, including the ability to quantify evidence and the ability to monitor and update this evidence as data come in, without the need to know the intention with which the data were collected. Despite these and other practical advantages, Bayesian hypothesis tests are still reported relatively rarely. An important impediment to the widespread adoption of Bayesian tests is arguably the lack of user-friendly software for the run-of-the-mill statistical problems that confront psychologists for the analysis of almost every experiment: the t-test, ANOVA, correlation, regression, and contingency tables. In Part II of this series we introduce JASP ( http://www.jasp-stats.org ), an open-source, cross-platform, user-friendly graphical software package that allows users to carry out Bayesian hypothesis tests for standard statistical problems. JASP is based in part on the Bayesian analyses implemented in Morey and Rouder's BayesFactor package for R. Armed with JASP, the practical advantages of Bayesian hypothesis testing are only a mouse click away.
Bayesian inference for psychology. Part I: Theoretical advantages and practical ramifications
DOI:10.3758/s13423-017-1343-3
URL
[本文引用: 3]
Bayesian parameter estimation and Bayesian hypothesis testing present attractive alternatives to classical inference using confidence intervals and p values. In part I of this series we outline ten prominent advantages of the Bayesian approach. Many of these advantages translate to concrete opportunities for pragmatic researchers. For instance, Bayesian hypothesis testing allows researchers to quantify evidence and monitor its progression as data come in, without needing to know the intention with which the data were collected. We end by countering several objections to Bayesian hypothesis testing. Part II of this series discusses JASP, a free and open source software program that makes it easy to conduct Bayesian estimation and testing for a range of popular statistical scenarios (Wagenmakers et al. this issue ).
The need for Bayesian hypothesis testing in psychological science
DOI:10.1002/9781119095910.ch8
URL
[本文引用: 2]
Abstract This chapter explains why the logic behind p-value significance tests is faulty, leading researchers to mistakenly believe that their results are diagnostic when they are not. It outlines a Bayesian alternative that overcomes the flaws of the p-value procedure, and provides researchers with an honest assessment of the evidence against or in favor of the null hypothesis. The p-value is the probability of encountering the value of a test statistic at least as extreme as the one that was observed, given that the null hypothesis is true. The logic that underlies the p-value as a measure of evidence is based on what is known as Fisher's disjunction. The chapter focuses on an inherent weakness of p-value: the fact that they depend only on what is expected under the null hypothesis H 0, what is expected under an alternative hypothesis H 1 is simply not taken into consideration.
Why psychologists must change the way they analyze their data: The case of psi: Comment on Bem (2011)
DOI:10.1037/a0022790
URL
PMID:212809651
[本文引用: 2]
Does psi exist? D. J. Bem (2011) conducted 9 studies with over 1,000 participants in an attempt to demonstrate that future events retroactively affect people's responses. Here we discuss several limitations of Bem's experiments on psi; in particular, we show that the data analysis was partly exploratory and that one-sided p values may overstate the statistical evidence against the null hypothesis. We reanalyze Bem's data with a default Bayesian t test and show that the evidence for psi is weak to nonexistent. We argue that in order to convince a skeptical audience of a controversial claim, one needs to conduct strictly confirmatory studies and analyze the results with statistical tests that are conservative rather than liberal. We conclude that Bem's p values do not indicate evidence in favor of precognition; instead, they indicate that experimental psychologists need to change the way they conduct their experiments and analyze their data.
An agenda for purely confirmatory research
DOI:10.1177/1745691612463078
URL
PMID:26168122
[本文引用: 1]
Abstract The veracity of substantive research claims hinges on the way experimental data are collected and analyzed. In this article, we discuss an uncomfortable fact that threatens the core of psychology's academic enterprise: almost without exception, psychologists do not commit themselves to a method of data analysis before they see the actual data. It then becomes tempting to fine tune the analysis to the data in order to obtain a desired result-a procedure that invalidates the interpretation of the common statistical tests. The extent of the fine tuning varies widely across experiments and experimenters but is almost impossible for reviewers and readers to gauge. To remedy the situation, we propose that researchers preregister their studies and indicate in advance the analyses they intend to conduct. Only these analyses deserve the label "confirmatory," and only for these analyses are the common statistical tests valid. Other analyses can be carried out but these should be labeled "exploratory." We illustrate our proposal with a confirmatory replication attempt of a study on extrasensory perception. The Author(s) 2012.
The ASA's statement on p-values: Context, process, and purpose
Statistical evidence in experimental psychology: An empirical comparison ssing 855 t tests
DOI:10.1177/1745691611406923
URL
[本文引用: 1]
Statistical inference in psychology has traditionally relied heavily on p-value significance testing. This approach to drawing conclusions from data, however, h...
Big Learning with Bayesian methods
DOI:10.1093/nsr/nwx044
URL
[本文引用: 1]
The explosive growth in data volume and the availability of cheap computing resources have sparked increasing interest in Big learning, an emerging subfield that studies scalable machine learning algorithms,systems and applications with Big Data. Bayesian methods represent one important class of statistical methods for machine learning, with substantial recent developments on adaptive, flexible and scalable Bayesian learning. This article provides a survey of the recent advances in Big learning with Bayesian methods, termed Big Bayesian Learning, including non-parametric Bayesian methods for adaptively inferring model complexity, regularized Bayesian inference for improving the flexibility via posterior regularization, and scalable algorithms and systems based on stochastic subsampling and distributed computing for dealing with large-scale applications. We also provide various new perspectives on the large-scale Bayesian modeling and inference.
An open science resource for establishing reliability and reproducibility in functional connectomics
DOI:10.1038/sdata.2014.49
URL
PMID:25977800
[本文引用: 1]
Abstract Efforts to identify meaningful functional imaging-based biomarkers are limited by the ability to reliably characterize inter-individual differences in human brain function. Although a growing number of connectomics-based measures are reported to have moderate to high test-retest reliability, the variability in data acquisition, experimental designs, and analytic methods precludes the ability to generalize results. The Consortium for Reliability and Reproducibility (CoRR) is working to address this challenge and establish test-retest reliability as a minimum standard for methods development in functional connectomics. Specifically, CoRR has aggregated 1,629 typical individuals' resting state fMRI (rfMRI) data (5,093 rfMRI scans) from 18 international sites, and is openly sharing them via the International Data-sharing Neuroimaging Initiative (INDI). To allow researchers to generate various estimates of reliability and reproducibility, a variety of data acquisition procedures and experimental designs are included. Similarly, to enable users to assess the impact of commonly encountered artifacts (for example, motion) on characterizations of inter-individual variation, datasets of varying quality are included.
Test-retest reliabilities of resting-state FMRI measurements in human brain functional connectomics: A systems neuroscience perspective
DOI:10.1016/j.neubiorev.2014.05.009
URL
PMID:24875392
[本文引用: 1]
Abstract Resting-state functional magnetic resonance imaging (RFMRI) enables researchers to monitor fluctuations in the spontaneous brain activities of thousands of regions in the human brain simultaneously, representing a popular tool for macro-scale functional connectomics to characterize normal brain function, mind-brain associations, and the various disorders. However, the test-retest reliability of RFMRI remains largely unknown. We review previously published papers on the test-retest reliability of voxel-wise metrics and conduct a meta-summary reliability analysis of seven common brain networks. This analysis revealed that the heteromodal associative (default, control, and attention) networks were mostly reliable across the seven networks. Regarding examined metrics, independent component analysis with dual regression, local functional homogeneity and functional homotopic connectivity were the three mostly reliable RFMRI metrics. These observations can guide the use of reliable metrics and further improvement of test-retest reliability for other metics in functional connectomics. We discuss the main issues with low reliability related to sub-optimal design and the choice of data processing options. Future research should use large-sample test-retest data to rectify both the within-subject and between-subject variability of RFMRI measurements and accelerate the application of functional connectomics. Copyright 2014 Elsevier Ltd. All rights reserved.
