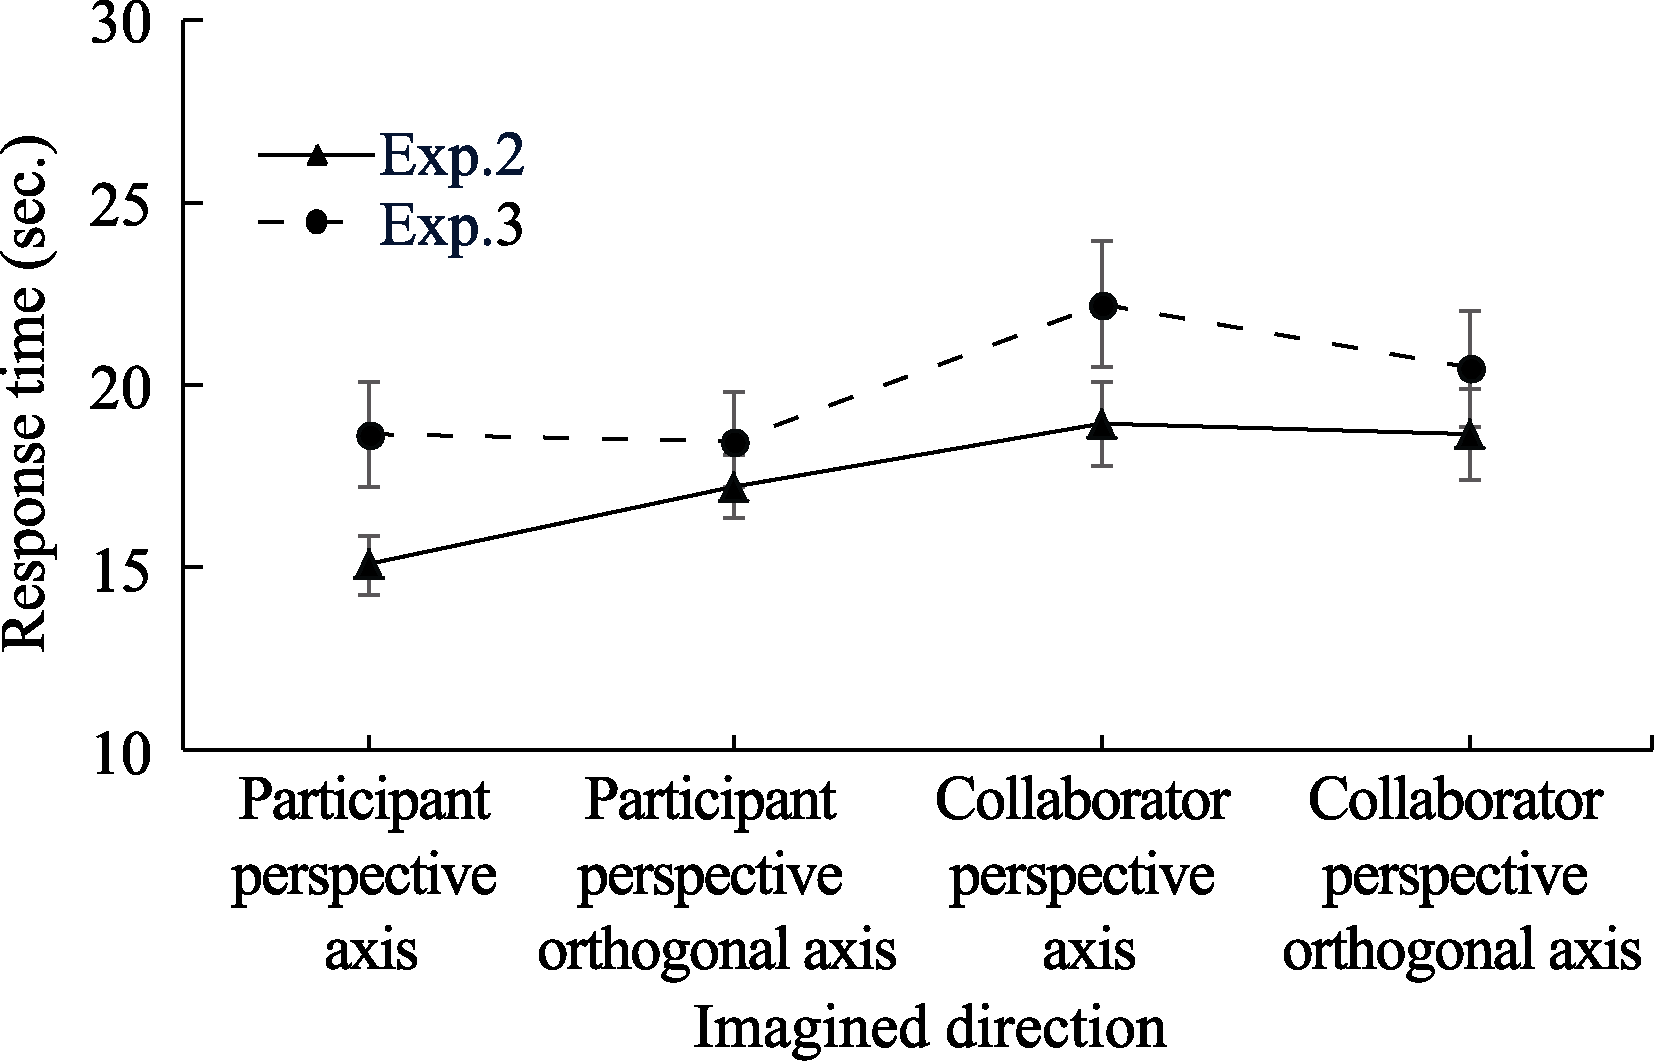
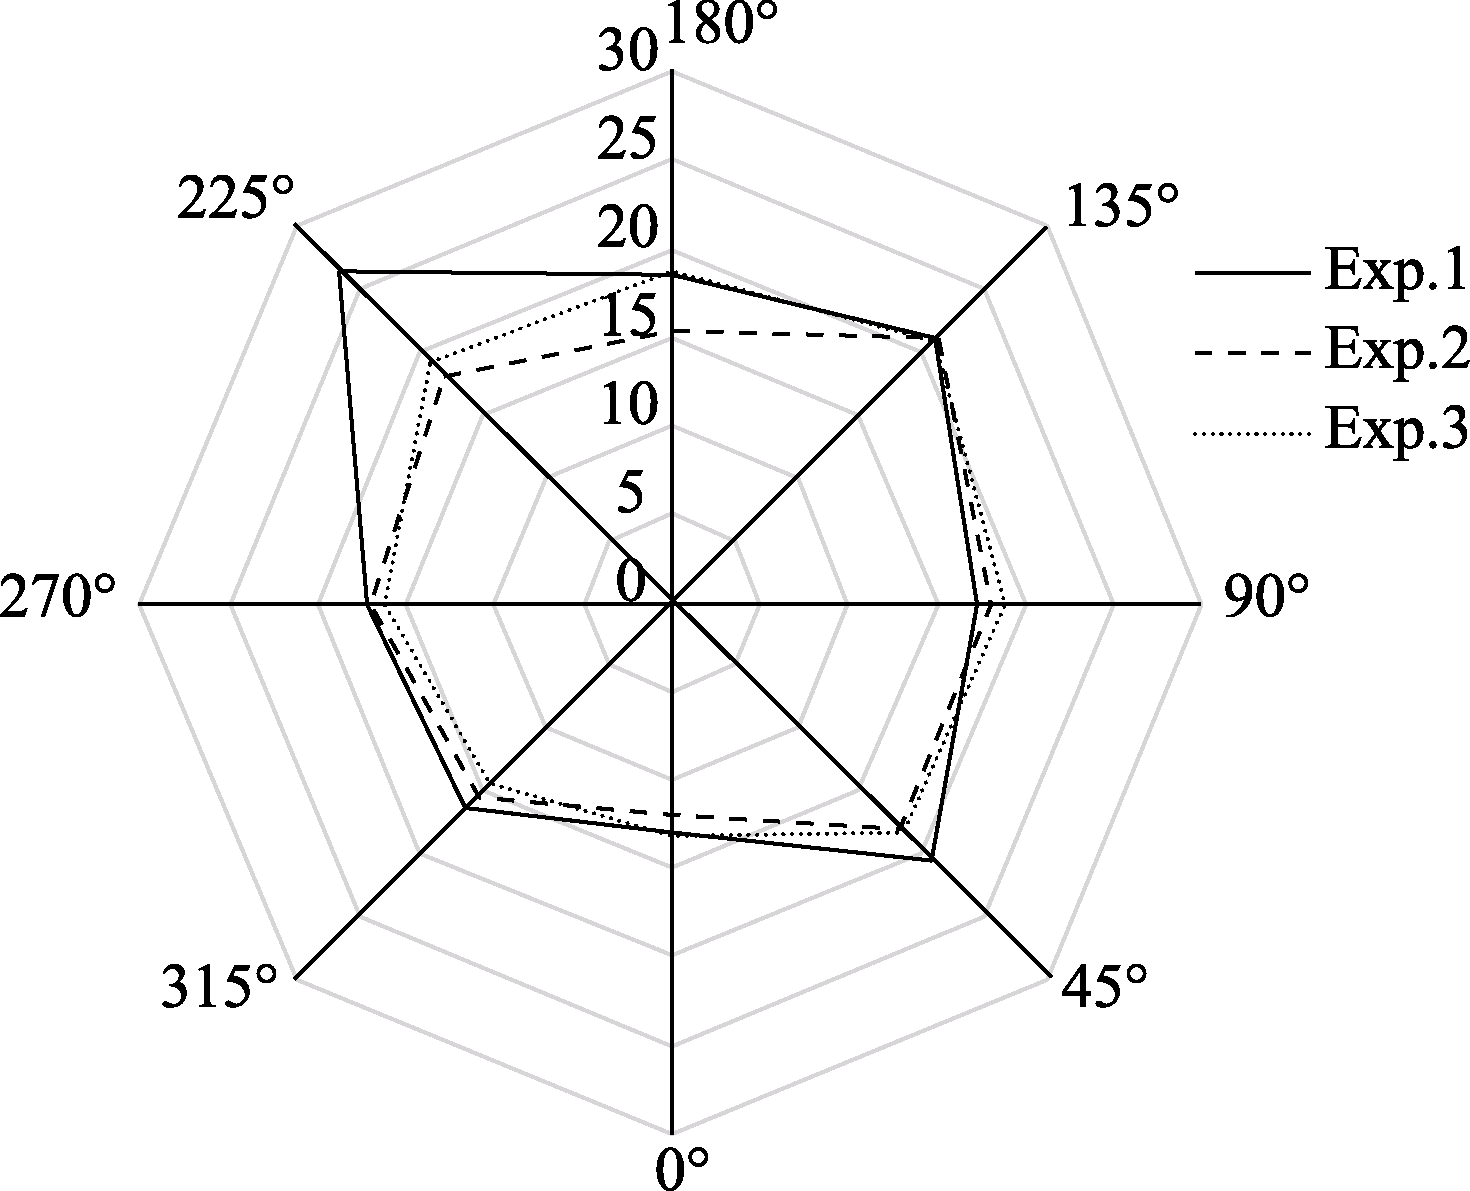
Table 1 Mean values (M) and standard deviations (SD) of pointing errors (in degrees) and response times (in seconds) for each imagined directions of all the experiments
| Imagined direction | 0° | 45° | 90° | 135° | 180° | 225° | 270° | 315° |
|---|
| Experiment 1 | Pointing error | 13.07(6.19) | 20.72(9.56) | 17.28(7.58) | 21.18(9.58) | 18.55(11.64) | 26.58(13.04) | 17.26(7.34) | 16.44(5.49) |
| Response time | 13.55(5.54) | 18.27(9.99) | 17.70(10.10) | 22.58(15.50) | 17.37(7.86) | 19.95(8.99) | 16.38(8.77) | 16.35(7.55) |
| Experiment 2 | Pointing error | 12.08(7.74) | 18.18(9.04) | 18.04(8.44) | 21.24(13.26) | 15.37(7.21) | 18.14(9.27) | 16.94(8.93) | 15.45(6.19) |
| Response time | 12.88(2.95) | 17.00(5.43) | 17.90(6.24) | 20.74(8.28) | 17.16(6.29) | 20.18(8.00) | 16.59(4.88) | 16.47(6.28) |
| Experiment 3 | Pointing error | 13.12(5.64) | 18.43(8.78) | 18.88(7.46) | 20.94(15.87) | 18.81(10.32) | 19.29(8.44) | 16.28(7.23) | 14.53(5.48) |
| Response time | 16.34(7.93) | 20.58(10.05) | 18.81(7.33) | 22.23(10.00) | 20.94(8.62) | 23.79(9.31) | 18.19(7.37) | 18.68(8.08) |
 )
)