ISSN 0439-755X
CN 11-1911/B
CN 11-1911/B
Acta Psychologica Sinica ›› 2026, Vol. 58 ›› Issue (4): 773-792.doi: 10.3724/SP.J.1041.2026.0773
• Original article • Previous Articles
LIU Yue1, HE Yueling1, LIU Hongyun2,3( )
)
Published:2026-04-25
Online:2026-01-16
Contact:
LIU Hongyun, E-mail: LIU Yue, HE Yueling, LIU Hongyun. (2026). Data analysis and sample size planning for intensive longitudinal intervention studies using dynamic structural equation modeling. Acta Psychologica Sinica, 58(4), 773-792.
Add to citation manager EndNote|Ris|BibTeX
URL: https://journal.psych.ac.cn/acps/EN/10.3724/SP.J.1041.2026.0773
| Category | Method | Number of Studies (Percentage) |
|---|---|---|
| Experimental Design | Single-Arm Trial (SAT) | 9(25.0%) |
| Randomized Controlled Trial (RCT) | 25(69.4%) | |
| Microrandomized Trial | 2(5.6%) | |
| Statistical Modeling | Qualitative Analysis | 1(2.8%) |
| Descriptive Analysis | 2(5.5%) | |
| ANOVA, t-test, Chi-square test, Regression Analysis | 10(27.8%) | |
| Thematic Analysis | 1(2.8%) | |
| Linear Mixed Effects Model | 20(55.6%) | |
| Dynamic Structural Equation Modeling (DSEM) | 2(5.5%) | |
| Sample Size Determination Method | Power Analysis | 11(30.6%) |
| Based on Previous or Pilot Studies | 6(16.6%) | |
| Based on Practical Resource Considerations | 1(2.8%) | |
| Not Mentioned | 18(50.0%) |
Table 1 Summary of Empirical Studies on Intensive Longitudinal Interventions in Psychology (2015-2025, 36 Studies)
| Category | Method | Number of Studies (Percentage) |
|---|---|---|
| Experimental Design | Single-Arm Trial (SAT) | 9(25.0%) |
| Randomized Controlled Trial (RCT) | 25(69.4%) | |
| Microrandomized Trial | 2(5.6%) | |
| Statistical Modeling | Qualitative Analysis | 1(2.8%) |
| Descriptive Analysis | 2(5.5%) | |
| ANOVA, t-test, Chi-square test, Regression Analysis | 10(27.8%) | |
| Thematic Analysis | 1(2.8%) | |
| Linear Mixed Effects Model | 20(55.6%) | |
| Dynamic Structural Equation Modeling (DSEM) | 2(5.5%) | |
| Sample Size Determination Method | Power Analysis | 11(30.6%) |
| Based on Previous or Pilot Studies | 6(16.6%) | |
| Based on Practical Resource Considerations | 1(2.8%) | |
| Not Mentioned | 18(50.0%) |
| Effect dimension | Parameter | Interpretation |
|---|---|---|
| Mean level | Change in average outcome level attributable to intervention | |
| Autoregression | Change in temporal dependency (e.g., inertia) | |
| Intra-individual variability | Change in within-person variability |
Table 2 Key DSEM-Based Intervention Effects
| Effect dimension | Parameter | Interpretation |
|---|---|---|
| Mean level | Change in average outcome level attributable to intervention | |
| Autoregression | Change in temporal dependency (e.g., inertia) | |
| Intra-individual variability | Change in within-person variability |
| Component | Specification |
|---|---|
| Study design | Single-arm trial (SAT); Randomized controlled trial (RCT) |
| Sample size (N) | Multiple levels representing typical ILI studies |
| Measurement occasions (T) | Multiple levels reflecting intensive measurement |
| Baseline mean structure | Fixed across conditions |
| Intervention effect on mean | Varying effect size levels |
| Baseline autoregression | Low to high temporal dependency |
| Intervention effect on autoregression | Present vs. absent |
| Baseline residual variance | Fixed |
| Intervention effect on variablity | Decrease, no change, increase |
| Estimation | Bayesian DSEM |
Table 3 Overview of Simulation Conditions
| Component | Specification |
|---|---|
| Study design | Single-arm trial (SAT); Randomized controlled trial (RCT) |
| Sample size (N) | Multiple levels representing typical ILI studies |
| Measurement occasions (T) | Multiple levels reflecting intensive measurement |
| Baseline mean structure | Fixed across conditions |
| Intervention effect on mean | Varying effect size levels |
| Baseline autoregression | Low to high temporal dependency |
| Intervention effect on autoregression | Present vs. absent |
| Baseline residual variance | Fixed |
| Intervention effect on variablity | Decrease, no change, increase |
| Estimation | Bayesian DSEM |
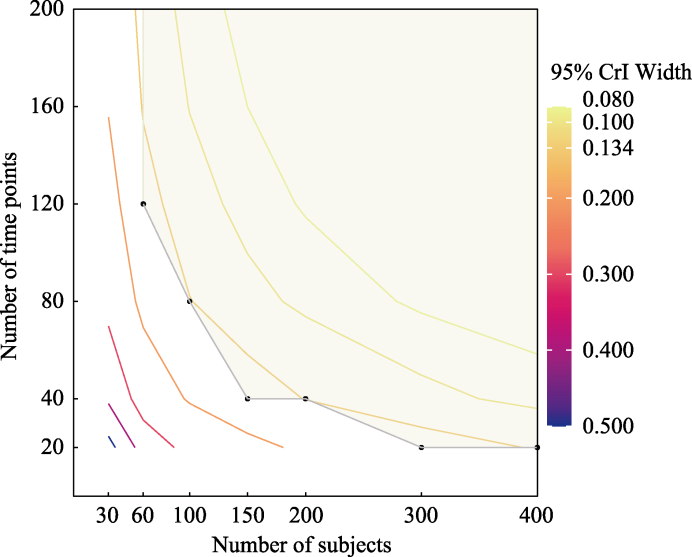
Figure 1. Contour plot of the credible interval width for ${{\gamma }_{03}}$ under a balanced single-arm design.
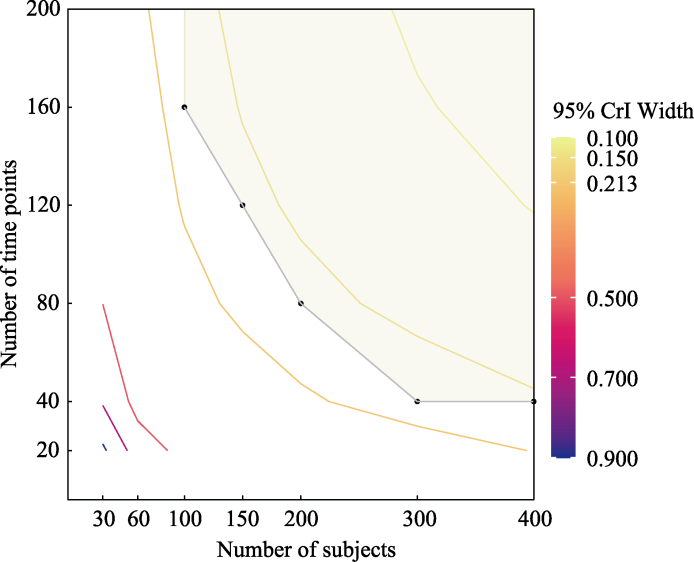
Figure 2. Contour plot of the credible interval width for ${{\gamma }_{03}}$ under a balanced randomized controlled trials design.Note. Shaded regions indicate conditions where statistical power exceeds 0.80.
| N | T | power | rbias | width | |||||||||||||||||
|---|---|---|---|---|---|---|---|---|---|---|---|---|---|---|---|---|---|---|---|---|---|
| 30 | 20 | 0.088 | 0.118 | 0.080 | ?0.044 | ?0.202 | ?0.256 | 0.534 | 0.397 | 0.547 | |||||||||||
| 40 | 0.178 | 0.250 | 0.180 | 0.024 | ?0.143 | ?0.086 | 0.385 | 0.270 | 0.379 | ||||||||||||
| 80 | 0.358 | 0.608 | 0.336 | ?0.024 | ?0.019 | ?0.048 | 0.271 | 0.191 | 0.270 | ||||||||||||
| 120 | 0.474 | 0.766 | 0.480 | ?0.001 | ?0.039 | ?0.039 | 0.225 | 0.158 | 0.222 | ||||||||||||
| 160 | 0.624 | 0.854 | 0.564 | ?0.013 | ?0.029 | ?0.037 | 0.197 | 0.141 | 0.196 | ||||||||||||
| 200 | 0.704 | 0.936 | 0.658 | ?0.012 | ?0.006 | ?0.029 | 0.181 | 0.131 | 0.178 | ||||||||||||
| 60 | 20 | 0.200 | 0.262 | 0.126 | ?0.027 | ?0.163 | ?0.231 | 0.358 | 0.270 | 0.371 | |||||||||||
| 40 | 0.400 | 0.552 | 0.328 | 0.026 | ?0.115 | ?0.080 | 0.255 | 0.183 | 0.257 | ||||||||||||
| 80 | 0.668 | 0.928 | 0.666 | ?0.032 | ?0.002 | ?0.017 | 0.180 | 0.130 | 0.183 | ||||||||||||
| 120 | 0.850 | 0.986 | 0.836 | 0.012 | ?0.018 | ?0.024 | 0.149 | 0.107 | 0.150 | ||||||||||||
| 160 | 0.922 | 0.996 | 0.912 | ?0.016 | ?0.020 | ?0.024 | 0.131 | 0.095 | 0.132 | ||||||||||||
| 200 | 0.966 | 1.000 | 0.966 | ?0.010 | ?0.010 | ?0.010 | 0.120 | 0.089 | 0.120 | ||||||||||||
| 100 | 20 | 0.344 | 0.474 | 0.202 | ?0.017 | ?0.143 | ?0.186 | 0.271 | 0.205 | 0.283 | |||||||||||
| 40 | 0.660 | 0.848 | 0.538 | 0.018 | ?0.077 | ?0.074 | 0.193 | 0.139 | 0.196 | ||||||||||||
| 80 | 0.888 | 0.996 | 0.882 | ?0.018 | ?0.014 | 0.009 | 0.135 | 0.098 | 0.139 | ||||||||||||
| 120 | 0.966 | 1.000 | 0.964 | ?0.013 | ?0.010 | ?0.004 | 0.113 | 0.082 | 0.114 | ||||||||||||
| 160 | 0.996 | 1.000 | 0.996 | ?0.002 | ?0.011 | ?0.013 | 0.099 | 0.073 | 0.100 | ||||||||||||
| 200 | 1.000 | 1.000 | 0.998 | ?0.013 | ?0.005 | ?0.010 | 0.091 | 0.067 | 0.091 | ||||||||||||
| 150 | 20 | 0.560 | 0.652 | 0.364 | 0.011 | ?0.117 | ?0.155 | 0.219 | 0.166 | 0.228 | |||||||||||
| 40 | 0.806 | 0.960 | 0.750 | 0.006 | ?0.063 | ?0.042 | 0.154 | 0.112 | 0.158 | ||||||||||||
| 80 | 0.972 | 0.992 | 0.974 | ?0.009 | ?0.024 | 0.007 | 0.109 | 0.079 | 0.112 | ||||||||||||
| 120 | 0.998 | 0.998 | 0.996 | 0.002 | ?0.020 | ?0.001 | 0.090 | 0.067 | 0.092 | ||||||||||||
| 160 | 1.000 | 1.000 | 1.000 | ?0.014 | ?0.020 | 0.004 | 0.080 | 0.060 | 0.081 | ||||||||||||
| 200 | 1.000 | 1.000 | 1.000 | 0.007 | ?0.012 | 0.001 | 0.073 | 0.055 | 0.074 | ||||||||||||
| 200 | 20 | 0.652 | 0.808 | 0.496 | 0.001 | ?0.096 | ?0.125 | 0.188 | 0.142 | 0.196 | |||||||||||
| 40 | 0.898 | 0.986 | 0.872 | ?0.010 | ?0.048 | ?0.033 | 0.133 | 0.097 | 0.137 | ||||||||||||
| 80 | 0.996 | 1.000 | 0.994 | ?0.012 | ?0.008 | ?0.007 | 0.094 | 0.069 | 0.096 | ||||||||||||
| 120 | 0.998 | 1.000 | 1.000 | ?0.006 | ?0.005 | ?0.002 | 0.078 | 0.057 | 0.079 | ||||||||||||
| 160 | 1.000 | 1.000 | 1.000 | ?0.011 | ?0.002 | ?0.010 | 0.069 | 0.051 | 0.070 | ||||||||||||
| 200 | 1.000 | 1.000 | 1.000 | ?0.011 | 0.000 | ?0.003 | 0.063 | 0.047 | 0.063 | ||||||||||||
| 300 | 20 | 0.812 | 0.940 | 0.690 | ?0.023 | ?0.066 | ?0.103 | 0.153 | 0.116 | 0.160 | |||||||||||
| 40 | 0.974 | 0.998 | 0.972 | ?0.013 | ?0.037 | ?0.039 | 0.108 | 0.079 | 0.111 | ||||||||||||
| 80 | 1.000 | 1.000 | 1.000 | ?0.015 | 0.000 | 0.004 | 0.076 | 0.056 | 0.078 | ||||||||||||
| 120 | 1.000 | 1.000 | 1.000 | ?0.010 | ?0.002 | 0.004 | 0.063 | 0.047 | 0.064 | ||||||||||||
| 160 | 1.000 | 1.000 | 1.000 | ?0.011 | 0.002 | ?0.010 | 0.056 | 0.042 | 0.057 | ||||||||||||
| 200 | 1.000 | 1.000 | 1.000 | ?0.006 | ?0.002 | ?0.005 | 0.051 | 0.038 | 0.052 | ||||||||||||
| 400 | 20 | 0.926 | 0.982 | 0.846 | ?0.013 | ?0.051 | ?0.079 | 0.131 | 0.100 | 0.137 | |||||||||||
| 40 | 0.998 | 0.998 | 0.992 | ?0.012 | ?0.028 | ?0.036 | 0.092 | 0.068 | 0.096 | ||||||||||||
| 80 | 1.000 | 1.000 | 1.000 | ?0.010 | 0.001 | 0.006 | 0.066 | 0.048 | 0.067 | ||||||||||||
| 120 | 1.000 | 1.000 | 1.000 | ?0.006 | 0.000 | 0.001 | 0.055 | 0.040 | 0.056 | ||||||||||||
| 160 | 1.000 | 1.000 | 1.000 | ?0.010 | ?0.001 | ?0.009 | 0.048 | 0.036 | 0.049 | ||||||||||||
| 200 | 1.000 | 1.000 | 1.000 | ?0.003 | ?0.001 | ?0.002 | 0.044 | 0.033 | 0.045 | ||||||||||||
Table 4 Statistical power, relative bias, and credible interval width under a balanced single-arm design
| N | T | power | rbias | width | |||||||||||||||||
|---|---|---|---|---|---|---|---|---|---|---|---|---|---|---|---|---|---|---|---|---|---|
| 30 | 20 | 0.088 | 0.118 | 0.080 | ?0.044 | ?0.202 | ?0.256 | 0.534 | 0.397 | 0.547 | |||||||||||
| 40 | 0.178 | 0.250 | 0.180 | 0.024 | ?0.143 | ?0.086 | 0.385 | 0.270 | 0.379 | ||||||||||||
| 80 | 0.358 | 0.608 | 0.336 | ?0.024 | ?0.019 | ?0.048 | 0.271 | 0.191 | 0.270 | ||||||||||||
| 120 | 0.474 | 0.766 | 0.480 | ?0.001 | ?0.039 | ?0.039 | 0.225 | 0.158 | 0.222 | ||||||||||||
| 160 | 0.624 | 0.854 | 0.564 | ?0.013 | ?0.029 | ?0.037 | 0.197 | 0.141 | 0.196 | ||||||||||||
| 200 | 0.704 | 0.936 | 0.658 | ?0.012 | ?0.006 | ?0.029 | 0.181 | 0.131 | 0.178 | ||||||||||||
| 60 | 20 | 0.200 | 0.262 | 0.126 | ?0.027 | ?0.163 | ?0.231 | 0.358 | 0.270 | 0.371 | |||||||||||
| 40 | 0.400 | 0.552 | 0.328 | 0.026 | ?0.115 | ?0.080 | 0.255 | 0.183 | 0.257 | ||||||||||||
| 80 | 0.668 | 0.928 | 0.666 | ?0.032 | ?0.002 | ?0.017 | 0.180 | 0.130 | 0.183 | ||||||||||||
| 120 | 0.850 | 0.986 | 0.836 | 0.012 | ?0.018 | ?0.024 | 0.149 | 0.107 | 0.150 | ||||||||||||
| 160 | 0.922 | 0.996 | 0.912 | ?0.016 | ?0.020 | ?0.024 | 0.131 | 0.095 | 0.132 | ||||||||||||
| 200 | 0.966 | 1.000 | 0.966 | ?0.010 | ?0.010 | ?0.010 | 0.120 | 0.089 | 0.120 | ||||||||||||
| 100 | 20 | 0.344 | 0.474 | 0.202 | ?0.017 | ?0.143 | ?0.186 | 0.271 | 0.205 | 0.283 | |||||||||||
| 40 | 0.660 | 0.848 | 0.538 | 0.018 | ?0.077 | ?0.074 | 0.193 | 0.139 | 0.196 | ||||||||||||
| 80 | 0.888 | 0.996 | 0.882 | ?0.018 | ?0.014 | 0.009 | 0.135 | 0.098 | 0.139 | ||||||||||||
| 120 | 0.966 | 1.000 | 0.964 | ?0.013 | ?0.010 | ?0.004 | 0.113 | 0.082 | 0.114 | ||||||||||||
| 160 | 0.996 | 1.000 | 0.996 | ?0.002 | ?0.011 | ?0.013 | 0.099 | 0.073 | 0.100 | ||||||||||||
| 200 | 1.000 | 1.000 | 0.998 | ?0.013 | ?0.005 | ?0.010 | 0.091 | 0.067 | 0.091 | ||||||||||||
| 150 | 20 | 0.560 | 0.652 | 0.364 | 0.011 | ?0.117 | ?0.155 | 0.219 | 0.166 | 0.228 | |||||||||||
| 40 | 0.806 | 0.960 | 0.750 | 0.006 | ?0.063 | ?0.042 | 0.154 | 0.112 | 0.158 | ||||||||||||
| 80 | 0.972 | 0.992 | 0.974 | ?0.009 | ?0.024 | 0.007 | 0.109 | 0.079 | 0.112 | ||||||||||||
| 120 | 0.998 | 0.998 | 0.996 | 0.002 | ?0.020 | ?0.001 | 0.090 | 0.067 | 0.092 | ||||||||||||
| 160 | 1.000 | 1.000 | 1.000 | ?0.014 | ?0.020 | 0.004 | 0.080 | 0.060 | 0.081 | ||||||||||||
| 200 | 1.000 | 1.000 | 1.000 | 0.007 | ?0.012 | 0.001 | 0.073 | 0.055 | 0.074 | ||||||||||||
| 200 | 20 | 0.652 | 0.808 | 0.496 | 0.001 | ?0.096 | ?0.125 | 0.188 | 0.142 | 0.196 | |||||||||||
| 40 | 0.898 | 0.986 | 0.872 | ?0.010 | ?0.048 | ?0.033 | 0.133 | 0.097 | 0.137 | ||||||||||||
| 80 | 0.996 | 1.000 | 0.994 | ?0.012 | ?0.008 | ?0.007 | 0.094 | 0.069 | 0.096 | ||||||||||||
| 120 | 0.998 | 1.000 | 1.000 | ?0.006 | ?0.005 | ?0.002 | 0.078 | 0.057 | 0.079 | ||||||||||||
| 160 | 1.000 | 1.000 | 1.000 | ?0.011 | ?0.002 | ?0.010 | 0.069 | 0.051 | 0.070 | ||||||||||||
| 200 | 1.000 | 1.000 | 1.000 | ?0.011 | 0.000 | ?0.003 | 0.063 | 0.047 | 0.063 | ||||||||||||
| 300 | 20 | 0.812 | 0.940 | 0.690 | ?0.023 | ?0.066 | ?0.103 | 0.153 | 0.116 | 0.160 | |||||||||||
| 40 | 0.974 | 0.998 | 0.972 | ?0.013 | ?0.037 | ?0.039 | 0.108 | 0.079 | 0.111 | ||||||||||||
| 80 | 1.000 | 1.000 | 1.000 | ?0.015 | 0.000 | 0.004 | 0.076 | 0.056 | 0.078 | ||||||||||||
| 120 | 1.000 | 1.000 | 1.000 | ?0.010 | ?0.002 | 0.004 | 0.063 | 0.047 | 0.064 | ||||||||||||
| 160 | 1.000 | 1.000 | 1.000 | ?0.011 | 0.002 | ?0.010 | 0.056 | 0.042 | 0.057 | ||||||||||||
| 200 | 1.000 | 1.000 | 1.000 | ?0.006 | ?0.002 | ?0.005 | 0.051 | 0.038 | 0.052 | ||||||||||||
| 400 | 20 | 0.926 | 0.982 | 0.846 | ?0.013 | ?0.051 | ?0.079 | 0.131 | 0.100 | 0.137 | |||||||||||
| 40 | 0.998 | 0.998 | 0.992 | ?0.012 | ?0.028 | ?0.036 | 0.092 | 0.068 | 0.096 | ||||||||||||
| 80 | 1.000 | 1.000 | 1.000 | ?0.010 | 0.001 | 0.006 | 0.066 | 0.048 | 0.067 | ||||||||||||
| 120 | 1.000 | 1.000 | 1.000 | ?0.006 | 0.000 | 0.001 | 0.055 | 0.040 | 0.056 | ||||||||||||
| 160 | 1.000 | 1.000 | 1.000 | ?0.010 | ?0.001 | ?0.009 | 0.048 | 0.036 | 0.049 | ||||||||||||
| 200 | 1.000 | 1.000 | 1.000 | ?0.003 | ?0.001 | ?0.002 | 0.044 | 0.033 | 0.045 | ||||||||||||
| N | T | power | rbias | width | ||||||
|---|---|---|---|---|---|---|---|---|---|---|
| 30 | 20 | 0.038 | 0.070 | 0.048 | ?0.134 | 0.017 | 0.004 | 0.933 | 0.676 | 0.932 |
| 40 | 0.080 | 0.172 | 0.108 | ?0.013 | 0.014 | 0.004 | 0.679 | 0.482 | 0.662 | |
| 80 | 0.150 | 0.302 | 0.164 | ?0.035 | 0.003 | ?0.019 | 0.498 | 0.364 | 0.492 | |
| 120 | 0.242 | 0.366 | 0.216 | 0.009 | ?0.040 | ?0.003 | 0.425 | 0.309 | 0.421 | |
| 160 | 0.316 | 0.492 | 0.278 | 0.042 | 0.005 | ?0.047 | 0.374 | 0.281 | 0.373 | |
| 200 | 0.326 | 0.550 | 0.344 | 0.044 | ?0.016 | 0.020 | 0.345 | 0.261 | 0.345 | |
| 60 | 20 | 0.100 | 0.212 | 0.136 | ?0.103 | 0.054 | 0.053 | 0.598 | 0.441 | 0.598 |
| 40 | 0.218 | 0.432 | 0.232 | 0.016 | 0.030 | ?0.010 | 0.435 | 0.319 | 0.433 | |
| 80 | 0.350 | 0.648 | 0.376 | ?0.047 | 0.007 | ?0.013 | 0.324 | 0.241 | 0.323 | |
| 120 | 0.511 | 0.781 | 0.513 | ?0.025 | 0.015 | 0.033 | 0.273 | 0.207 | 0.276 | |
| 160 | 0.625 | 0.826 | 0.582 | 0.026 | ?0.003 | ?0.040 | 0.246 | 0.187 | 0.247 | |
| 200 | 0.706 | 0.890 | 0.700 | 0.005 | ?0.003 | 0.008 | 0.226 | 0.174 | 0.227 | |
| 100 | 20 | 0.218 | 0.398 | 0.224 | ?0.037 | 0.054 | 0.024 | 0.444 | 0.329 | 0.445 |
| 40 | 0.380 | 0.664 | 0.382 | 0.005 | 0.029 | 0.001 | 0.325 | 0.240 | 0.323 | |
| 80 | 0.594 | 0.878 | 0.624 | ?0.044 | 0.007 | ?0.002 | 0.242 | 0.181 | 0.243 | |
| 120 | 0.760 | 0.940 | 0.782 | ?0.029 | 0.005 | 0.019 | 0.205 | 0.156 | 0.208 | |
| 160 | 0.859 | 0.975 | 0.832 | 0.002 | 0.002 | ?0.019 | 0.184 | 0.141 | 0.186 | |
| 200 | 0.921 | 0.992 | 0.902 | ?0.005 | ?0.009 | 0.013 | 0.170 | 0.131 | 0.171 | |
| 150 | 20 | 0.308 | 0.584 | 0.344 | ?0.057 | 0.029 | 0.033 | 0.355 | 0.264 | 0.356 |
| 40 | 0.516 | 0.850 | 0.562 | ?0.023 | 0.036 | 0.024 | 0.261 | 0.192 | 0.260 | |
| 80 | 0.788 | 0.974 | 0.798 | ?0.042 | ?0.001 | 0.004 | 0.194 | 0.146 | 0.195 | |
| 120 | 0.902 | 0.988 | 0.926 | 0.007 | ?0.021 | 0.026 | 0.165 | 0.126 | 0.167 | |
| 160 | 0.962 | 0.996 | 0.956 | ?0.002 | 0.011 | ?0.018 | 0.147 | 0.115 | 0.149 | |
| 200 | 0.986 | 1.000 | 0.988 | 0.019 | ?0.005 | 0.020 | 0.136 | 0.107 | 0.138 | |
| 200 | 20 | 0.376 | 0.692 | 0.444 | ?0.042 | 0.000 | 0.050 | 0.304 | 0.226 | 0.305 |
| 40 | 0.710 | 0.926 | 0.726 | ?0.012 | 0.031 | 0.029 | 0.223 | 0.165 | 0.224 | |
| 80 | 0.912 | 0.992 | 0.936 | ?0.032 | 0.002 | 0.017 | 0.166 | 0.125 | 0.168 | |
| 120 | 0.978 | 1.000 | 0.968 | 0.006 | ?0.016 | 0.023 | 0.141 | 0.109 | 0.144 | |
| 160 | 0.990 | 1.000 | 0.990 | ?0.001 | 0.006 | ?0.003 | 0.126 | 0.099 | 0.129 | |
| 200 | 0.998 | 1.000 | 0.998 | 0.010 | ?0.003 | 0.022 | 0.117 | 0.092 | 0.119 | |
| 300 | 20 | 0.560 | 0.874 | 0.636 | ?0.053 | 0.030 | 0.031 | 0.245 | 0.182 | 0.246 |
| 40 | 0.860 | 0.994 | 0.884 | ?0.031 | 0.011 | 0.008 | 0.180 | 0.134 | 0.180 | |
| 80 | 0.982 | 1.000 | 0.984 | 0.004 | 0.012 | ?0.006 | 0.135 | 0.102 | 0.135 | |
| 120 | 0.998 | 1.000 | 0.994 | 0.004 | ?0.012 | 0.015 | 0.114 | 0.088 | 0.117 | |
| 160 | 1.000 | 1.000 | 1.000 | ?0.001 | ?0.004 | ?0.001 | 0.102 | 0.080 | 0.104 | |
| 200 | 1.000 | 1.000 | 1.000 | 0.000 | ?0.001 | 0.003 | 0.095 | 0.075 | 0.096 | |
| 400 | 20 | 0.688 | 0.942 | 0.778 | ?0.049 | 0.040 | 0.038 | 0.211 | 0.156 | 0.212 |
| 40 | 0.944 | 0.996 | 0.962 | ?0.020 | 0.026 | 0.034 | 0.155 | 0.115 | 0.156 | |
| 80 | 0.994 | 1.000 | 1.000 | ?0.013 | ?0.002 | 0.018 | 0.116 | 0.088 | 0.117 | |
| 120 | 1.000 | 1.000 | 1.000 | 0.000 | ?0.008 | 0.013 | 0.099 | 0.076 | 0.101 | |
| 160 | 1.000 | 1.000 | 1.000 | 0.000 | ?0.003 | 0.001 | 0.088 | 0.069 | 0.090 | |
| 200 | 1.000 | 1.000 | 1.000 | 0.005 | ?0.003 | 0.018 | 0.082 | 0.065 | 0.083 | |
Table 5 Statistical power, relative bias, and credible interval width under a balanced randomized controlled design
| N | T | power | rbias | width | ||||||
|---|---|---|---|---|---|---|---|---|---|---|
| 30 | 20 | 0.038 | 0.070 | 0.048 | ?0.134 | 0.017 | 0.004 | 0.933 | 0.676 | 0.932 |
| 40 | 0.080 | 0.172 | 0.108 | ?0.013 | 0.014 | 0.004 | 0.679 | 0.482 | 0.662 | |
| 80 | 0.150 | 0.302 | 0.164 | ?0.035 | 0.003 | ?0.019 | 0.498 | 0.364 | 0.492 | |
| 120 | 0.242 | 0.366 | 0.216 | 0.009 | ?0.040 | ?0.003 | 0.425 | 0.309 | 0.421 | |
| 160 | 0.316 | 0.492 | 0.278 | 0.042 | 0.005 | ?0.047 | 0.374 | 0.281 | 0.373 | |
| 200 | 0.326 | 0.550 | 0.344 | 0.044 | ?0.016 | 0.020 | 0.345 | 0.261 | 0.345 | |
| 60 | 20 | 0.100 | 0.212 | 0.136 | ?0.103 | 0.054 | 0.053 | 0.598 | 0.441 | 0.598 |
| 40 | 0.218 | 0.432 | 0.232 | 0.016 | 0.030 | ?0.010 | 0.435 | 0.319 | 0.433 | |
| 80 | 0.350 | 0.648 | 0.376 | ?0.047 | 0.007 | ?0.013 | 0.324 | 0.241 | 0.323 | |
| 120 | 0.511 | 0.781 | 0.513 | ?0.025 | 0.015 | 0.033 | 0.273 | 0.207 | 0.276 | |
| 160 | 0.625 | 0.826 | 0.582 | 0.026 | ?0.003 | ?0.040 | 0.246 | 0.187 | 0.247 | |
| 200 | 0.706 | 0.890 | 0.700 | 0.005 | ?0.003 | 0.008 | 0.226 | 0.174 | 0.227 | |
| 100 | 20 | 0.218 | 0.398 | 0.224 | ?0.037 | 0.054 | 0.024 | 0.444 | 0.329 | 0.445 |
| 40 | 0.380 | 0.664 | 0.382 | 0.005 | 0.029 | 0.001 | 0.325 | 0.240 | 0.323 | |
| 80 | 0.594 | 0.878 | 0.624 | ?0.044 | 0.007 | ?0.002 | 0.242 | 0.181 | 0.243 | |
| 120 | 0.760 | 0.940 | 0.782 | ?0.029 | 0.005 | 0.019 | 0.205 | 0.156 | 0.208 | |
| 160 | 0.859 | 0.975 | 0.832 | 0.002 | 0.002 | ?0.019 | 0.184 | 0.141 | 0.186 | |
| 200 | 0.921 | 0.992 | 0.902 | ?0.005 | ?0.009 | 0.013 | 0.170 | 0.131 | 0.171 | |
| 150 | 20 | 0.308 | 0.584 | 0.344 | ?0.057 | 0.029 | 0.033 | 0.355 | 0.264 | 0.356 |
| 40 | 0.516 | 0.850 | 0.562 | ?0.023 | 0.036 | 0.024 | 0.261 | 0.192 | 0.260 | |
| 80 | 0.788 | 0.974 | 0.798 | ?0.042 | ?0.001 | 0.004 | 0.194 | 0.146 | 0.195 | |
| 120 | 0.902 | 0.988 | 0.926 | 0.007 | ?0.021 | 0.026 | 0.165 | 0.126 | 0.167 | |
| 160 | 0.962 | 0.996 | 0.956 | ?0.002 | 0.011 | ?0.018 | 0.147 | 0.115 | 0.149 | |
| 200 | 0.986 | 1.000 | 0.988 | 0.019 | ?0.005 | 0.020 | 0.136 | 0.107 | 0.138 | |
| 200 | 20 | 0.376 | 0.692 | 0.444 | ?0.042 | 0.000 | 0.050 | 0.304 | 0.226 | 0.305 |
| 40 | 0.710 | 0.926 | 0.726 | ?0.012 | 0.031 | 0.029 | 0.223 | 0.165 | 0.224 | |
| 80 | 0.912 | 0.992 | 0.936 | ?0.032 | 0.002 | 0.017 | 0.166 | 0.125 | 0.168 | |
| 120 | 0.978 | 1.000 | 0.968 | 0.006 | ?0.016 | 0.023 | 0.141 | 0.109 | 0.144 | |
| 160 | 0.990 | 1.000 | 0.990 | ?0.001 | 0.006 | ?0.003 | 0.126 | 0.099 | 0.129 | |
| 200 | 0.998 | 1.000 | 0.998 | 0.010 | ?0.003 | 0.022 | 0.117 | 0.092 | 0.119 | |
| 300 | 20 | 0.560 | 0.874 | 0.636 | ?0.053 | 0.030 | 0.031 | 0.245 | 0.182 | 0.246 |
| 40 | 0.860 | 0.994 | 0.884 | ?0.031 | 0.011 | 0.008 | 0.180 | 0.134 | 0.180 | |
| 80 | 0.982 | 1.000 | 0.984 | 0.004 | 0.012 | ?0.006 | 0.135 | 0.102 | 0.135 | |
| 120 | 0.998 | 1.000 | 0.994 | 0.004 | ?0.012 | 0.015 | 0.114 | 0.088 | 0.117 | |
| 160 | 1.000 | 1.000 | 1.000 | ?0.001 | ?0.004 | ?0.001 | 0.102 | 0.080 | 0.104 | |
| 200 | 1.000 | 1.000 | 1.000 | 0.000 | ?0.001 | 0.003 | 0.095 | 0.075 | 0.096 | |
| 400 | 20 | 0.688 | 0.942 | 0.778 | ?0.049 | 0.040 | 0.038 | 0.211 | 0.156 | 0.212 |
| 40 | 0.944 | 0.996 | 0.962 | ?0.020 | 0.026 | 0.034 | 0.155 | 0.115 | 0.156 | |
| 80 | 0.994 | 1.000 | 1.000 | ?0.013 | ?0.002 | 0.018 | 0.116 | 0.088 | 0.117 | |
| 120 | 1.000 | 1.000 | 1.000 | 0.000 | ?0.008 | 0.013 | 0.099 | 0.076 | 0.101 | |
| 160 | 1.000 | 1.000 | 1.000 | 0.000 | ?0.003 | 0.001 | 0.088 | 0.069 | 0.090 | |
| 200 | 1.000 | 1.000 | 1.000 | 0.005 | ?0.003 | 0.018 | 0.082 | 0.065 | 0.083 | |
| N | T | Effect size=0.1 | Effect size=0.2 | ||||||||||
|---|---|---|---|---|---|---|---|---|---|---|---|---|---|
| mean | autoregression | IIV | mean | autoregression | IIV | ||||||||
| SAT | RCT | SAT | RCT | SAT | RCT | SAT | RCT | SAT | RCT | SAT | RCT | ||
| 60(30) | 40 | 0.024 | 0.022 | 0.030 | 0.022 | 0.032 | 0.034 | 0.044 | 0.022 | 0.050 | 0.022 | 0.050 | 0.034 |
| 60(30) | 80 | 0.046 | 0.048 | 0.030 | 0.024 | 0.036 | 0.036 | 0.088 | 0.040 | 0.102 | 0.032 | 0.054 | 0.030 |
| 60(30) | 120 | 0.048 | 0.044 | 0.068 | 0.048 | 0.052 | 0.036 | 0.088 | 0.040 | 0.170 | 0.038 | 0.096 | 0.032 |
| 60(30) | 160 | 0.034 | 0.028 | 0.066 | 0.036 | 0.046 | 0.046 | 0.154 | 0.044 | 0.196 | 0.036 | 0.120 | 0.042 |
| 60(30) | 200 | 0.076 | 0.040 | 0.086 | 0.068 | 0.072 | 0.058 | 0.152 | 0.050 | 0.216 | 0.040 | 0.148 | 0.038 |
| 100(50) | 40 | 0.056 | 0.034 | 0.034 | 0.036 | 0.044 | 0.048 | 0.102 | 0.032 | 0.094 | 0.038 | 0.060 | 0.046 |
| 100(50) | 80 | 0.070 | 0.056 | 0.062 | 0.036 | 0.038 | 0.042 | 0.136 | 0.036 | 0.190 | 0.050 | 0.106 | 0.034 |
| 100(50) | 120 | 0.056 | 0.060 | 0.090 | 0.050 | 0.078 | 0.034 | 0.184 | 0.042 | 0.290 | 0.056 | 0.166 | 0.034 |
| 100(50) | 160 | 0.070 | 0.042 | 0.132 | 0.058 | 0.074 | 0.058 | 0.244 | 0.036 | 0.306 | 0.038 | 0.214 | 0.040 |
| 100(50) | 200 | 0.104 | 0.046 | 0.118 | 0.052 | 0.068 | 0.038 | 0.284 | 0.054 | 0.392 | 0.048 | 0.246 | 0.044 |
| 200(100) | 40 | 0.088 | 0.044 | 0.080 | 0.044 | 0.042 | 0.064 | 0.180 | 0.044 | 0.208 | 0.038 | 0.092 | 0.052 |
| 200(100) | 80 | 0.086 | 0.048 | 0.106 | 0.044 | 0.072 | 0.048 | 0.294 | 0.062 | 0.400 | 0.048 | 0.202 | 0.040 |
| 200(100) | 120 | 0.114 | 0.064 | 0.178 | 0.046 | 0.092 | 0.060 | 0.380 | 0.050 | 0.518 | 0.048 | 0.326 | 0.054 |
| 200(100) | 160 | 0.146 | 0.048 | 0.218 | 0.046 | 0.134 | 0.042 | 0.486 | 0.044 | 0.624 | 0.076 | 0.404 | 0.044 |
| 200(100) | 200 | 0.178 | 0.048 | 0.234 | 0.070 | 0.146 | 0.050 | 0.522 | 0.040 | 0.710 | 0.040 | 0.504 | 0.038 |
Table 6 Type I error in two designs
| N | T | Effect size=0.1 | Effect size=0.2 | ||||||||||
|---|---|---|---|---|---|---|---|---|---|---|---|---|---|
| mean | autoregression | IIV | mean | autoregression | IIV | ||||||||
| SAT | RCT | SAT | RCT | SAT | RCT | SAT | RCT | SAT | RCT | SAT | RCT | ||
| 60(30) | 40 | 0.024 | 0.022 | 0.030 | 0.022 | 0.032 | 0.034 | 0.044 | 0.022 | 0.050 | 0.022 | 0.050 | 0.034 |
| 60(30) | 80 | 0.046 | 0.048 | 0.030 | 0.024 | 0.036 | 0.036 | 0.088 | 0.040 | 0.102 | 0.032 | 0.054 | 0.030 |
| 60(30) | 120 | 0.048 | 0.044 | 0.068 | 0.048 | 0.052 | 0.036 | 0.088 | 0.040 | 0.170 | 0.038 | 0.096 | 0.032 |
| 60(30) | 160 | 0.034 | 0.028 | 0.066 | 0.036 | 0.046 | 0.046 | 0.154 | 0.044 | 0.196 | 0.036 | 0.120 | 0.042 |
| 60(30) | 200 | 0.076 | 0.040 | 0.086 | 0.068 | 0.072 | 0.058 | 0.152 | 0.050 | 0.216 | 0.040 | 0.148 | 0.038 |
| 100(50) | 40 | 0.056 | 0.034 | 0.034 | 0.036 | 0.044 | 0.048 | 0.102 | 0.032 | 0.094 | 0.038 | 0.060 | 0.046 |
| 100(50) | 80 | 0.070 | 0.056 | 0.062 | 0.036 | 0.038 | 0.042 | 0.136 | 0.036 | 0.190 | 0.050 | 0.106 | 0.034 |
| 100(50) | 120 | 0.056 | 0.060 | 0.090 | 0.050 | 0.078 | 0.034 | 0.184 | 0.042 | 0.290 | 0.056 | 0.166 | 0.034 |
| 100(50) | 160 | 0.070 | 0.042 | 0.132 | 0.058 | 0.074 | 0.058 | 0.244 | 0.036 | 0.306 | 0.038 | 0.214 | 0.040 |
| 100(50) | 200 | 0.104 | 0.046 | 0.118 | 0.052 | 0.068 | 0.038 | 0.284 | 0.054 | 0.392 | 0.048 | 0.246 | 0.044 |
| 200(100) | 40 | 0.088 | 0.044 | 0.080 | 0.044 | 0.042 | 0.064 | 0.180 | 0.044 | 0.208 | 0.038 | 0.092 | 0.052 |
| 200(100) | 80 | 0.086 | 0.048 | 0.106 | 0.044 | 0.072 | 0.048 | 0.294 | 0.062 | 0.400 | 0.048 | 0.202 | 0.040 |
| 200(100) | 120 | 0.114 | 0.064 | 0.178 | 0.046 | 0.092 | 0.060 | 0.380 | 0.050 | 0.518 | 0.048 | 0.326 | 0.054 |
| 200(100) | 160 | 0.146 | 0.048 | 0.218 | 0.046 | 0.134 | 0.042 | 0.486 | 0.044 | 0.624 | 0.076 | 0.404 | 0.044 |
| 200(100) | 200 | 0.178 | 0.048 | 0.234 | 0.070 | 0.146 | 0.050 | 0.522 | 0.040 | 0.710 | 0.040 | 0.504 | 0.038 |
| No related articles found! |
| Viewed | ||||||
|
Full text |
|
|||||
|
Abstract |
|
|||||