ISSN 0439-755X
CN 11-1911/B
CN 11-1911/B
Acta Psychologica Sinica ›› 2026, Vol. 58 ›› Issue (3): 558-568.doi: 10.3724/SP.J.1041.2026.0558
• Reports of Empirical Studies • Previous Articles
GUO Lei1,2( ), QIN Haijiang1
Published:2026-03-25
Online:2025-12-26
Contact:
GUO Lei
E-mail:happygl1229@swu.edu.cn
Supported by:GUO Lei, QIN Haijiang. (2026). Factor retention in exploratory factor analysis based on LSTM. Acta Psychologica Sinica, 58(3), 558-568.
Add to citation manager EndNote|Ris|BibTeX
URL: https://journal.psych.ac.cn/acps/EN/10.3724/SP.J.1041.2026.0558
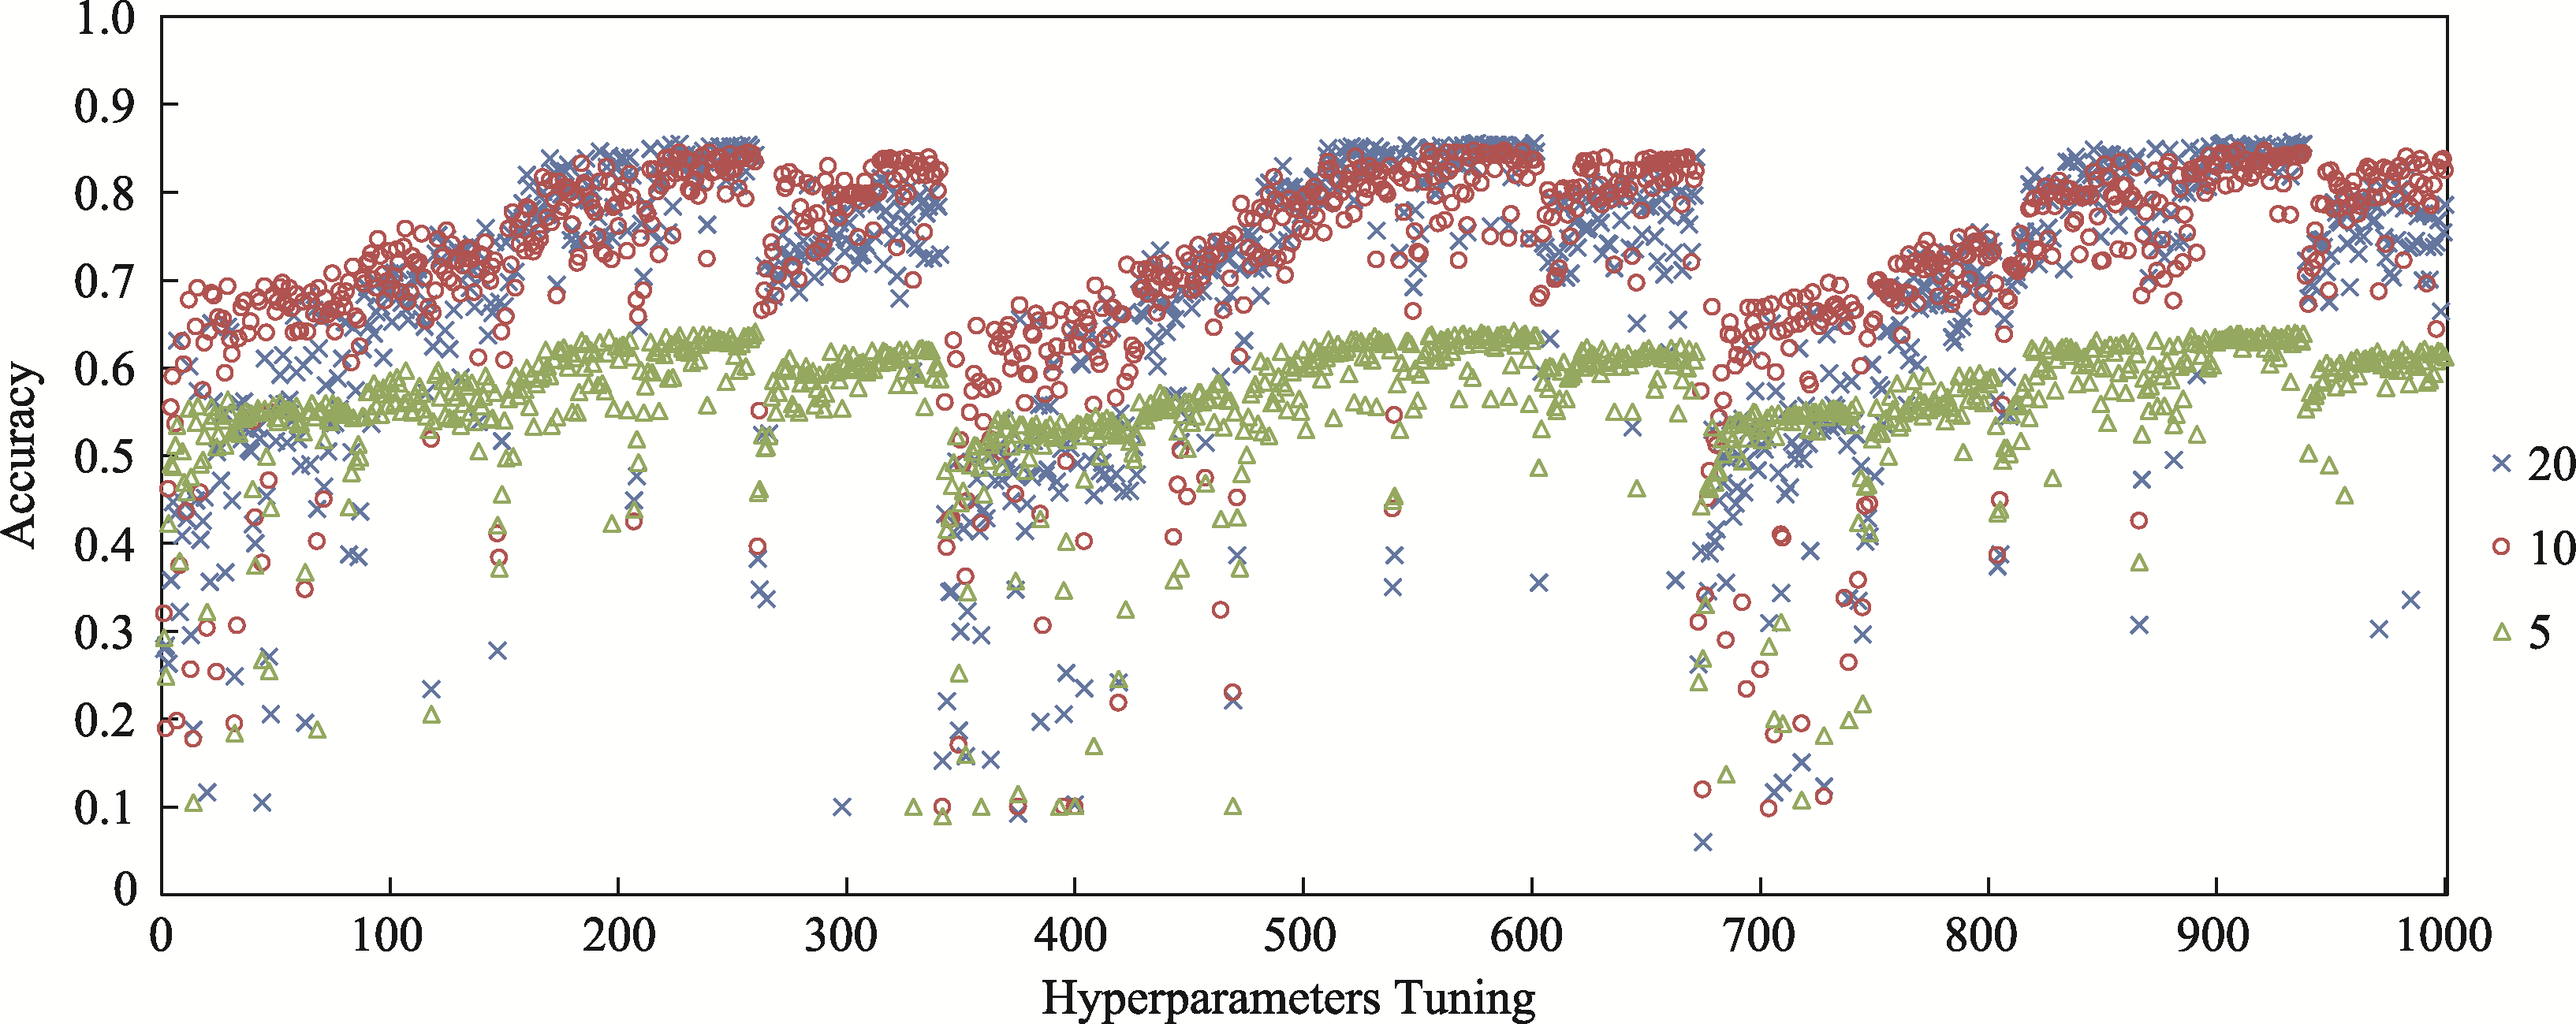
Figure 1 Hyperparameter random search results for LSTM models at varying sequence lengths. Identical x-axis positions indicate identical hyperparameter combinations.
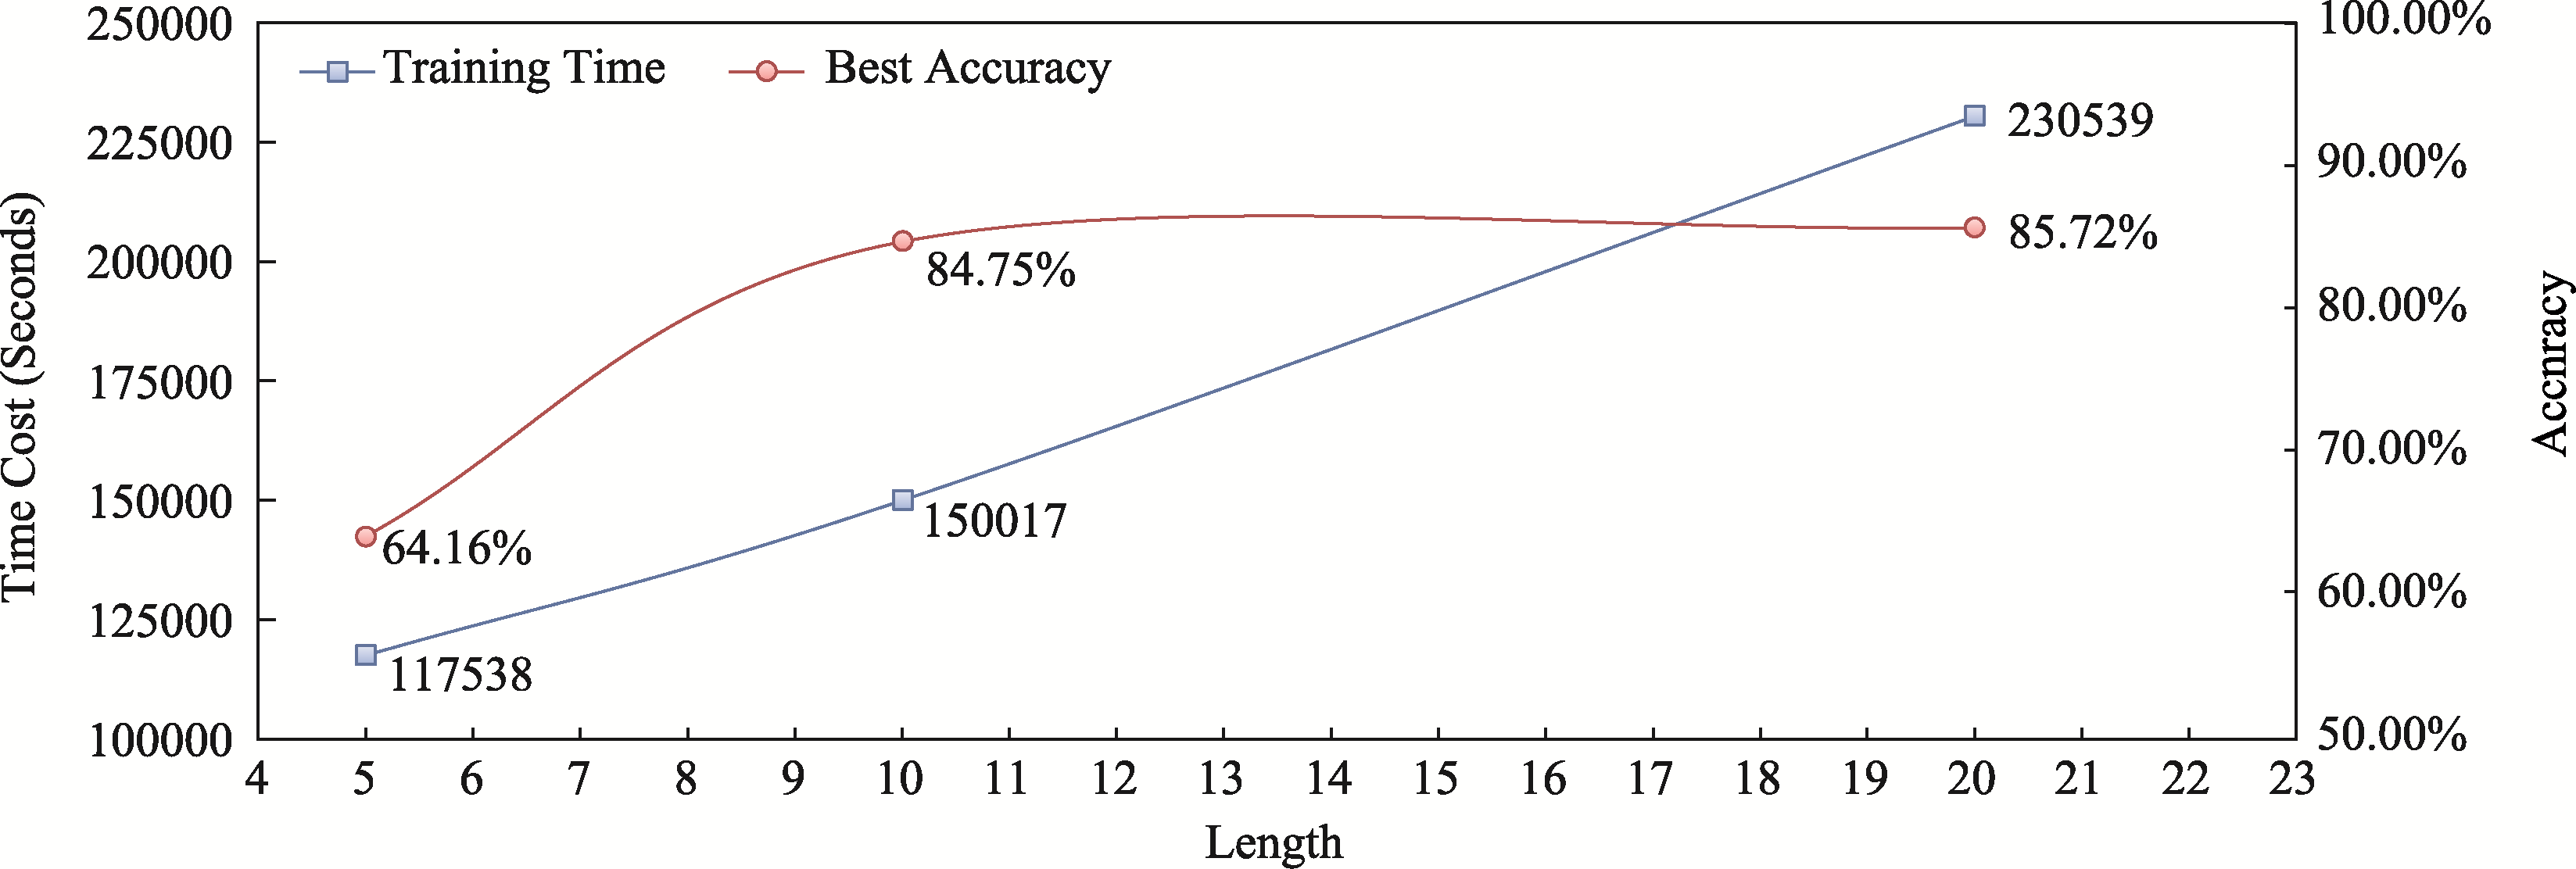
Figure 2 Training time and best accuracy of LSTM models across different sequence lengths.
| Optimal Hyperparameter Configuration | Optimal Metric | ||
|---|---|---|---|
| Hyperparameter | Value | Metric | Value |
| Learning rate | 0.01 | Accuracy | 0.847 |
| Number of LSTM layers | 2 | Precision | 0.847 |
| Units per LSTM layer | 32, 38 | Recall | 0.847 |
| Number of fully connected layers | 5 | F1-Score | 0.847 |
| Units per FC layer | 38, 39, 34, 31, 27 | Kappa | 0.831 |
| Activation function | Tanh | ||
Table 1 Hyperparameter Tuning Results
| Optimal Hyperparameter Configuration | Optimal Metric | ||
|---|---|---|---|
| Hyperparameter | Value | Metric | Value |
| Learning rate | 0.01 | Accuracy | 0.847 |
| Number of LSTM layers | 2 | Precision | 0.847 |
| Units per LSTM layer | 32, 38 | Recall | 0.847 |
| Number of fully connected layers | 5 | F1-Score | 0.847 |
| Units per FC layer | 38, 39, 34, 31, 27 | Kappa | 0.831 |
| Activation function | Tanh | ||
| Conditions | Level | acc | ||||
|---|---|---|---|---|---|---|
| CDF | EKC | PA | LSTM | Improvement Rate | ||
| Number of factors | 1 | 0.677 | 0.922 | 0.944 | 0.969 | 2.58% |
| 2 | 0.722 | 0.715 | 0.677 | 0.879 | 21.69% | |
| 4 | 0.558 | 0.516 | 0.493 | 0.732 | 31.08% | |
| 6 | 0.450 | 0.419 | 0.394 | 0.523 | 16.17% | |
| 8 | 0.373 | 0.358 | 0.330 | 0.636 | 70.62% | |
| 10 | 0.313 | 0.319 | 0.280 | 0.865 | 171.09% | |
| Factor correlations | 0.00 | 0.686 | 0.724 | 0.761 | 0.901 | 18.29% |
| 0.25 | 0.619 | 0.650 | 0.662 | 0.867 | 31.00% | |
| 0.50 | 0.485 | 0.495 | 0.450 | 0.775 | 56.44% | |
| 0.75 | 0.273 | 0.298 | 0.206 | 0.527 | 76.96% | |
| Indicators per factor | 4 | 0.370 | 0.416 | 0.381 | 0.772 | 85.47% |
| 7 | 0.547 | 0.568 | 0.547 | 0.765 | 34.51% | |
| 10 | 0.630 | 0.640 | 0.631 | 0.765 | 19.54% | |
| Primary loadings | L | 0.332 | 0.347 | 0.376 | 0.687 | 82.60% |
| M | 0.525 | 0.564 | 0.540 | 0.784 | 39.14% | |
| H | 0.690 | 0.714 | 0.643 | 0.831 | 16.25% | |
| Cross- loadings | L | 0.486 | 0.519 | 0.508 | 0.750 | 44.59% |
| H | 0.545 | 0.565 | 0.532 | 0.785 | 38.99% | |
| Sample size | 100 | 0.286 | 0.299 | 0.309 | 0.637 | 106.58% |
| 200 | 0.429 | 0.461 | 0.454 | 0.755 | 63.70% | |
| 500 | 0.617 | 0.657 | 0.614 | 0.823 | 25.26% | |
| 1000 | 0.731 | 0.750 | 0.703 | 0.854 | 13.94% | |
Table 2 Accuracy of Factor Retention Across Methods Under Various Data Conditions
| Conditions | Level | acc | ||||
|---|---|---|---|---|---|---|
| CDF | EKC | PA | LSTM | Improvement Rate | ||
| Number of factors | 1 | 0.677 | 0.922 | 0.944 | 0.969 | 2.58% |
| 2 | 0.722 | 0.715 | 0.677 | 0.879 | 21.69% | |
| 4 | 0.558 | 0.516 | 0.493 | 0.732 | 31.08% | |
| 6 | 0.450 | 0.419 | 0.394 | 0.523 | 16.17% | |
| 8 | 0.373 | 0.358 | 0.330 | 0.636 | 70.62% | |
| 10 | 0.313 | 0.319 | 0.280 | 0.865 | 171.09% | |
| Factor correlations | 0.00 | 0.686 | 0.724 | 0.761 | 0.901 | 18.29% |
| 0.25 | 0.619 | 0.650 | 0.662 | 0.867 | 31.00% | |
| 0.50 | 0.485 | 0.495 | 0.450 | 0.775 | 56.44% | |
| 0.75 | 0.273 | 0.298 | 0.206 | 0.527 | 76.96% | |
| Indicators per factor | 4 | 0.370 | 0.416 | 0.381 | 0.772 | 85.47% |
| 7 | 0.547 | 0.568 | 0.547 | 0.765 | 34.51% | |
| 10 | 0.630 | 0.640 | 0.631 | 0.765 | 19.54% | |
| Primary loadings | L | 0.332 | 0.347 | 0.376 | 0.687 | 82.60% |
| M | 0.525 | 0.564 | 0.540 | 0.784 | 39.14% | |
| H | 0.690 | 0.714 | 0.643 | 0.831 | 16.25% | |
| Cross- loadings | L | 0.486 | 0.519 | 0.508 | 0.750 | 44.59% |
| H | 0.545 | 0.565 | 0.532 | 0.785 | 38.99% | |
| Sample size | 100 | 0.286 | 0.299 | 0.309 | 0.637 | 106.58% |
| 200 | 0.429 | 0.461 | 0.454 | 0.755 | 63.70% | |
| 500 | 0.617 | 0.657 | 0.614 | 0.823 | 25.26% | |
| 1000 | 0.731 | 0.750 | 0.703 | 0.854 | 13.94% | |
| Conditions | Level | bias | |||
|---|---|---|---|---|---|
| CDF | EKC | PA | LSTM | ||
| Number of factors | 1 | 0.363 | -0.063 | -0.038 | 0.031 |
| 2 | -0.053 | -0.290 | -0.326 | 0.010 | |
| 4 | -0.892 | -0.936 | -1.131 | 0.524 | |
| 6 | -1.826 | -1.689 | -2.061 | 0.669 | |
| 8 | -2.851 | -2.489 | -3.055 | 0.164 | |
| 10 | -3.919 | -3.309 | -4.095 | -0.406 | |
| Factor correlations | 0.00 | -0.616 | -0.824 | -0.476 | 0.088 |
| 0.25 | -0.893 | -1.049 | -0.858 | 0.117 | |
| 0.50 | -1.596 | -1.555 | -2.005 | 0.242 | |
| 0.75 | -3.014 | -2.422 | -3.798 | 0.215 | |
| Indicators per factor | 4 | -1.853 | -2.133 | -2.371 | -0.269 |
| 7 | -1.476 | -1.334 | -1.671 | 0.208 | |
| 10 | -1.261 | -0.921 | -1.311 | 0.558 | |
| Primary loadings | L | -2.466 | -2.462 | -2.279 | 0.464 |
| M | -1.447 | -1.365 | -1.727 | 0.151 | |
| H | -0.676 | -0.561 | -1.347 | -0.118 | |
| Cross-loadings | L | -1.838 | -1.889 | -1.963 | 0.176 |
| H | -1.222 | -1.037 | -1.605 | 0.155 | |
| Sample size | 100 | -2.609 | -2.722 | -2.695 | 0.270 |
| 200 | -1.856 | -1.899 | -2.022 | 0.129 | |
| 500 | -1.036 | -0.908 | -1.383 | 0.150 | |
| 1000 | -0.618 | -0.321 | -1.037 | 0.113 | |
Table 3 Mean Bias in Factor Retention Across Methods Under Various Data Conditions
| Conditions | Level | bias | |||
|---|---|---|---|---|---|
| CDF | EKC | PA | LSTM | ||
| Number of factors | 1 | 0.363 | -0.063 | -0.038 | 0.031 |
| 2 | -0.053 | -0.290 | -0.326 | 0.010 | |
| 4 | -0.892 | -0.936 | -1.131 | 0.524 | |
| 6 | -1.826 | -1.689 | -2.061 | 0.669 | |
| 8 | -2.851 | -2.489 | -3.055 | 0.164 | |
| 10 | -3.919 | -3.309 | -4.095 | -0.406 | |
| Factor correlations | 0.00 | -0.616 | -0.824 | -0.476 | 0.088 |
| 0.25 | -0.893 | -1.049 | -0.858 | 0.117 | |
| 0.50 | -1.596 | -1.555 | -2.005 | 0.242 | |
| 0.75 | -3.014 | -2.422 | -3.798 | 0.215 | |
| Indicators per factor | 4 | -1.853 | -2.133 | -2.371 | -0.269 |
| 7 | -1.476 | -1.334 | -1.671 | 0.208 | |
| 10 | -1.261 | -0.921 | -1.311 | 0.558 | |
| Primary loadings | L | -2.466 | -2.462 | -2.279 | 0.464 |
| M | -1.447 | -1.365 | -1.727 | 0.151 | |
| H | -0.676 | -0.561 | -1.347 | -0.118 | |
| Cross-loadings | L | -1.838 | -1.889 | -1.963 | 0.176 |
| H | -1.222 | -1.037 | -1.605 | 0.155 | |
| Sample size | 100 | -2.609 | -2.722 | -2.695 | 0.270 |
| 200 | -1.856 | -1.899 | -2.022 | 0.129 | |
| 500 | -1.036 | -0.908 | -1.383 | 0.150 | |
| 1000 | -0.618 | -0.321 | -1.037 | 0.113 | |
| Group | Size | Age | Independence Negative (F1) | Dependence Positive (F2) | Low Achievement Negative (F3) | High Achievement Positive (F4) | Total Scale |
|---|---|---|---|---|---|---|---|
| Male | 406 | 15.823±0.736 | 11.421±4.450 | 14.244±4.557 | 10.739±4.550 | 15.778±5.299 | 52.182±15.043 |
| Female | 581 | 15.823±0.831 | 10.859±4.206 | 13.274±4.473 | 9.644±4.338 | 15.279±5.552 | 49.055±14.764 |
| Overall | 987 | 15.823±0.793 | 11.090±4.315 | 13.673±4.530 | 10.094±4.457 | 15.484±5.452 | 50.341±14.951 |
| α coefficient | 0.857 | 0.817 | 0.885 | 0.889 | 0.923 | ||
Table 4 Descriptive Statistics (M ± SD) and α Coefficients for the Parental Psychological Control Scale
| Group | Size | Age | Independence Negative (F1) | Dependence Positive (F2) | Low Achievement Negative (F3) | High Achievement Positive (F4) | Total Scale |
|---|---|---|---|---|---|---|---|
| Male | 406 | 15.823±0.736 | 11.421±4.450 | 14.244±4.557 | 10.739±4.550 | 15.778±5.299 | 52.182±15.043 |
| Female | 581 | 15.823±0.831 | 10.859±4.206 | 13.274±4.473 | 9.644±4.338 | 15.279±5.552 | 49.055±14.764 |
| Overall | 987 | 15.823±0.793 | 11.090±4.315 | 13.673±4.530 | 10.094±4.457 | 15.484±5.452 | 50.341±14.951 |
| α coefficient | 0.857 | 0.817 | 0.885 | 0.889 | 0.923 | ||
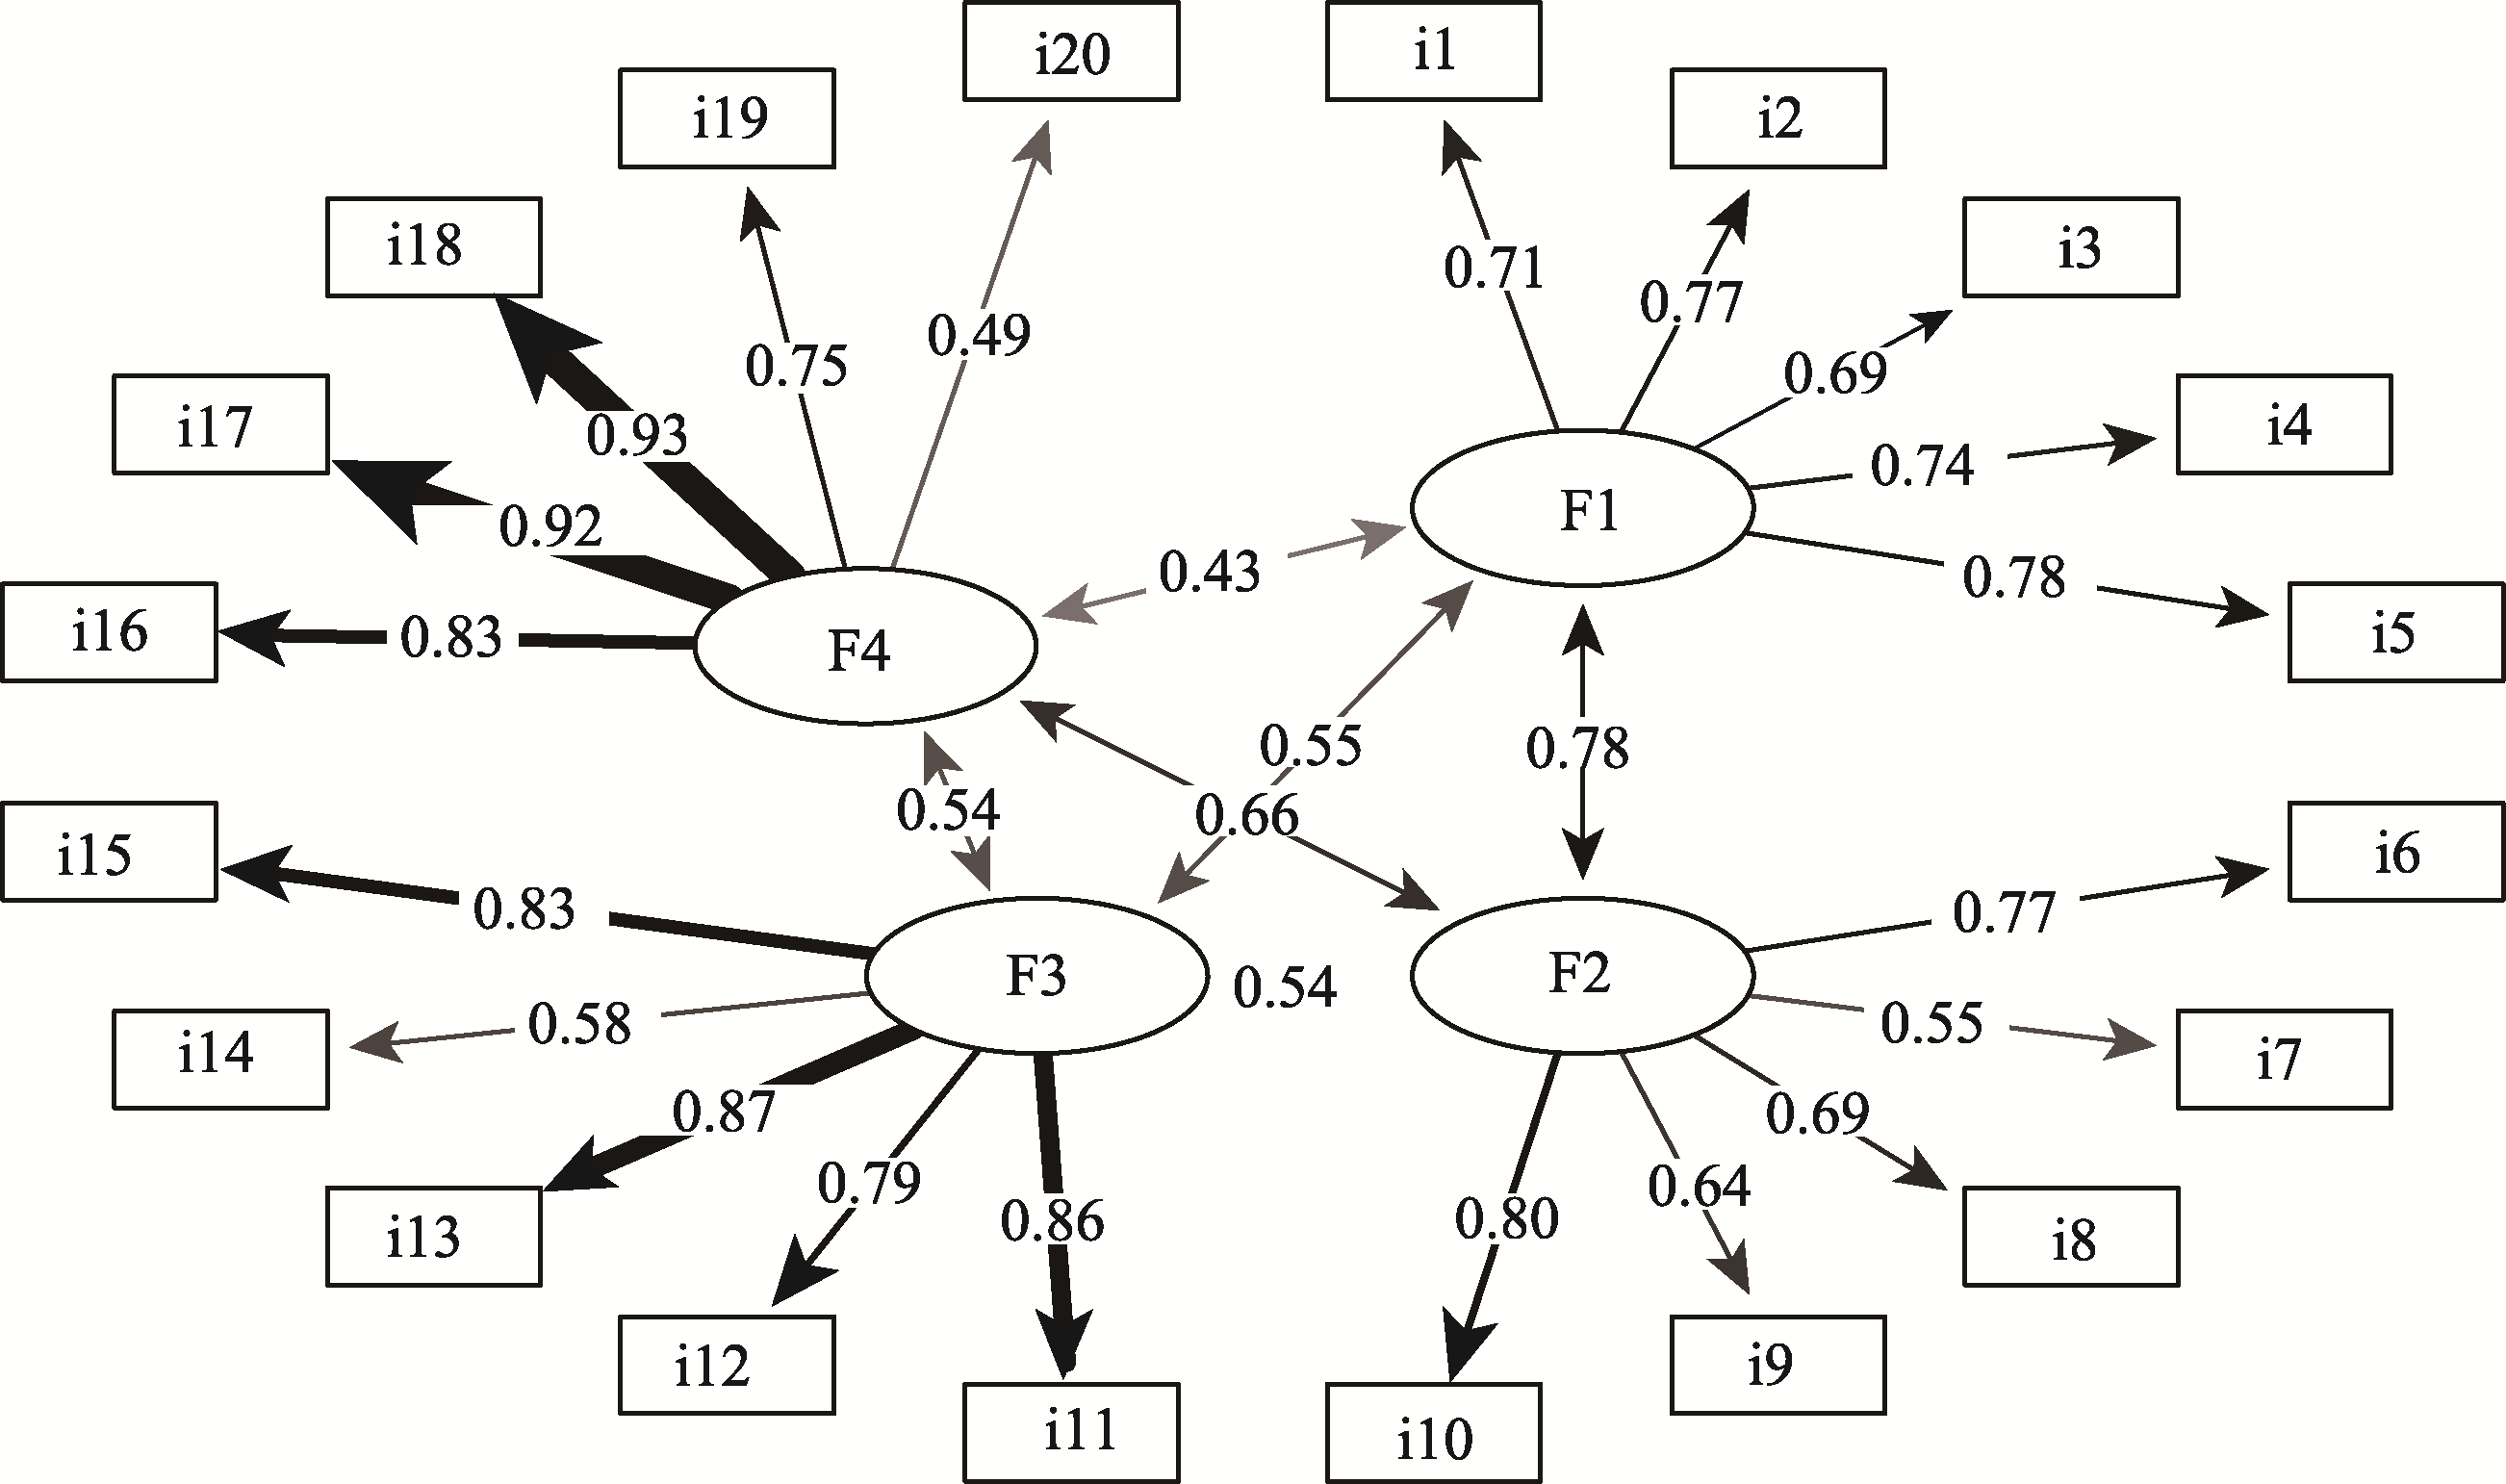
Figure 3 CFA Structure of the Parental Psychological Control Scale.
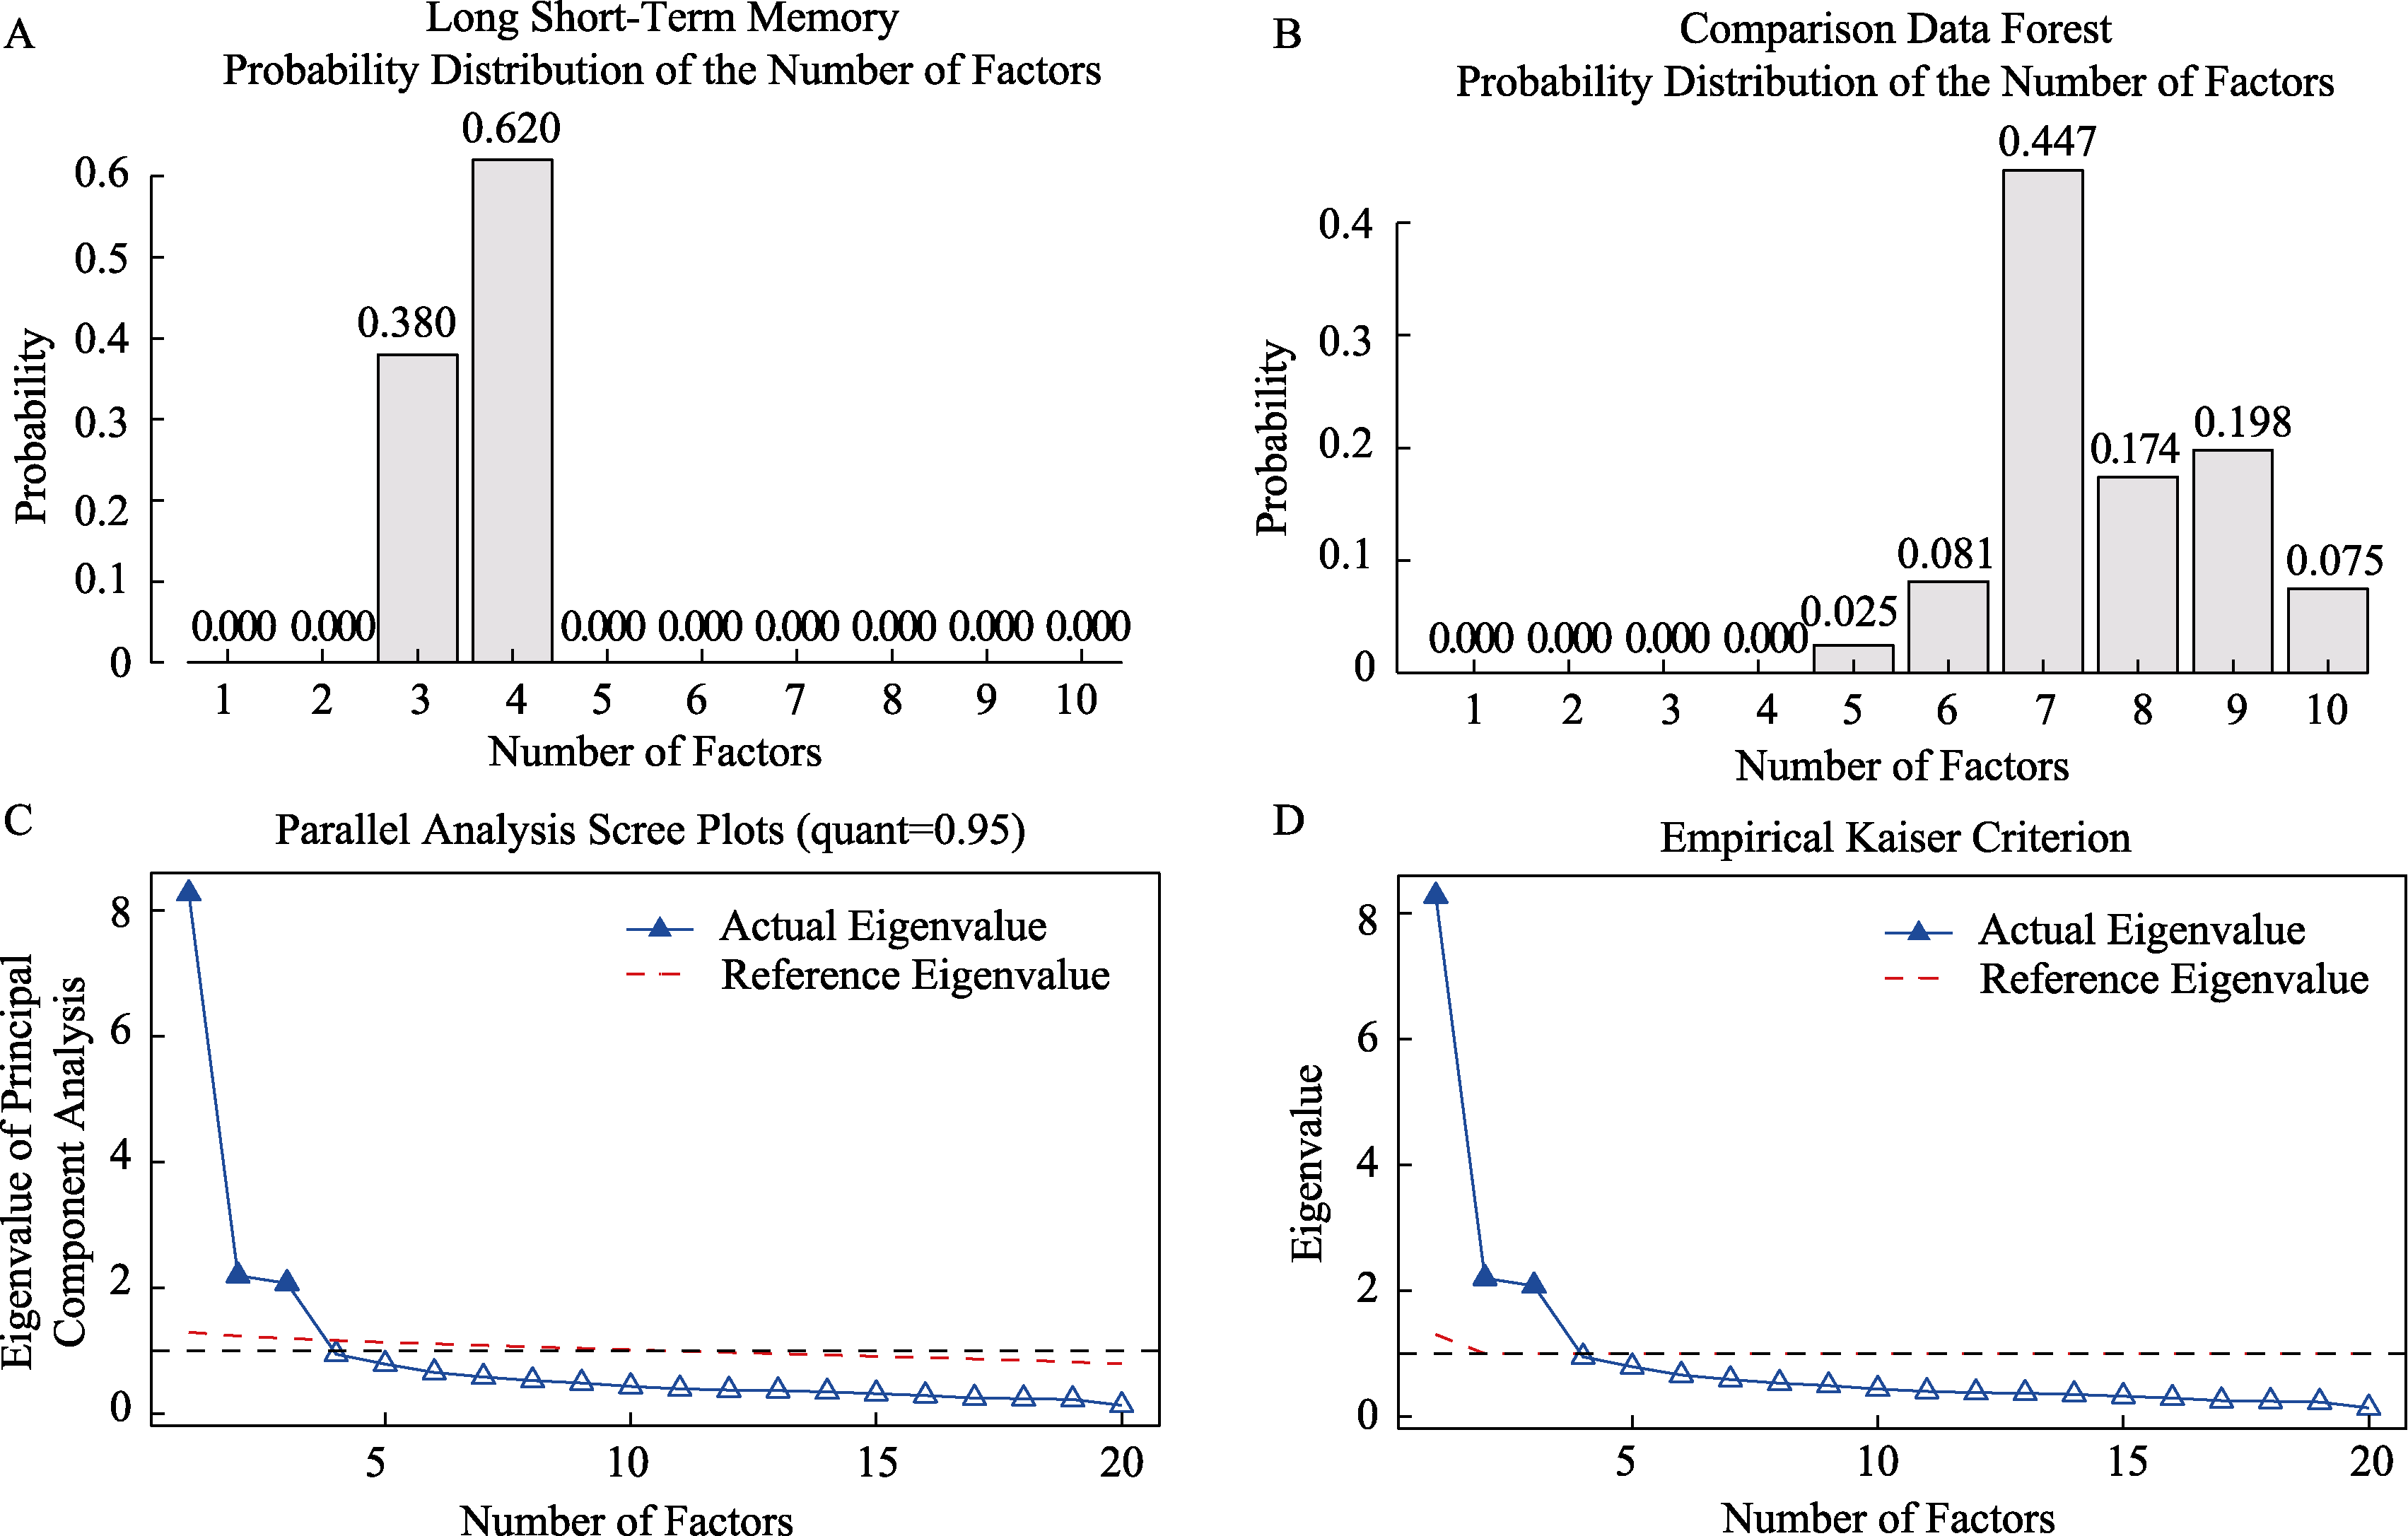
Figure 4 Visualization Results of the Four Factor Retention Methods.
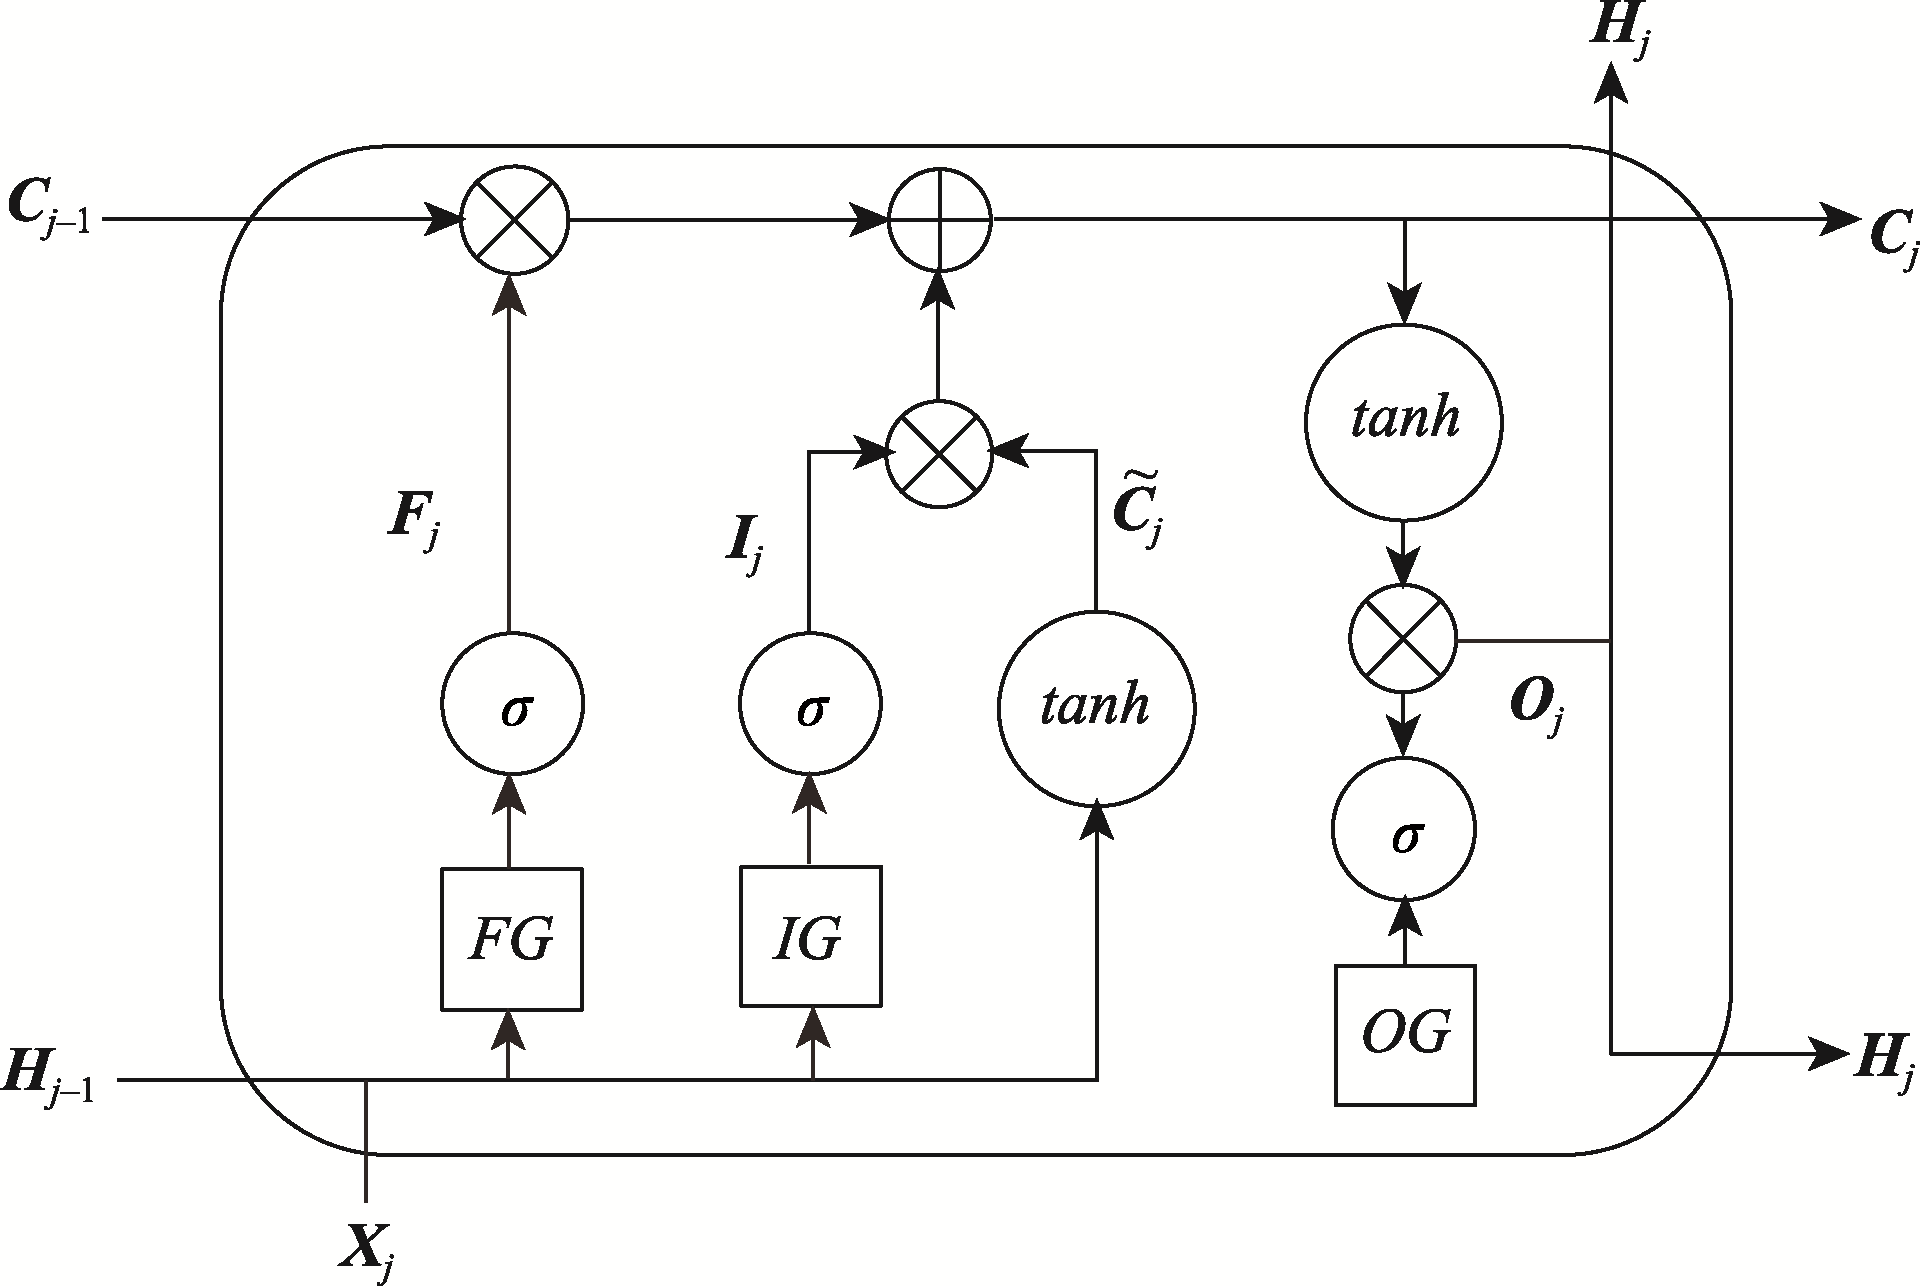
Figure A1 Schematic diagram of LSTM memory cell.
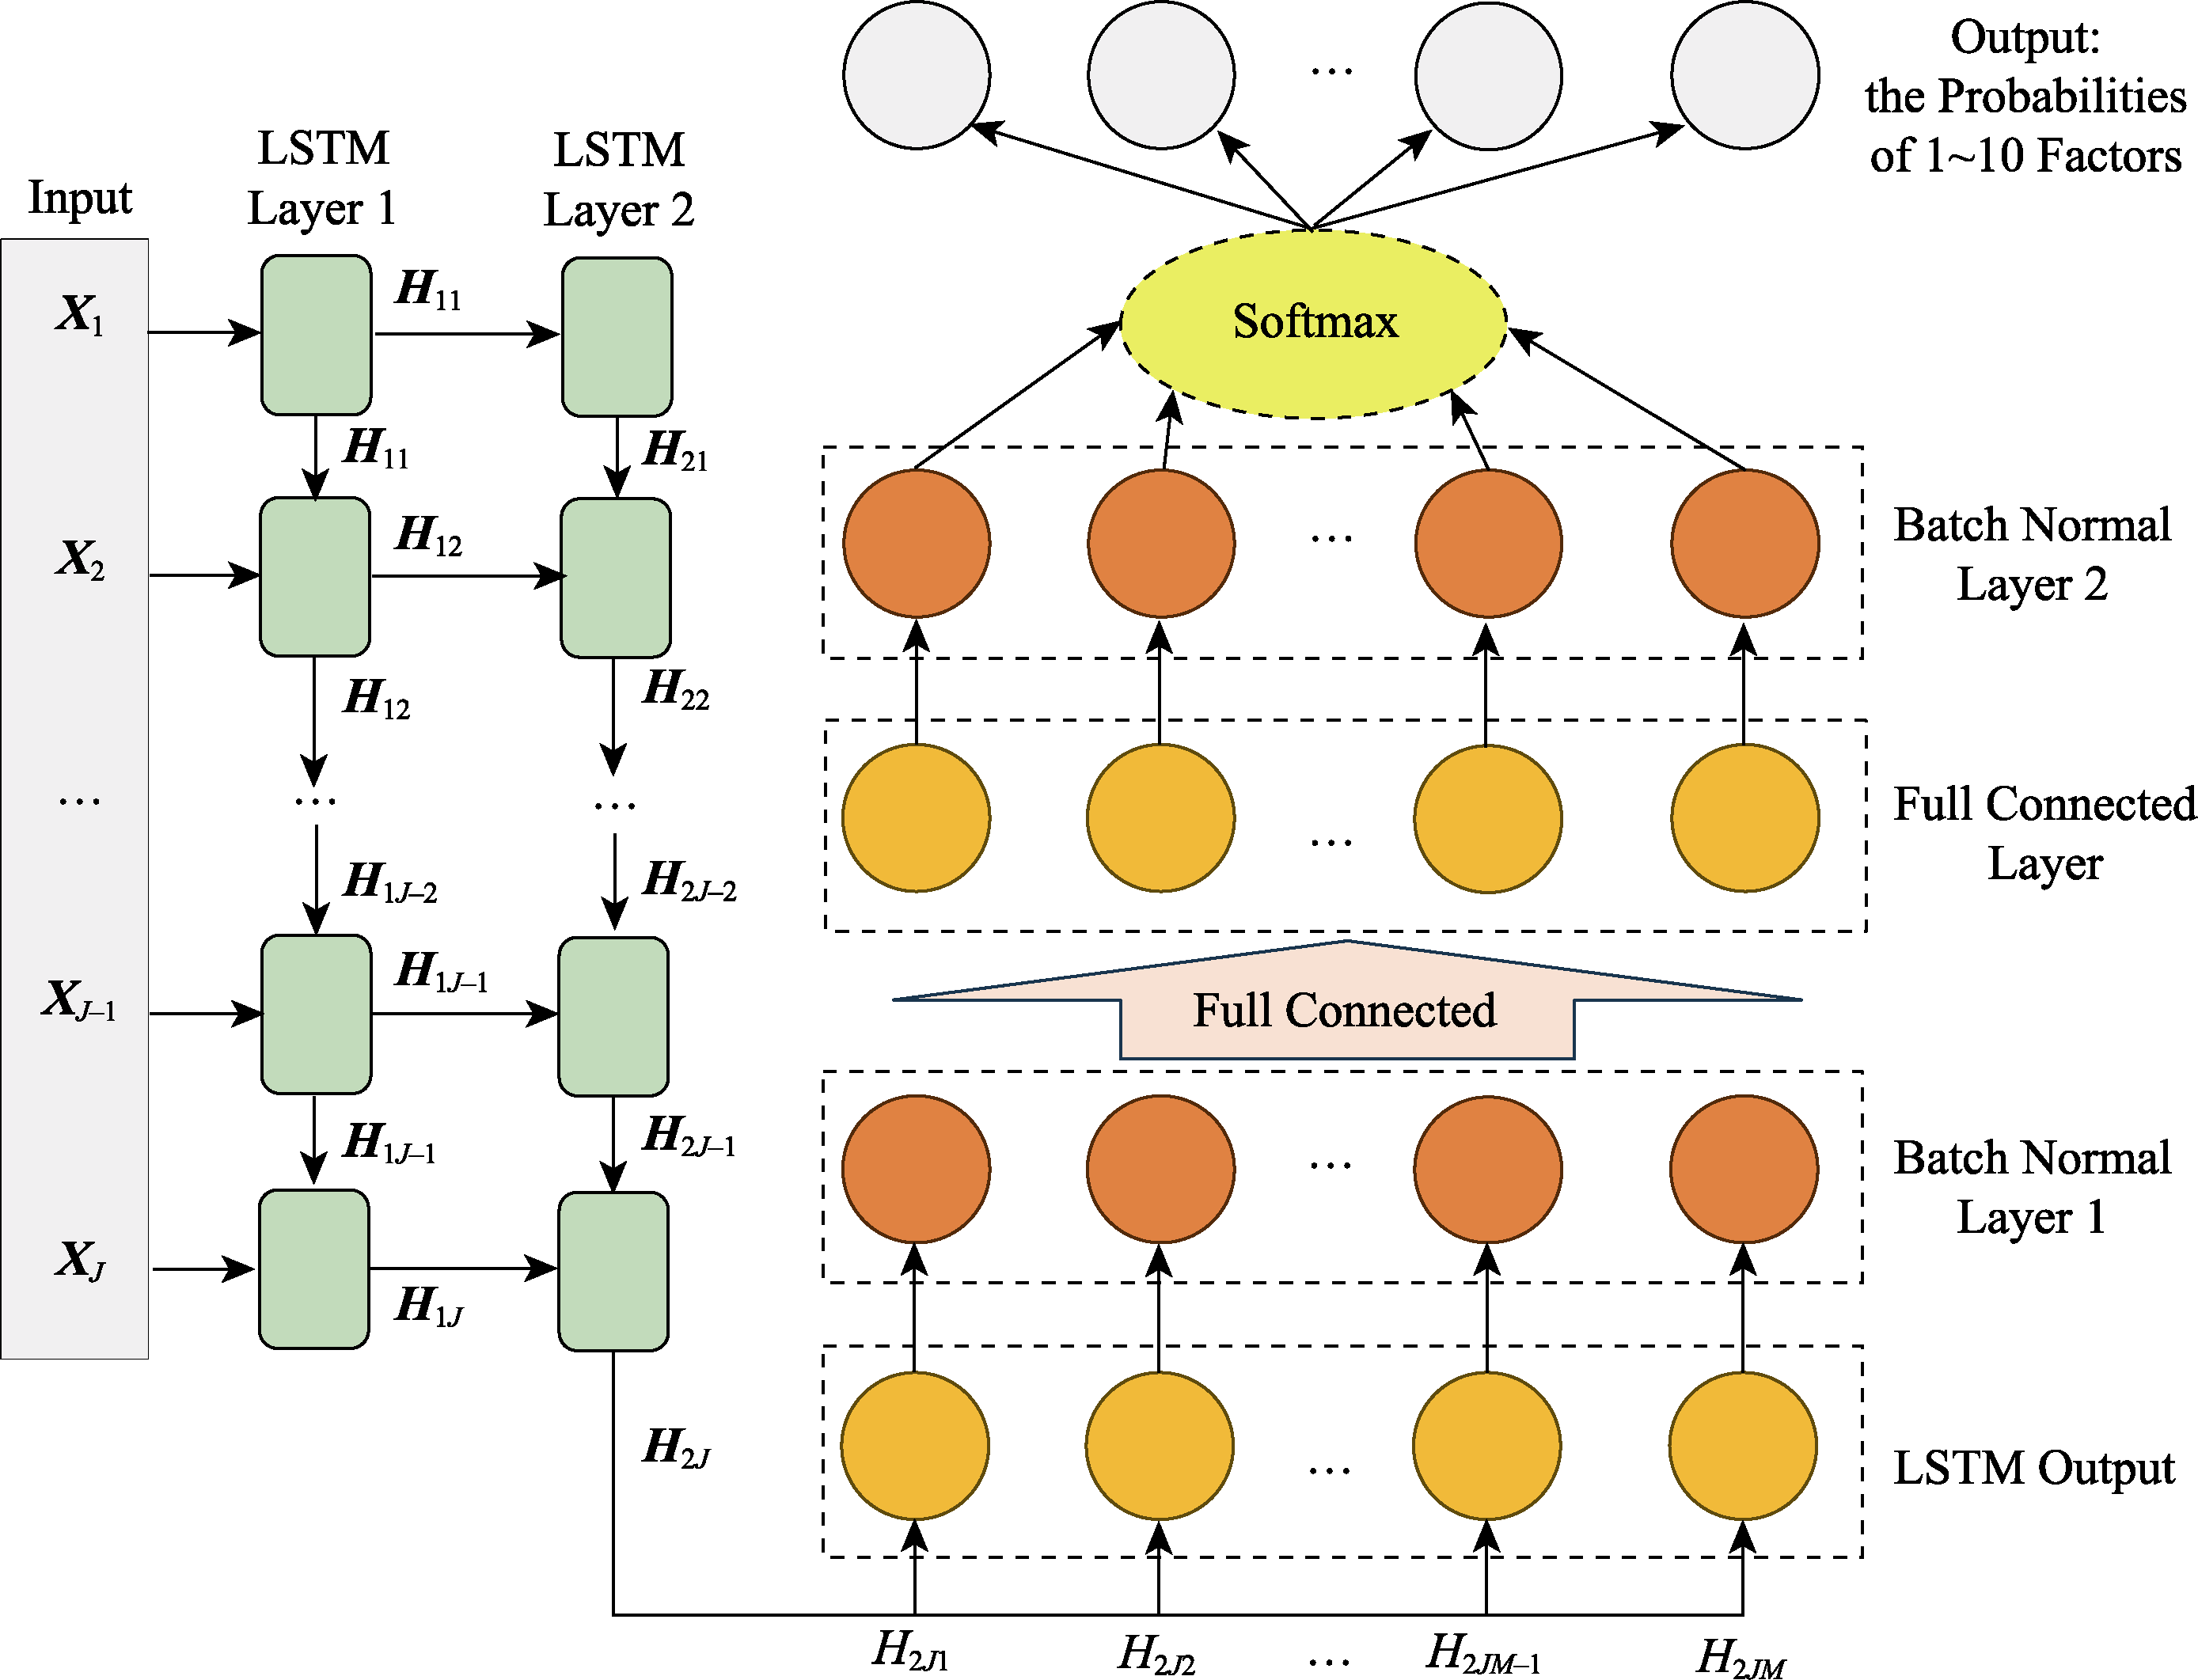
Figure A2 Example of the Basic Neural Network Structure Consisting of LSTM, Fully Connected, and Batch Normalization Layers
| Class | Predicted Class | Total | |||
|---|---|---|---|---|---|
| C1 | C2 | C3 | |||
| True Class | C1 | a | g | h | j |
| C2 | d | b | i | k | |
| C3 | e | f | c | l | |
| Total | m | n | o | p | |
Table A1 Example of a Confusion Matrix for a Three-Class Classification Task
| Class | Predicted Class | Total | |||
|---|---|---|---|---|---|
| C1 | C2 | C3 | |||
| True Class | C1 | a | g | h | j |
| C2 | d | b | i | k | |
| C3 | e | f | c | l | |
| Total | m | n | o | p | |
| [1] |
Auerswald M., & Moshagen M. (2019). How to determine the number of factors to retain in exploratory factor analysis: A comparison of extraction methods under realistic conditions. Psychological Methods, 24(4), 468-491.
doi: 10.1037/met0000200 pmid: 30667242 |
| [2] | Bergstra J., & Bengio Y. (2012). Random search for hyper-parameter optimization. Journal of Machine Learning Research, 13, 281-305. |
| [3] |
Braeken J., & van Assen M. A. (2017). An empirical Kaiser criterion. Psychological Methods, 22(3), 450-466.
doi: 10.1037/met0000074 pmid: 27031883 |
| [4] | Brownlee J. (2018). Deep Learning for Time Series Forecasting: Predict the Future with MLPs, CNNs and LSTMs in Python. Machine Learning Mastery. |
| [5] | Chen S., Abhinav S., Saurabh S., & Abhinav G. (2017). Revisiting unreasonable effectiveness of data in deep learning era. arXiv preprint:1707.02968. |
| [6] | DeepSeek-AI Liu, A. Feng, B. Xue, B. Wang, B. Wu, B.,... Pan Z.,(2024). DeepSeek-V3 technical report. arXiv preprint: 2412.19437. |
| [7] | Deng Y., Gao X., Xu C., Sun Z., Yue Y., & Liu X. (2019). Reliability and validity test of Dependency-Oriented and Achievement-Oriented Psychological Control Scale in Chinese adolescents. Chinese Journal of Clinical Psychology, 27(2), 253-257. |
| [8] | de Winter J. C., & Dodou D. (2012). Factor recovery by principal axis factoring and maximum likelihood factor analysis as a function of factor pattern and sample size. Journal of Applied Statistics, 39(4), 695-710. |
| [9] |
Dinno A. (2009). Exploring the sensitivity of Horn’s parallel analysis to the distributional form of random data. Multivariate Behavioral Research, 44(3), 362-388.
doi: 10.1080/00273170902938969 URL |
| [10] |
Fava J. L., & Velicer W. F. (1996). The effects of underextraction in factor and component analyses. Educational and Psychological Measurement, 56(6), 907-929.
doi: 10.1177/0013164496056006001 URL |
| [11] | Goodfellow I., Bengio Y., & Courville A. (2016). Deep learning. MIT Press. |
| [12] | Goretzko D. (2025). How many factors to retain in exploratory factor analysis? A critical overview of factor retention methods. Psychological Methods, https://doi.org/10.1037/met0000733. |
| [13] |
Goretzko D., & Bühner M. (2020). One model to rule them all? Using machine learning algorithms to determine the number of factors in exploratory factor analysis. Psychological Methods, 25(6), 776-786.
doi: 10.1037/met0000262 URL |
| [14] |
Goretzko D., & Bühner M. (2022). Factor retention using machine learning with ordinal data. Applied Psychological Measurement, 46(5), 406-421.
doi: 10.1177/01466216221089345 pmid: 35812814 |
| [15] |
Goretzko D., & Ruscio J. (2024). The comparison data forest: A new comparison data approach to determine the number of factors in exploratory factor analysis. Behavior Research Methods, 56(3), 1838-1851.
doi: 10.3758/s13428-023-02122-4 |
| [16] | Heaton J. (2008). Feedforward neural networks (pp. 143-172). In Introduction to neural networks with Java (2nd ed.). Heaton Research, Inc. |
| [17] |
Hochreiter S., & Schmidhuber J. (1997). Long short-term memory. Neural Computation, 9(8), 1735-1780.
doi: 10.1162/neco.1997.9.8.1735 pmid: 9377276 |
| [18] |
Horn J. L. (1965). A rationale and test for the number of factors in factor analysis. Psychometrika, 30(2), 179-185.
doi: 10.1007/BF02289447 URL |
| [19] |
Humphreys L. G., & Montanelli R. G. (1975). An investigation of the parallel analysis criterion for determining the number of common factors. Multivariate Behavioral Research, 10(2), 193-205.
doi: 10.1207/s15327906mbr1002_5 URL |
| [20] | Ioffe S., & Szegedy C. (2015). Batch normalization: Accelerating deep network training by reducing internal covariate shift. arXiv preprint:1502.03167. |
| [21] |
Kaiser H. F. (1960). The application of electronic computers to factor analysis. Educational and Psychological Measurement, 20, 141-151.
doi: 10.1177/001316446002000116 URL |
| [22] | Kalinowski T., Ushey K., Allaire J. J., RStudio, Tang Y., Eddelbuettel D.,... Geelnard M. (2025). reticulate: Interface to Python. R package version 1.42.0. |
| [23] | Kingma D. P., & Ba J. (2014). Adam: A method for stochastic optimization. arXiv preprint: 1412.6980. |
| [24] | Lange S., Helfrich K., & Ye Q. (2022). Batch normalization preconditioning for neural network training. Journal of Machine Learning Research, 23(1), 3118-3158. |
| [25] | LeCun Y., Bengio Y., & Hinton G. (2015). Deep learning. Nature, 521, 436-444. |
| [26] |
Li Y., Wen Z., Hau K.-T., Yuan K.-H., & Peng Y. (2020). Effects of cross-loadings on determining the number of factors to retain. Structural Equation Modeling: A Multidisciplinary Journal, 27(6), 841-863.
doi: 10.1080/10705511.2020.1745075 URL |
| [27] |
Lorenzo-Seva U., Timmerman M. E., & Kiers H. A. (2011). The Hull method for selecting the number of common factors. Multivariate Behavioral Research, 46(2), 340-364.
doi: 10.1080/00273171.2011.564527 pmid: 26741331 |
| [28] |
Marčenko V. A., & Pastur L. A. (1967). Distribution of eigenvalues for some sets of random matrices. Mathematics of the USSR-Sbornik, 1, 457-483.
doi: 10.1070/SM1967v001n04ABEH001994 URL |
| [29] | Nair V., & Hinton G. E. (2010). Rectified linear units improve restricted Boltzmann machines. In Proceedings of the 27th International Conference on Machine Learning (ICML-10) (pp. 807-814). Omnipress. |
| [30] | Peres-Neto P. R., Jackson D. A., & Somers K. M. (2005). How many principal components? Stopping rules for determining the number of non-trivial axes revisited. Computational Statistics & Data Analysis, 49(4), 974-997. |
| [31] |
Qin H., & Guo L. (2024). Using machine learning to improve Q-matrix validation. Behavior Research Methods, 56(3), 1916-1935.
doi: 10.3758/s13428-023-02126-0 |
| [32] | Qin H., & Guo L. (2025a). EFAfactors: Determining the number of factors in exploratory factor analysis. R package version 1.2.1. |
| [33] | Qin H., & Guo L. (2025b). LSTMfactors: Determining the number of factors in exploratory factor analysis by LSTM. R package version 1.0.0. |
| [34] | Paszke A., Gross S., Massa F., Lerer A., Bradbury J., Chanan G.,... Chintala S. (2019). PyTorch: An imperative style, high- performance deep learning library. In Proceedings of the 33rd International Conference on Neural Information Processing Systems (pp. Article 721). Curran Associates Inc. |
| [35] | Pedregosa F., Varoquaux G., Gramfort A., Michel V., Thirion B., Grisel O.,... Duchesnay É. (2011). Scikit-learn: Machine learning in Python. Journal of Machine Learning Research, 12, 2825-2830. |
| [36] | R Core Team. (2025). R: A Language and Environment for Statistical Computing. R Foun dation for Statistical Computing, Vienna, Austria. https://www.R-project.org |
| [37] |
Ruscio J., & Kaczetow W. (2008). Simulating multivariate nonnormal data using an iterative algorithm. Multivariate Behavioral Research, 43(3), 355-381.
doi: 10.1080/00273170802285693 pmid: 26741201 |
| [38] |
Ruscio J., & Roche B. (2012). Determining the number of factors to retain in an exploratory factor analysis using comparison data of known factorial structure. Psychological Assessment, 24(2), 282-292.
doi: 10.1037/a0025697 pmid: 21966933 |
| [39] |
Soenens B., & Vansteenkiste M. (2010). A theoretical upgrade of the concept of parental psychological control: Proposing new insights on the basis of self-determination theory. Developmental Review, 30(1), 74-99.
doi: 10.1016/j.dr.2009.11.001 URL |
| [40] |
Velicer W. F. (1976). Determining the number of components from the matrix of partial correlations. Psychometrika, 41(3), 321-327.
doi: 10.1007/BF02293557 URL |
| [41] |
Wood J. M., Tataryn D. J., & Gorsuch R. L. (1996). Effects of under- and overextraction on principal axis factor analysis with varimax rotation. Psychological Methods, 1(4), 354-365.
doi: 10.1037/1082-989X.1.4.354 URL |
| [42] |
Zwick W. R., & Velicer W. F. (1986). Comparison of five rules for determining the number of components to retain. Psychological Bulletin, 99(3), 432-442.
doi: 10.1037/0033-2909.99.3.432 URL |
| [1] | Zou Hong,Jiang Suo. Development of the Adolescent Self-disclosure with Peers Questionnaire [J]. , 2008, 40(02): 184-192. |
| [2] | Li-Chaoping,Xiaoxuan,Shi-Kan-,Chen-Xuefeng. Psychological Empowerment: Measurement and its Effect on Employees’ Work Attitude in China [J]. , 2006, 38(01): 99-106. |
| [3] | Ma-Chao,Ling-Wenquan,Fang-Liluo. Construct Dimension of the Enterprise Staff’s Perceptions of Organizational Politics [J]. , 2006, 38(01): 107-115. |
| [4] | Wang Huaiming, Ma Mouchao. THE FACTORS OF CELEBRITY ENDORSER’S CREDIBILITY [J]. , 2004, 36(03): 365-369. |
| Viewed | ||||||
|
Full text |
|
|||||
|
Abstract |
|
|||||