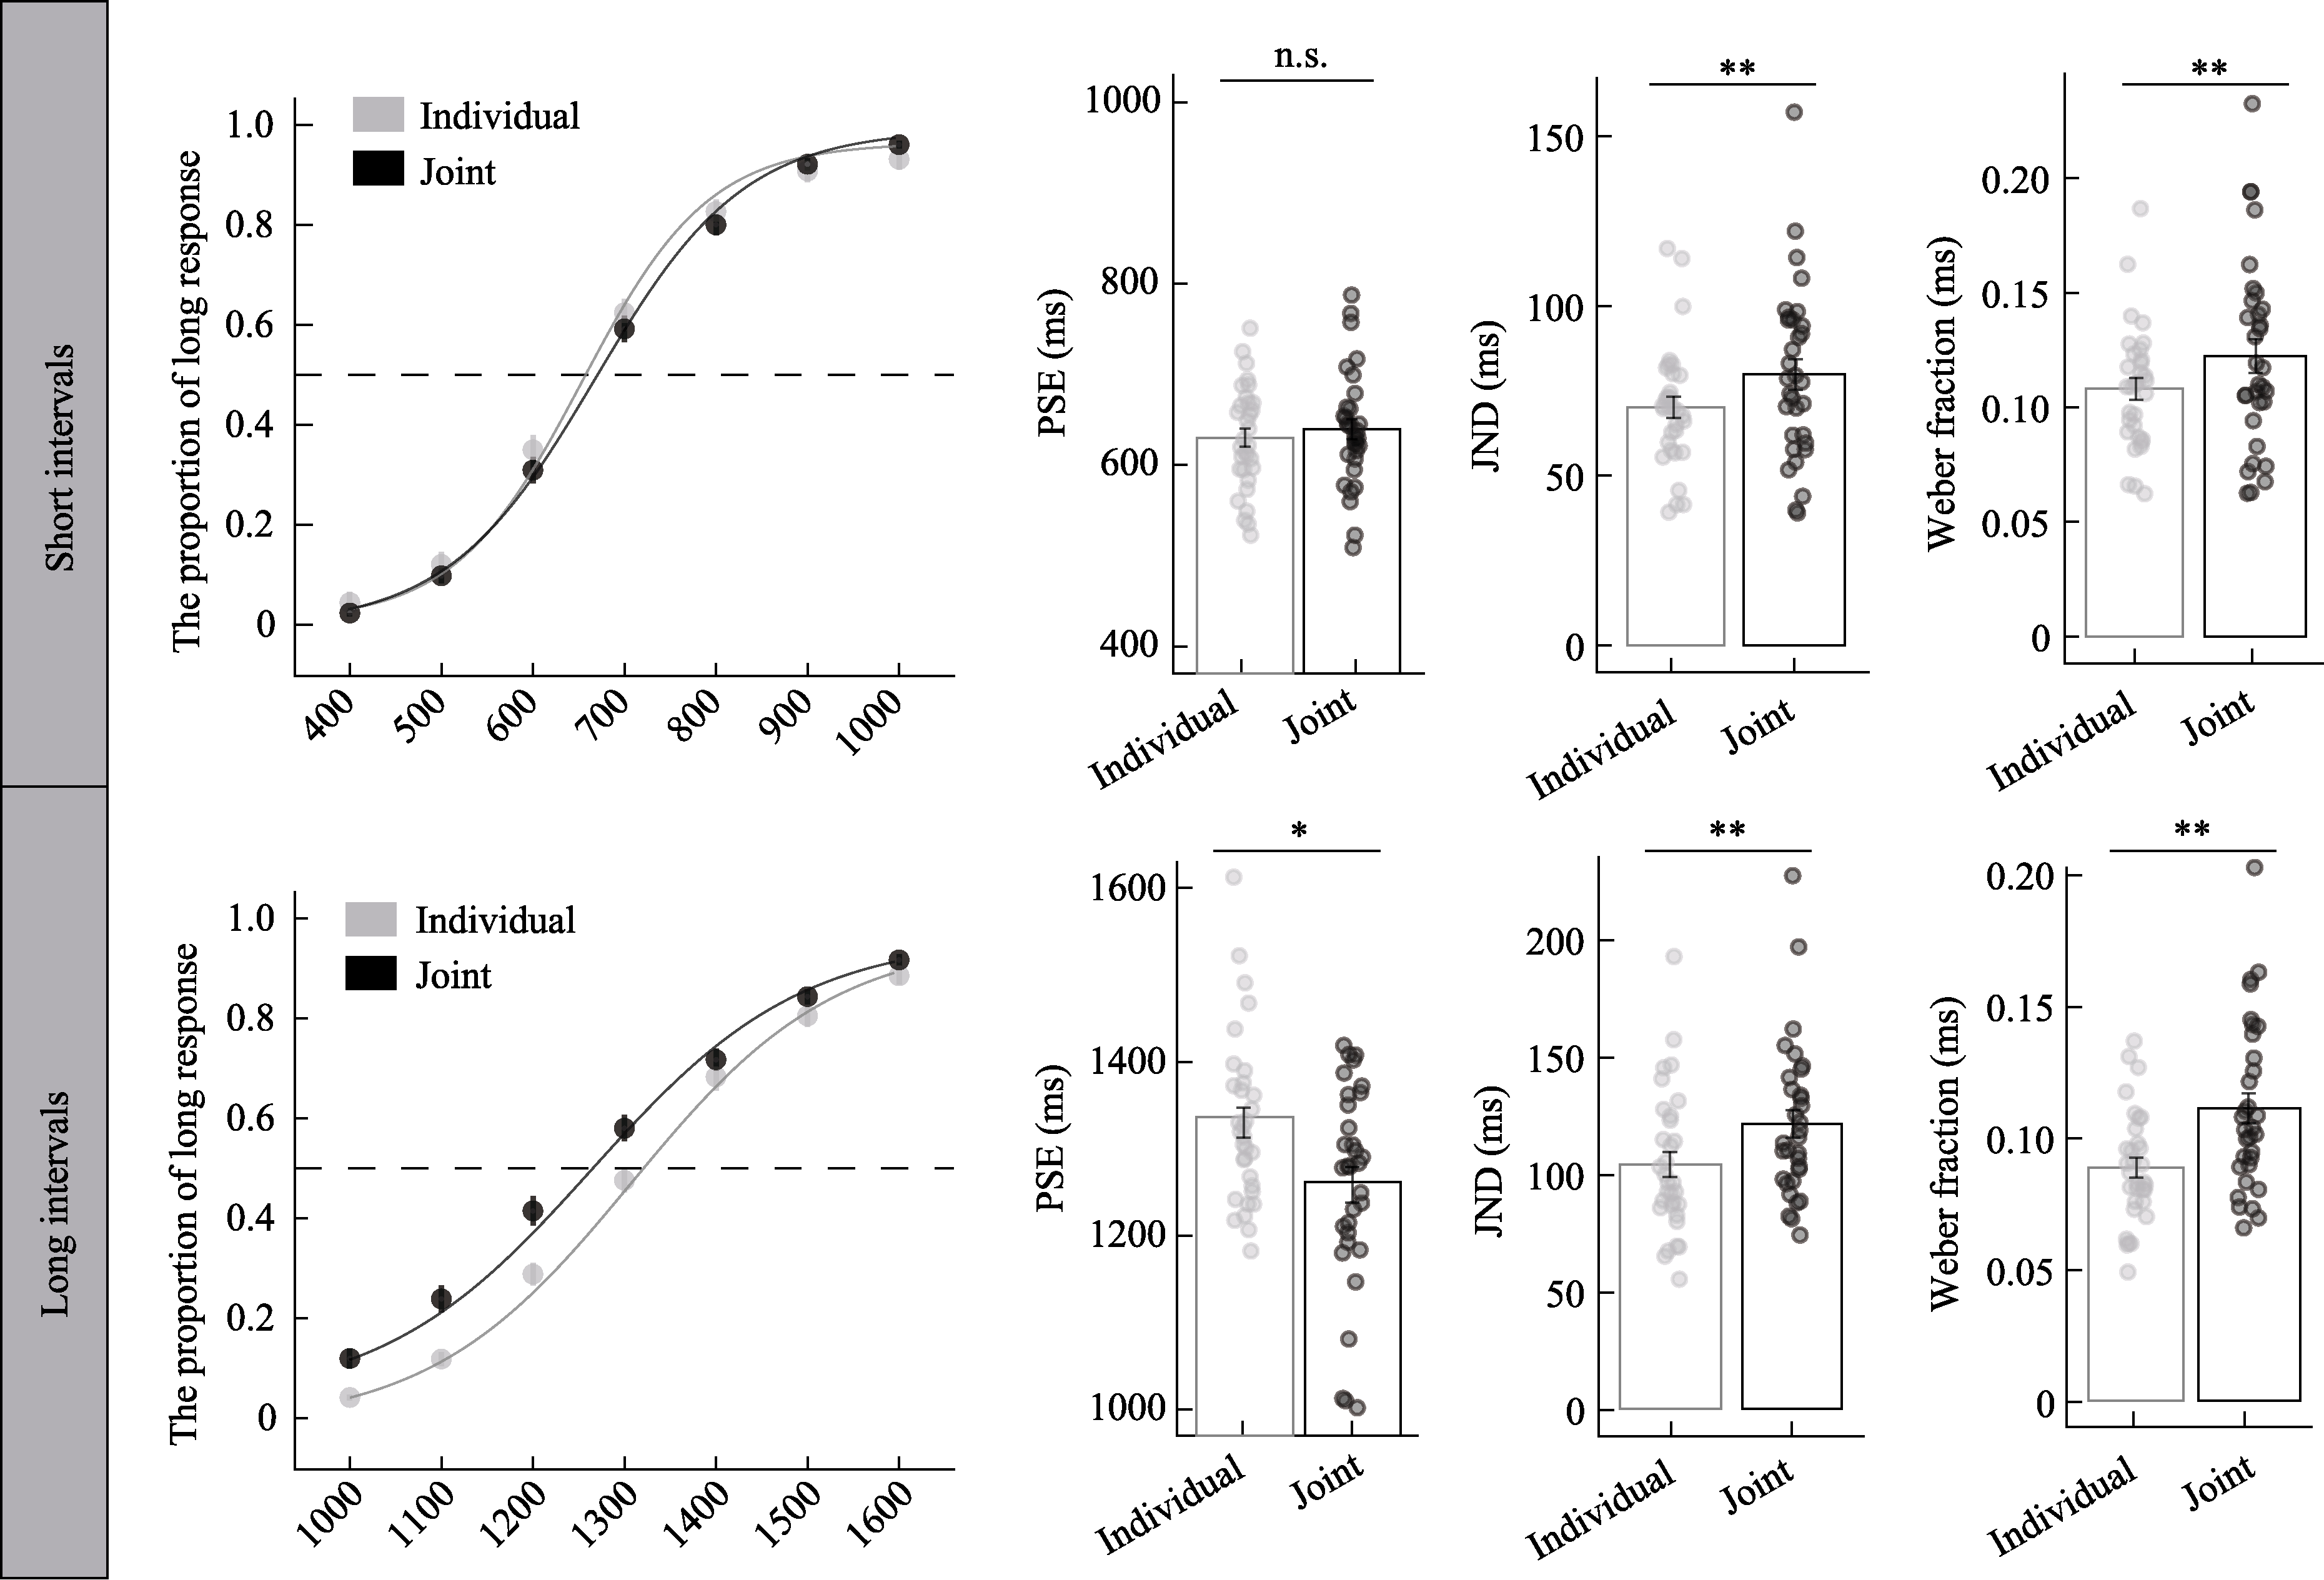
Figure 1. The results for the joint context and individual context under the long and short intervals in Experiment 1. The left panel shows the psychophysical curves, with the y-axis representing the proportion of test interval judgments identified as “long” and the x-axis representing the different test interval levels. The dashed line, which represents the 50% judgment rate, intersects with the psychophysical curve at the PSE for participants under different conditions. The right panel displays bar graphs showing the average PSE, JND, and Weber fraction results for each task context (individual context and joint context). The upper portion of the figure shows the group-level analysis, while the lower portion presents the trial-level analysis results. Error bars represent the standard error (SE). *p < 0.05, **p < 0.01, ***p < 0.001, n.s. indicates p > 0.05.
 ), ZHENG Zheng(