ISSN 0439-755X
CN 11-1911/B
CN 11-1911/B
Acta Psychologica Sinica ›› 2025, Vol. 57 ›› Issue (3): 463-478.doi: 10.3724/SP.J.1041.2025.0463
• Original article • Previous Articles Next Articles
GAO Xuede( ), MA Haoyun
Published:2025-03-25
Online:2025-01-24
Contact:
GAO Xuede
E-mail:gaoxd@lzu.edu.cn
GAO Xuede, MA Haoyun. (2025). Changing trends of Chinese people’s generalized trust: A dynamic analysis of the age-period-cohort effect. Acta Psychologica Sinica, 57(3), 463-478.
Add to citation manager EndNote|Ris|BibTeX
URL: https://journal.psych.ac.cn/acps/EN/10.3724/SP.J.1041.2025.0463
| Pre-founding (Traditional Society) | Post-founding to Early Reform and Opening-up | After Reform and Opening-up | |
|---|---|---|---|
| Trust Pattern | Relational Trust | Unit-based Trust | Institutional Trust |
| Source of Trust | Tradition and Customs | Patronage and Distribution | Contracts and Institutions |
| Pivot of Trust | Family-oriented | State-oriented | Society-Oriented |
| Trust Environment | Stable Space-Time | Certain Space-Time | Uncertain Space-Time |
| Nature of Relationships | Acquaintance Relationships | Comrade-in-arms Relationships | Stranger Relationships |
| Psychological Basis | Emotion | Recognition | Cognition |
| Risk Level | Low | Low | High |
| Population Mobility | Low | Low | High |
| Generalized trust | Low | High | Low |
Table 1 Trust Patterns and Characteristics at Different Stages of Social Development
| Pre-founding (Traditional Society) | Post-founding to Early Reform and Opening-up | After Reform and Opening-up | |
|---|---|---|---|
| Trust Pattern | Relational Trust | Unit-based Trust | Institutional Trust |
| Source of Trust | Tradition and Customs | Patronage and Distribution | Contracts and Institutions |
| Pivot of Trust | Family-oriented | State-oriented | Society-Oriented |
| Trust Environment | Stable Space-Time | Certain Space-Time | Uncertain Space-Time |
| Nature of Relationships | Acquaintance Relationships | Comrade-in-arms Relationships | Stranger Relationships |
| Psychological Basis | Emotion | Recognition | Cognition |
| Risk Level | Low | Low | High |
| Population Mobility | Low | Low | High |
| Generalized trust | Low | High | Low |
| Variable | Code | Frequency/Percentage | Variable | Code | Frequency/Percentage | ||
|---|---|---|---|---|---|---|---|
| Year | 2003 | 5866 | (6.15%) | Average Years of Education in Cohort | Mean (SD) | 9.7718 | (1.5997) |
| 2005 | 10262 | (10.76%) | Birth Cohort Size | Mean (SD) | 10.1712 | (2.5055) | |
| 2010 | 11759 | (12.33%) | Kinship in Cohort | Mean (SD) | 2.4157 | (0.0905) | |
| 2012 | 11758 | (12.33%) | Gender | Male | 45752 | (48.00%) | |
| 2013 | 11423 | (11.98%) | Female | 49596 | (52.00%) | ||
| 2015 | 10927 | (11.46%) | Ethnicity | Han | 87985 | (92.30%) | |
| 2017 | 12533 | (13.14%) | Minority | 7363 | (7.70%) | ||
| 2018 | 12741 | (13.36%) | Political Affiliation | Party Member | 11095 | (11.60%) | |
| 2021 | 8079 | (8.47%) | Non-Party Member | 84253 | (88.40%) | ||
| Age | Mean (SD) | 48.92 | (16.440) | Marital Status | Married | 74682 | (78.30%) |
| Marketization Index | Mean (SD) | 7.3697 | (0.7987) | Unmarried and Others | 20666 | (21.70%) | |
| Population Mobility Rate | Mean (SD) | 19.00% | (4.9867) | Household Registration | Urban | 47144 | (49.40%) |
| Number of Social Organizations | Mean (SD) | 5.7480 | (0.1564) | Rural | 48204 | (50.60%) | |
| Government Trust Index | Mean (SD) | 77.31 | (7.5404) | Education Level | Higher Education | 16170 | (17.00%) |
| Gini Coefficient | Mean (SD) | 0.4724 | (0.0070) | Non-Higher Education | 79113 | (83.00%) | |
| Average Education Level of Period | Mean (SD) | 9.8508 | (0.6382) | Kinship Relationship | High Kinship | 34514 | (36.20%) |
| Kinship Relationship of Period | Mean (SD) | 2.4169 | (0.5303) | Low Kinship | 60803 | (63.80%) | |
Table 2 Descriptive Statistics of Basic Variables
| Variable | Code | Frequency/Percentage | Variable | Code | Frequency/Percentage | ||
|---|---|---|---|---|---|---|---|
| Year | 2003 | 5866 | (6.15%) | Average Years of Education in Cohort | Mean (SD) | 9.7718 | (1.5997) |
| 2005 | 10262 | (10.76%) | Birth Cohort Size | Mean (SD) | 10.1712 | (2.5055) | |
| 2010 | 11759 | (12.33%) | Kinship in Cohort | Mean (SD) | 2.4157 | (0.0905) | |
| 2012 | 11758 | (12.33%) | Gender | Male | 45752 | (48.00%) | |
| 2013 | 11423 | (11.98%) | Female | 49596 | (52.00%) | ||
| 2015 | 10927 | (11.46%) | Ethnicity | Han | 87985 | (92.30%) | |
| 2017 | 12533 | (13.14%) | Minority | 7363 | (7.70%) | ||
| 2018 | 12741 | (13.36%) | Political Affiliation | Party Member | 11095 | (11.60%) | |
| 2021 | 8079 | (8.47%) | Non-Party Member | 84253 | (88.40%) | ||
| Age | Mean (SD) | 48.92 | (16.440) | Marital Status | Married | 74682 | (78.30%) |
| Marketization Index | Mean (SD) | 7.3697 | (0.7987) | Unmarried and Others | 20666 | (21.70%) | |
| Population Mobility Rate | Mean (SD) | 19.00% | (4.9867) | Household Registration | Urban | 47144 | (49.40%) |
| Number of Social Organizations | Mean (SD) | 5.7480 | (0.1564) | Rural | 48204 | (50.60%) | |
| Government Trust Index | Mean (SD) | 77.31 | (7.5404) | Education Level | Higher Education | 16170 | (17.00%) |
| Gini Coefficient | Mean (SD) | 0.4724 | (0.0070) | Non-Higher Education | 79113 | (83.00%) | |
| Average Education Level of Period | Mean (SD) | 9.8508 | (0.6382) | Kinship Relationship | High Kinship | 34514 | (36.20%) |
| Kinship Relationship of Period | Mean (SD) | 2.4169 | (0.5303) | Low Kinship | 60803 | (63.80%) | |
| Explanatory Variables | Basic Model | Model 1 | Model 2 | Model 3 | Model 4 | |
|---|---|---|---|---|---|---|
| Intercept | 3.0442*** | ?15.9680 | 3.0102*** | 2.9983*** | 3.0816*** | |
| Age | 0.0041*** | 0.0000 | 0.0022*** | 0.0056*** | 0.0063*** | |
| Age Squared | 0.0002*** | 0.0002*** | 0.0002*** | 0.0002*** | 0.0001* | |
| Gender | 0.0236*** | 0.0237*** | 0.0193** | 0.0245*** | 0.0240*** | |
| Political Affiliation | 0.1209*** | 0.1209*** | 0.1516*** | 0.0979*** | 0.1212*** | |
| Ethnicity | ?0.0400** | ?0.0397** | ?0.0287* | ?0.0455*** | ?0.0402*** | |
| Marital Status | 0.0390*** | 0.0394*** | 0.0463*** | 0.0561*** | 0.0379*** | |
| Period Covariates | ||||||
| Period Kinship | ?1.3748*** | |||||
| Marketization Index | ?0.4419* | |||||
| Number of Social Organizations | 6.8659+ | |||||
| Population Mobility Rate | 0.0173 | |||||
| Period Average Education Level | ?1.4894 | |||||
| Gini Coefficient | 2.6006 | |||||
| Government Trust Index | 0.0054 | |||||
| Generation Variance | ||||||
| Cohort Average Education Level | ?0.0722*** | |||||
| Cohort Kinship | ?0.2223** | |||||
| Birth Cohort Size | 0.0155** | |||||
| Household Registration Type | 0.0918** | |||||
| Education Level | 0.0489 | |||||
| Kinship | ?0.0588 | |||||
| Age Interaction Term | ||||||
| Age × Household Registration | 0.0048*** | |||||
| Age Squared × Household Registration | ?0.0001** | |||||
| Age × Education Level | ?0.0051*** | |||||
| Age Squared × Education Level | 0.0000 | |||||
| Age × Kinship | ?0.0034** | |||||
| Age Squared × Kinship | 0.0003*** | |||||
| Period Variance | ||||||
| Period Intercept | 0.4214* | 0.0039 | 0.4176* | 0.0042* | 0.4992* | |
| Period Household Registration Type | 0.0033* | |||||
| Period Education Level | 0.0047* | |||||
| Period Kinship | 0.0072* | |||||
| Generation Variance | ||||||
| Generation Intercept | 0.0070* | 0.0016* | 0.0027+ | 0.0118* | 0.0023* | |
| Generation Household Registration Type | 0.0021* | |||||
| Generation Education Level | 0.0017 | |||||
| Generation Kinship | 0.0117* | |||||
| BIC | 267929.3 | 267893.3 | 267564.3 | 267709.5 | 267809.7 | |
Table 3 Results of the Age-Period-Cohort Multilevel Random Effects Model Analysis
| Explanatory Variables | Basic Model | Model 1 | Model 2 | Model 3 | Model 4 | |
|---|---|---|---|---|---|---|
| Intercept | 3.0442*** | ?15.9680 | 3.0102*** | 2.9983*** | 3.0816*** | |
| Age | 0.0041*** | 0.0000 | 0.0022*** | 0.0056*** | 0.0063*** | |
| Age Squared | 0.0002*** | 0.0002*** | 0.0002*** | 0.0002*** | 0.0001* | |
| Gender | 0.0236*** | 0.0237*** | 0.0193** | 0.0245*** | 0.0240*** | |
| Political Affiliation | 0.1209*** | 0.1209*** | 0.1516*** | 0.0979*** | 0.1212*** | |
| Ethnicity | ?0.0400** | ?0.0397** | ?0.0287* | ?0.0455*** | ?0.0402*** | |
| Marital Status | 0.0390*** | 0.0394*** | 0.0463*** | 0.0561*** | 0.0379*** | |
| Period Covariates | ||||||
| Period Kinship | ?1.3748*** | |||||
| Marketization Index | ?0.4419* | |||||
| Number of Social Organizations | 6.8659+ | |||||
| Population Mobility Rate | 0.0173 | |||||
| Period Average Education Level | ?1.4894 | |||||
| Gini Coefficient | 2.6006 | |||||
| Government Trust Index | 0.0054 | |||||
| Generation Variance | ||||||
| Cohort Average Education Level | ?0.0722*** | |||||
| Cohort Kinship | ?0.2223** | |||||
| Birth Cohort Size | 0.0155** | |||||
| Household Registration Type | 0.0918** | |||||
| Education Level | 0.0489 | |||||
| Kinship | ?0.0588 | |||||
| Age Interaction Term | ||||||
| Age × Household Registration | 0.0048*** | |||||
| Age Squared × Household Registration | ?0.0001** | |||||
| Age × Education Level | ?0.0051*** | |||||
| Age Squared × Education Level | 0.0000 | |||||
| Age × Kinship | ?0.0034** | |||||
| Age Squared × Kinship | 0.0003*** | |||||
| Period Variance | ||||||
| Period Intercept | 0.4214* | 0.0039 | 0.4176* | 0.0042* | 0.4992* | |
| Period Household Registration Type | 0.0033* | |||||
| Period Education Level | 0.0047* | |||||
| Period Kinship | 0.0072* | |||||
| Generation Variance | ||||||
| Generation Intercept | 0.0070* | 0.0016* | 0.0027+ | 0.0118* | 0.0023* | |
| Generation Household Registration Type | 0.0021* | |||||
| Generation Education Level | 0.0017 | |||||
| Generation Kinship | 0.0117* | |||||
| BIC | 267929.3 | 267893.3 | 267564.3 | 267709.5 | 267809.7 | |
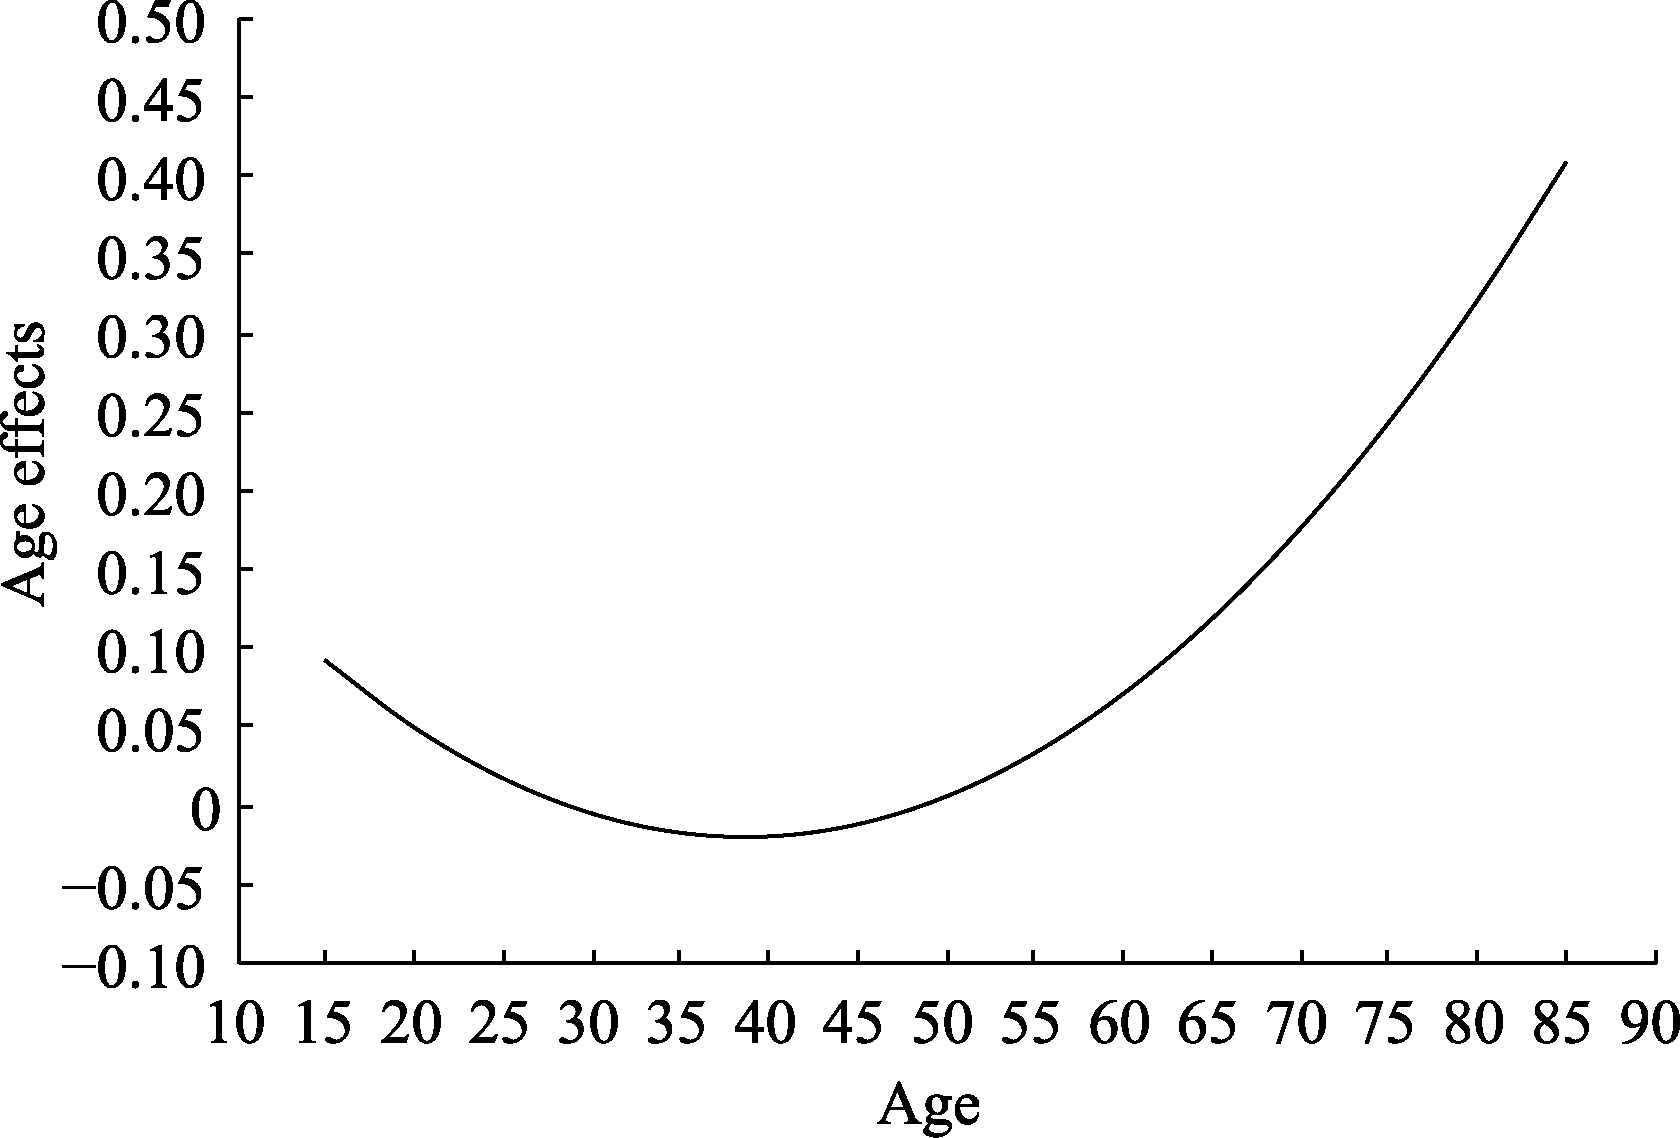
Figure 1. Main Effect of Age.
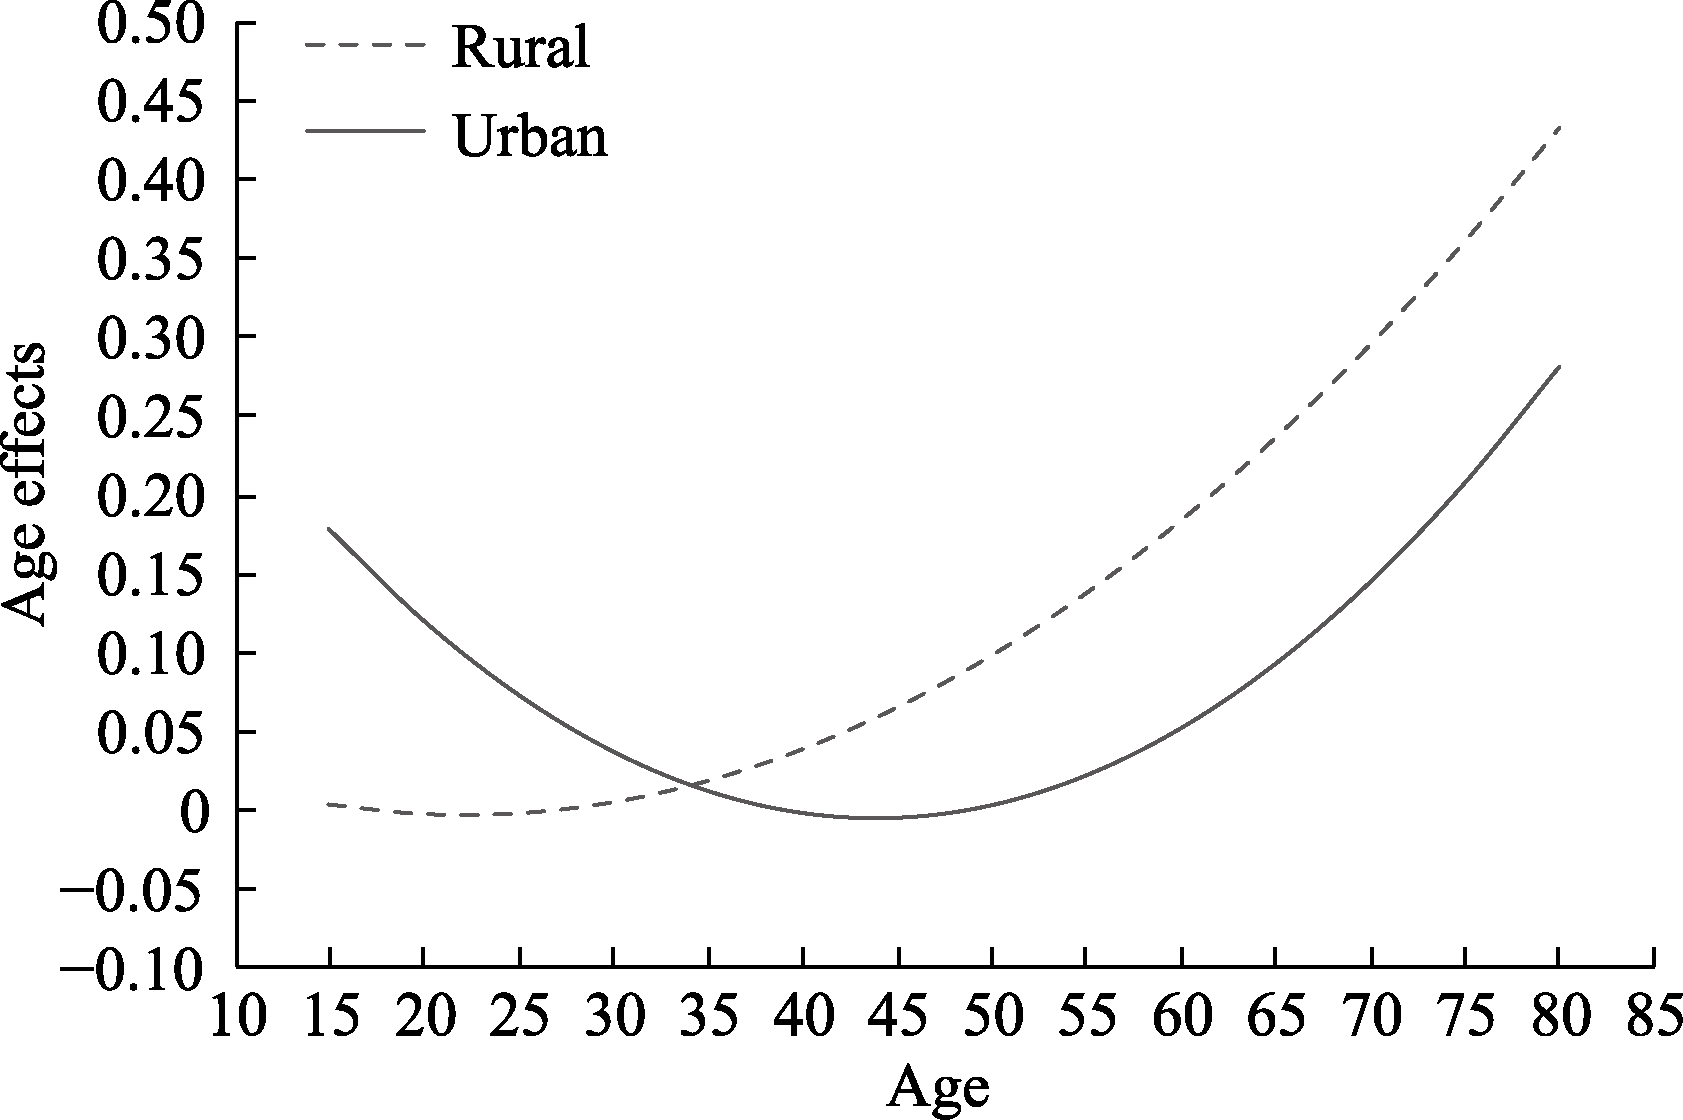
Figure 2. Hukou Differences in Age Effects.
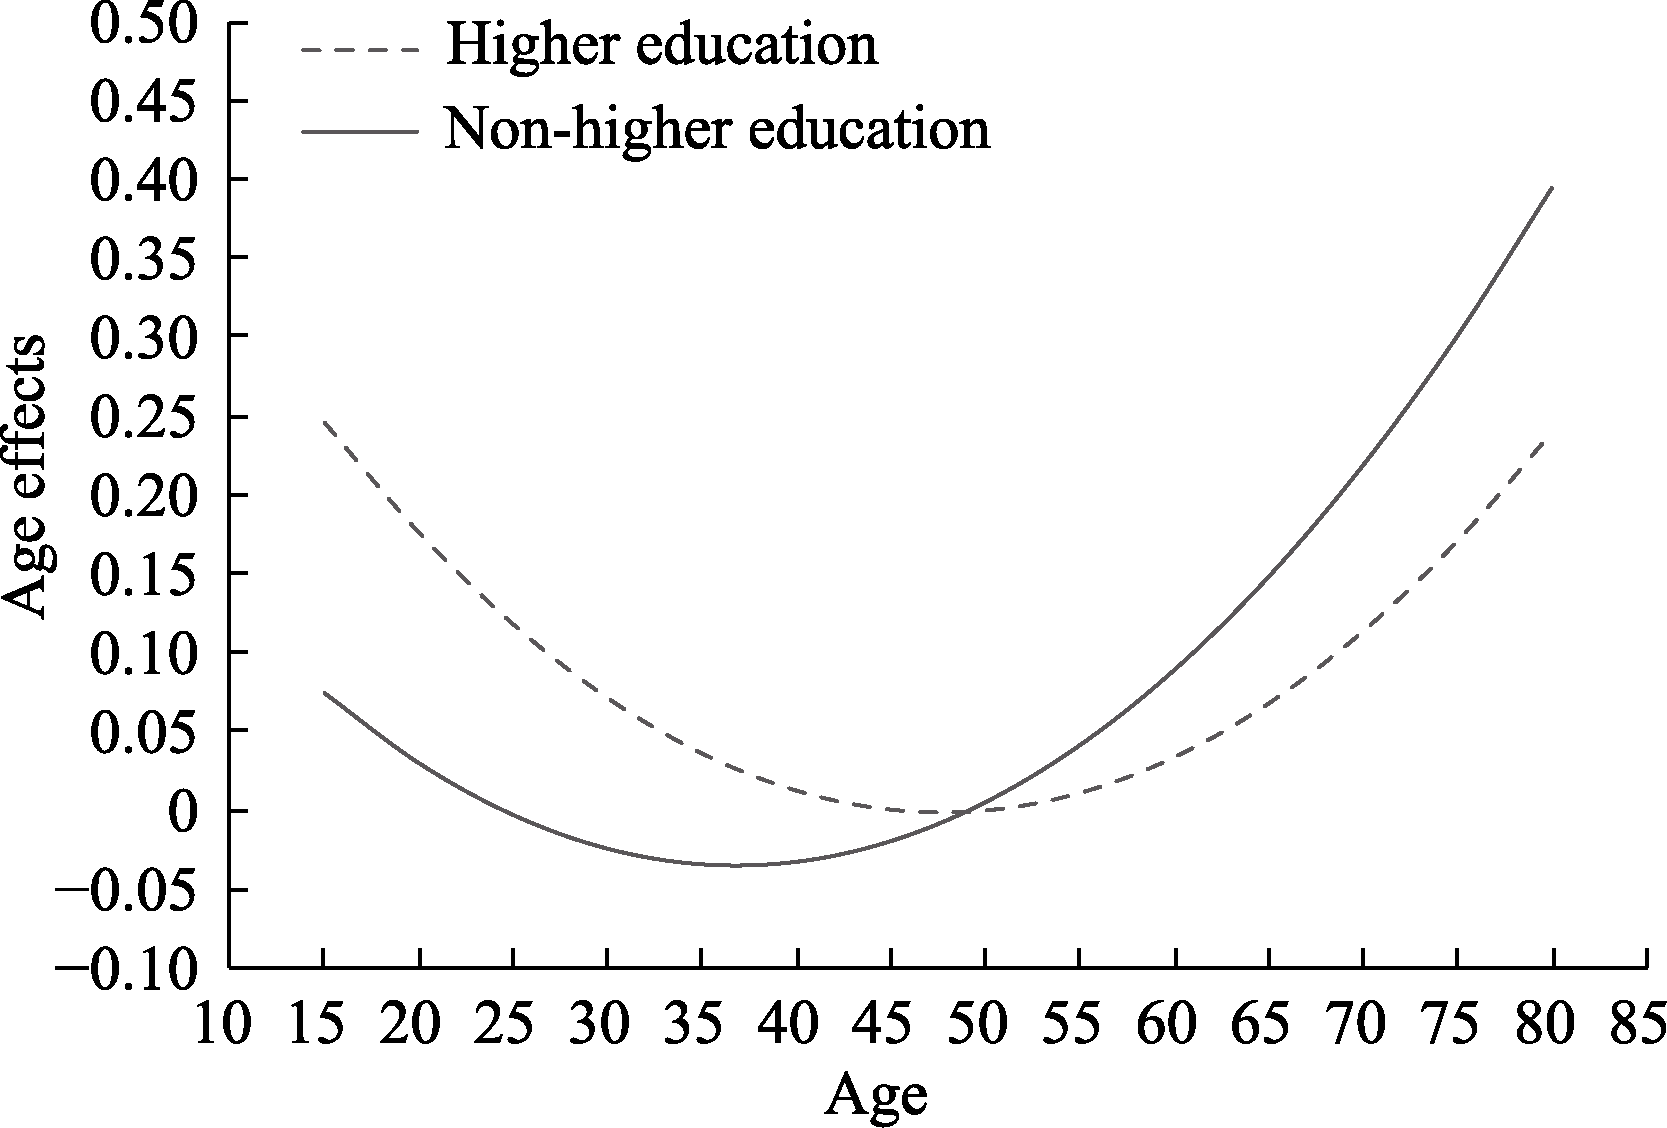
Figure 3. Educational Level Differences in Age Effects.
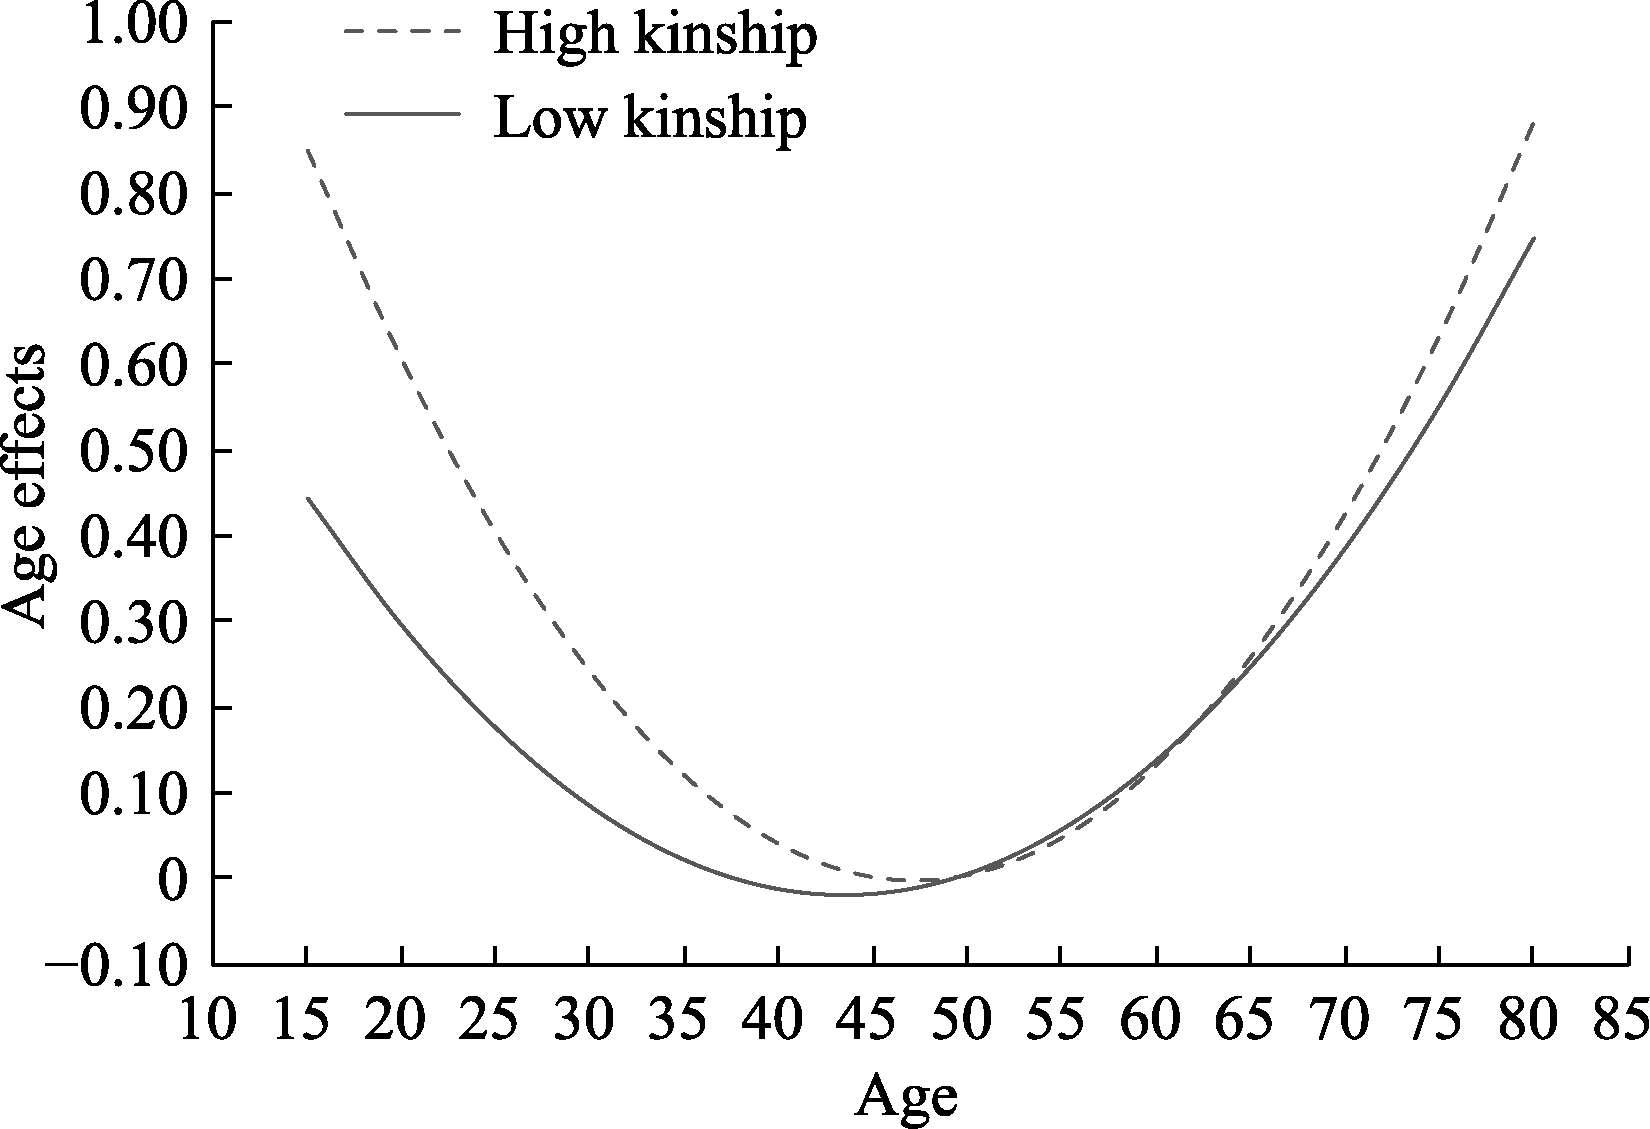
Figure 4. Kinship Differences in Age Effects. Note. In Figure 1, the vertical axis “age effect” represents the fixed effect regression coefficient (the sum of β1 and β2) of different ages on the level of generalized trust. Figures 2 to 4 further incorporate control variables such as household registration (hukou), educational level, and kinship, examining their fixed effects (γ9) on the level of generalized trust, as well as the regression coefficients (the sum of β7 and β8) of their interaction terms with age.
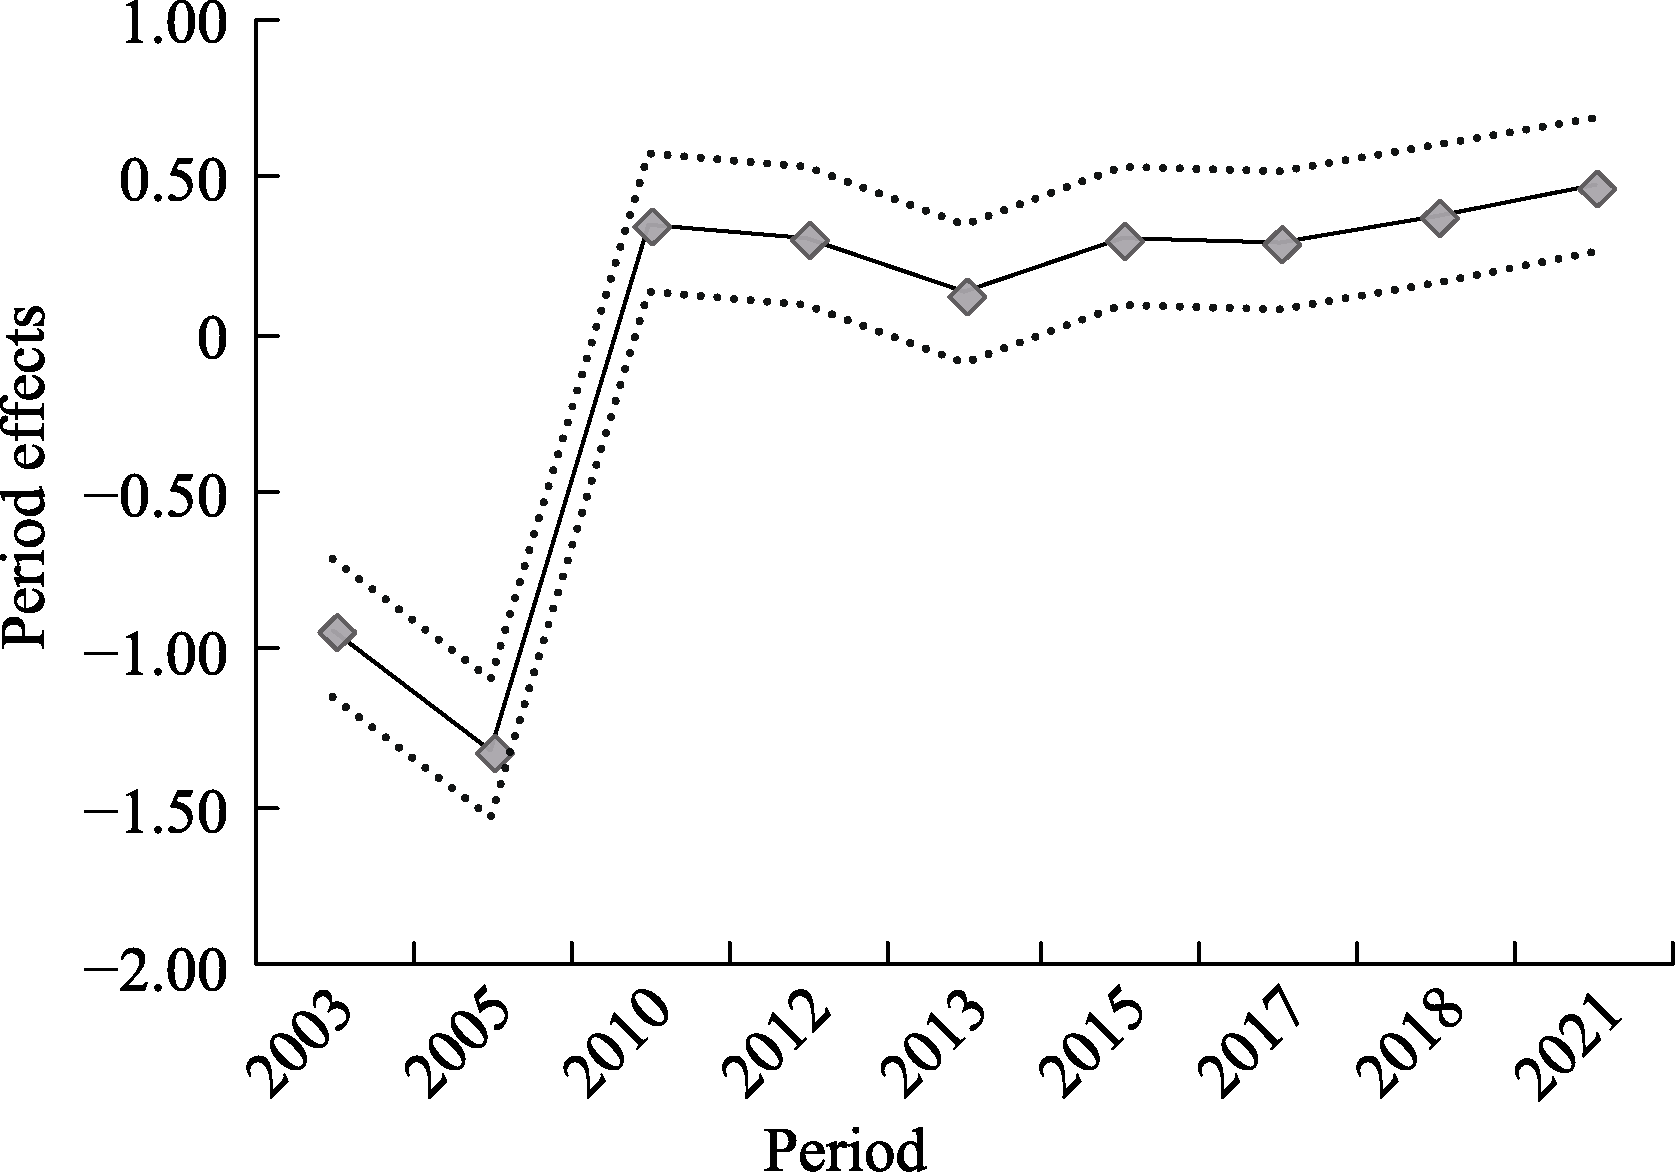
Figure 5. Main Effect of Period.
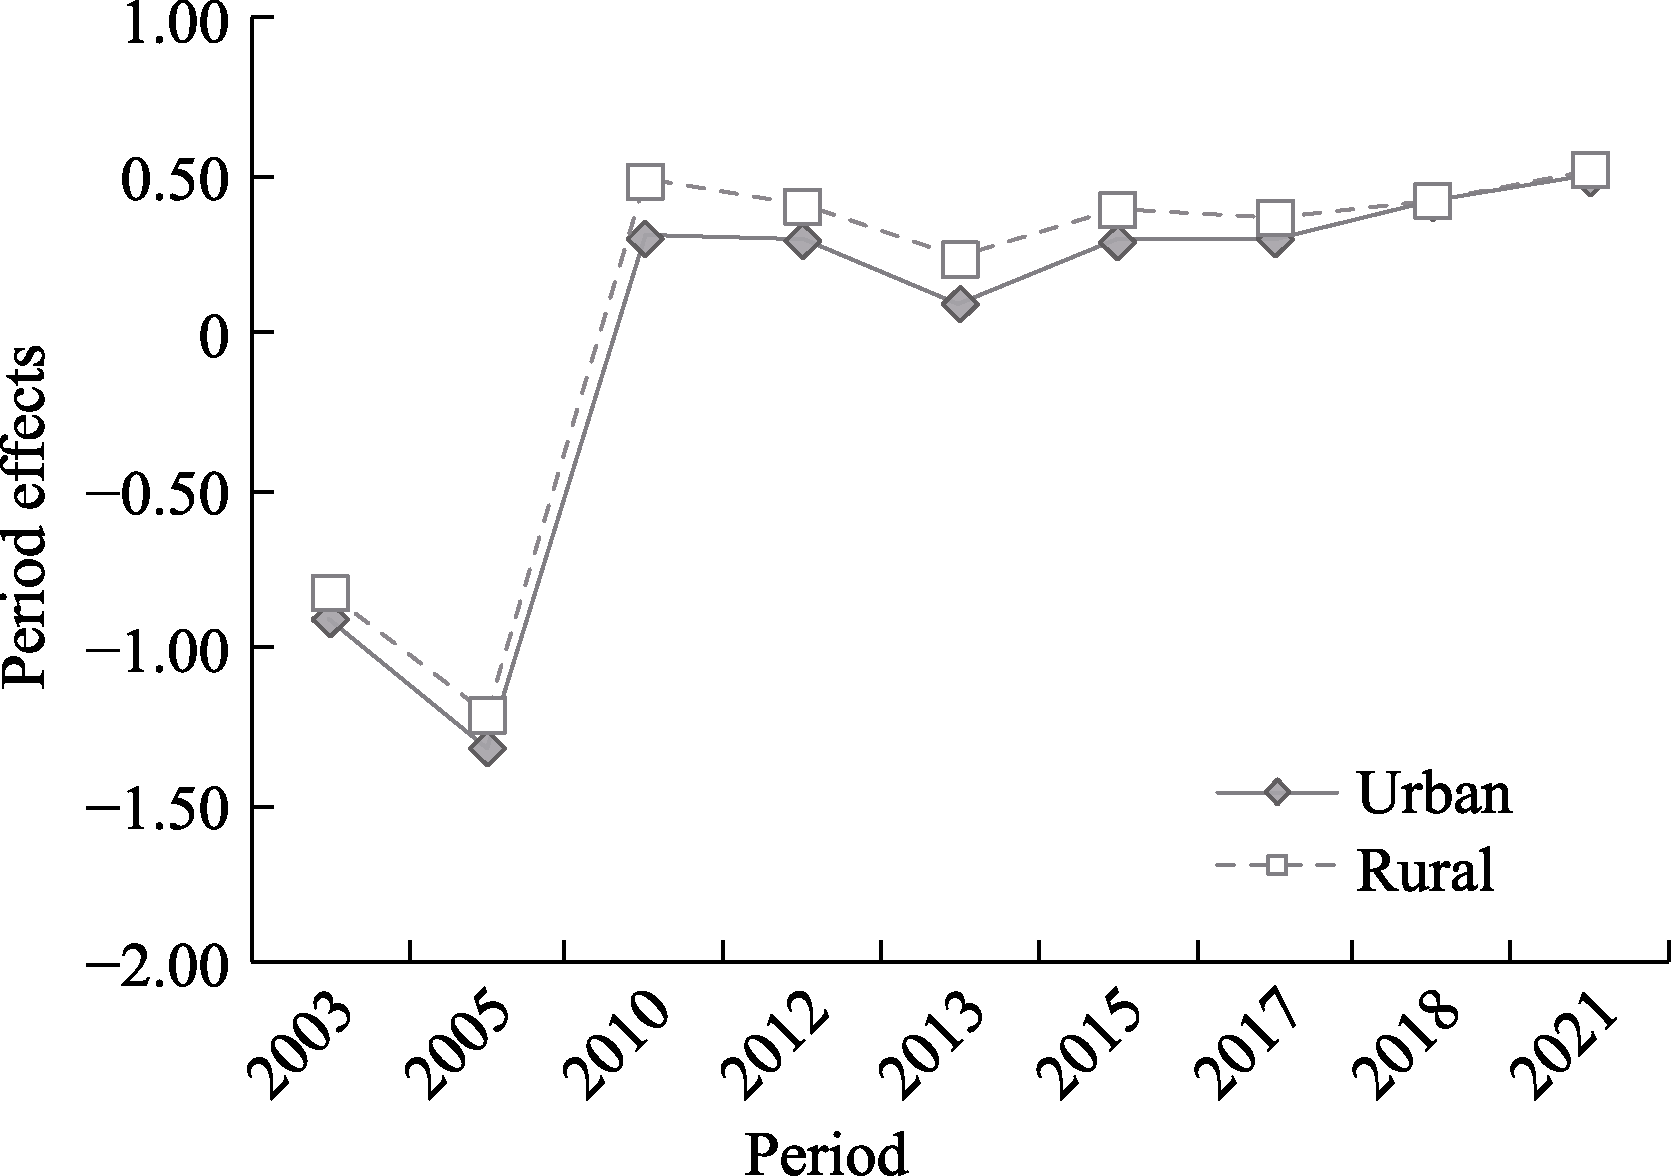
Figure 6. Hukou Differences in Period Effects.
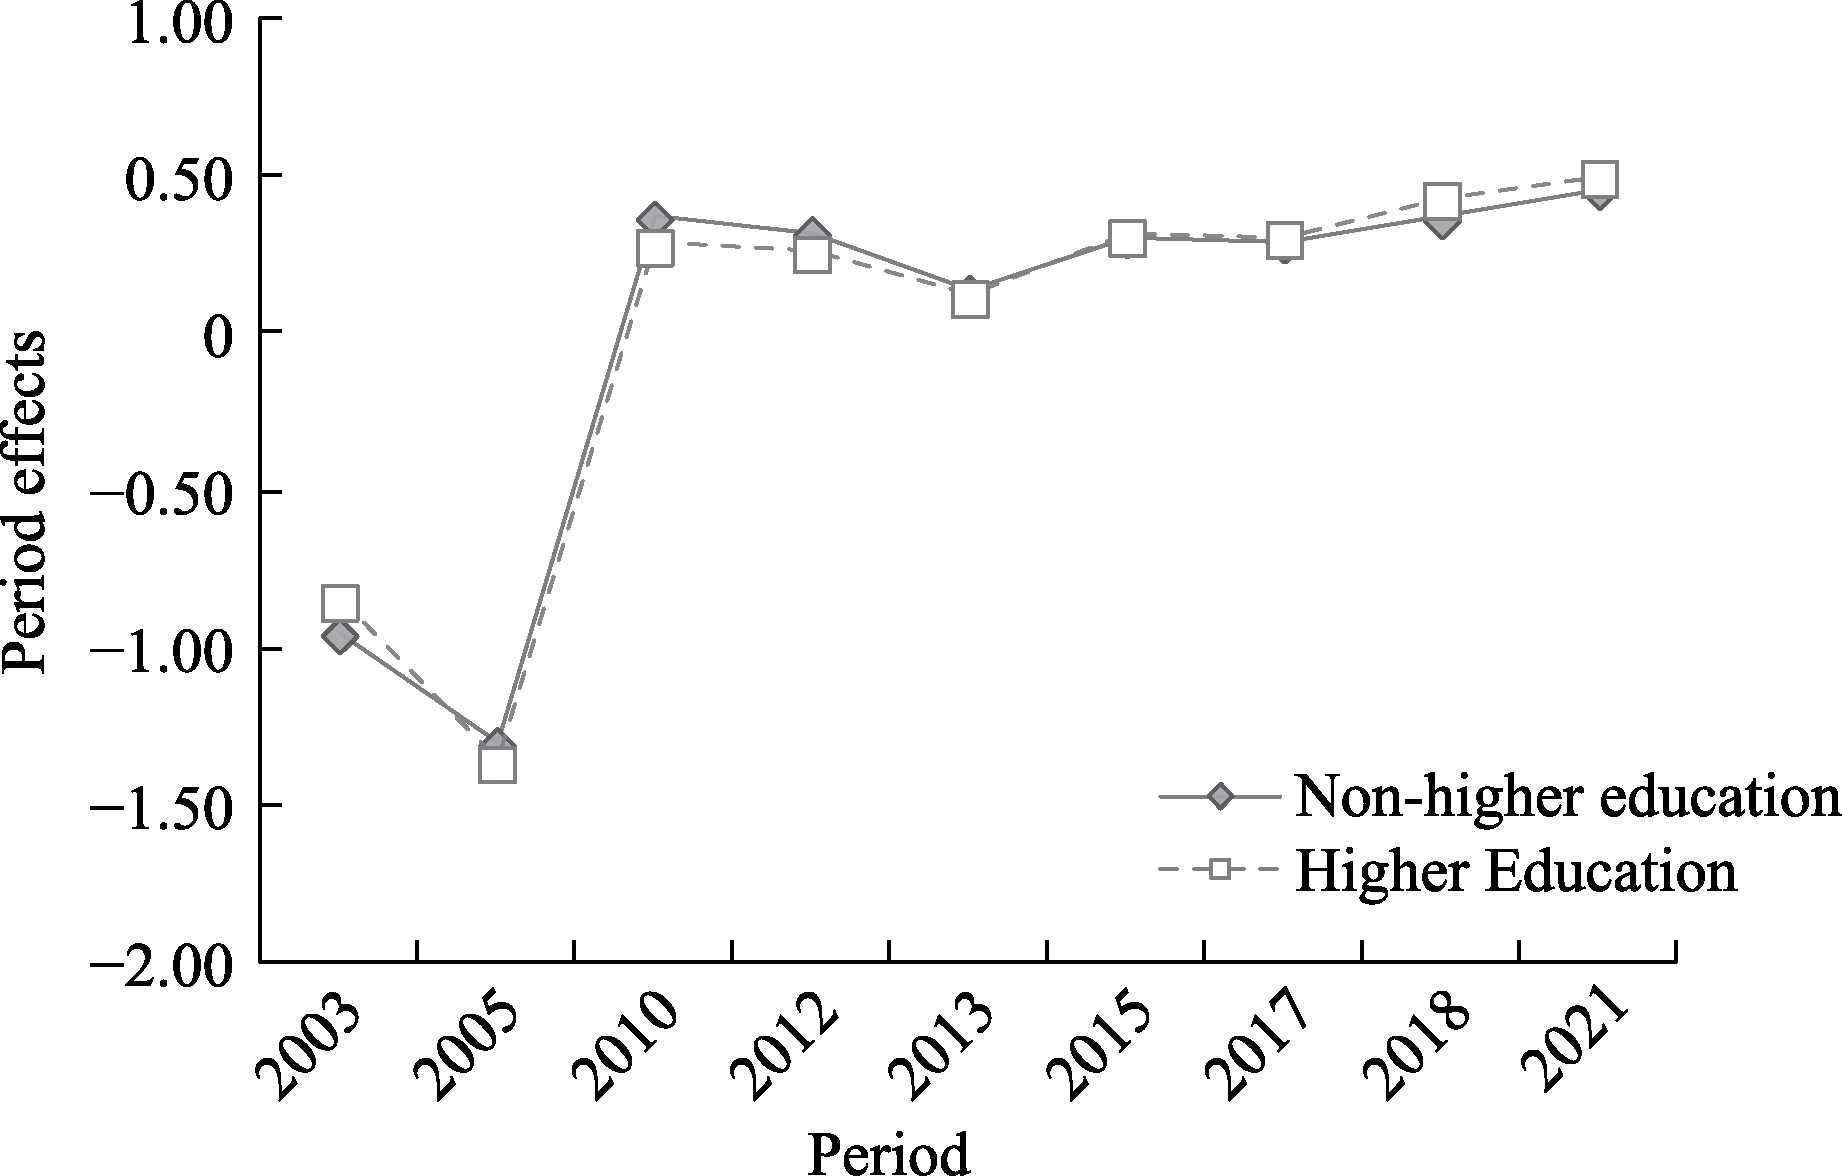
Figure 7. Educational Level Differences in Period Effects.
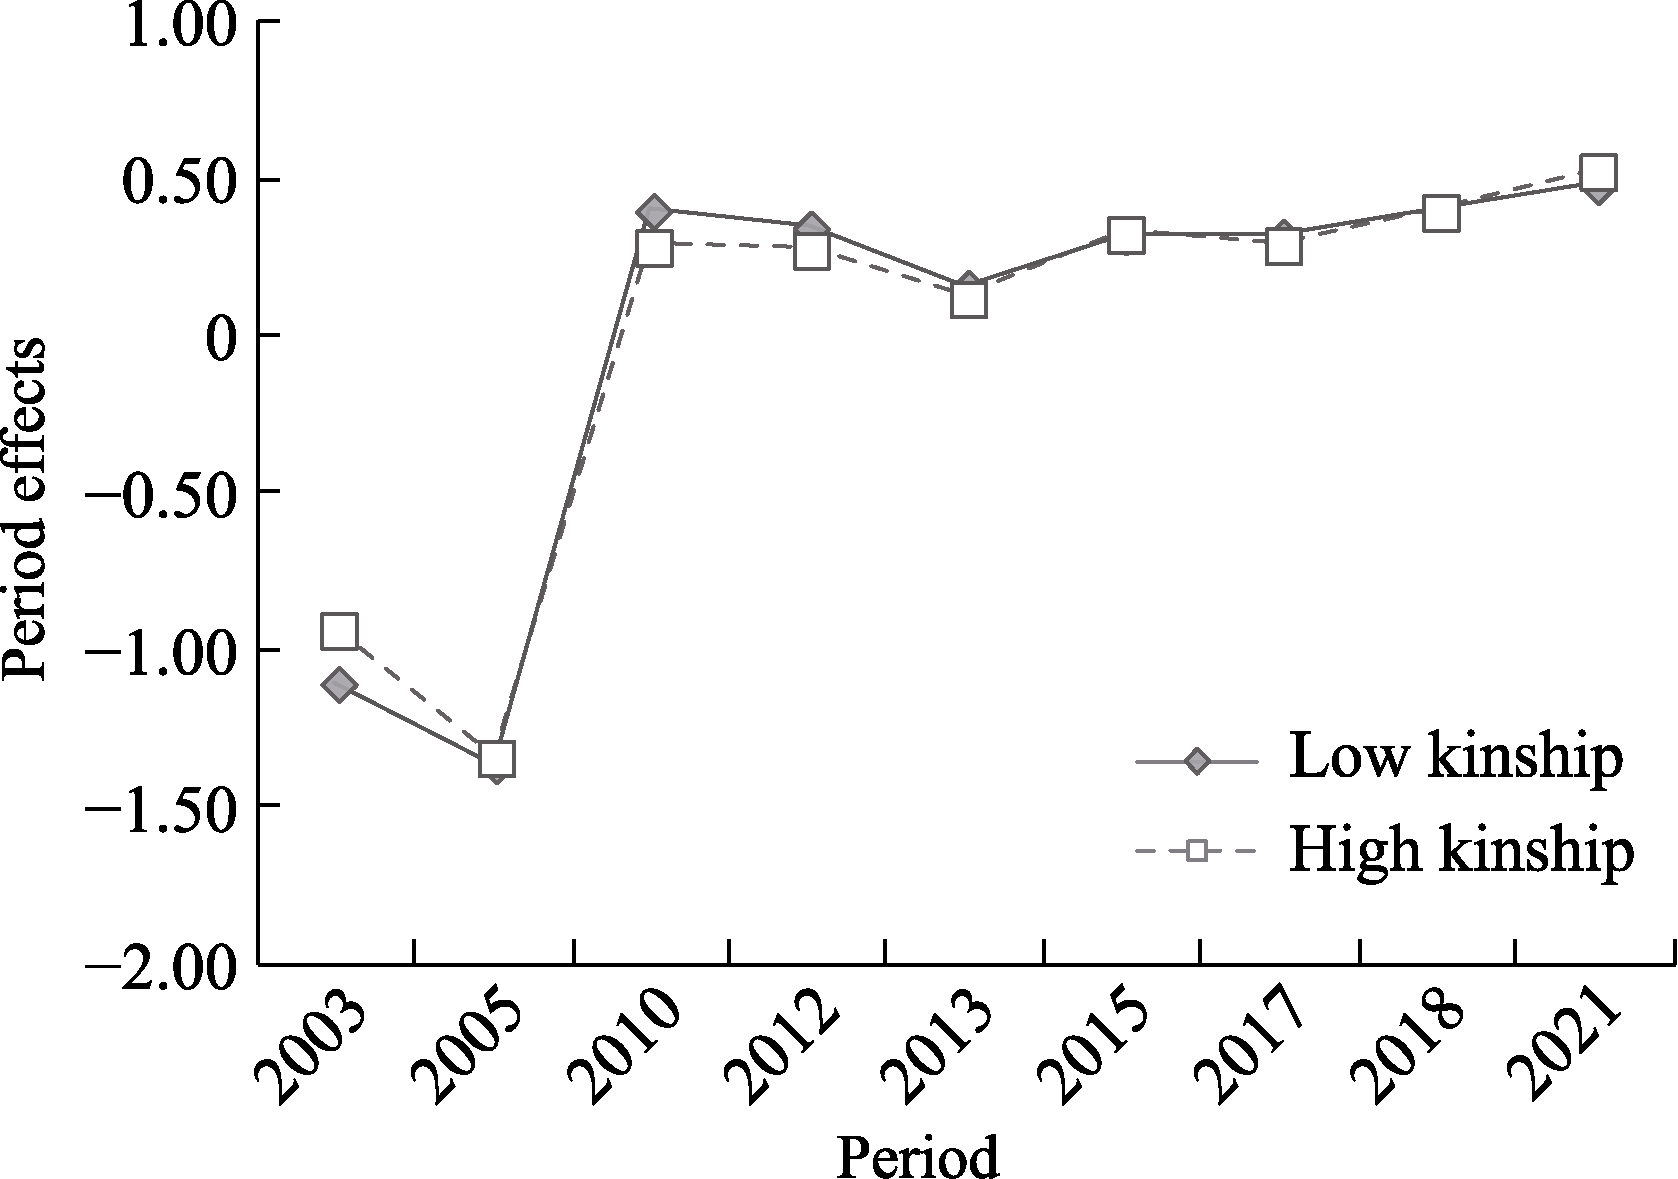
Figure 8. Kinship Differences in Period Effects. Note. In Figure 5, the vertical axis “period effect” represents the random effect coefficient (u0j) of different survey years on the level of generalized trust. Figures 6 to 8 further incorporate group variables such as household registration (hukou), educational level, and kinship, examining their fixed effects (γ9) on the level of generalized trust, as well as their period random effect coefficients (u9j) on the level of generalized trust.
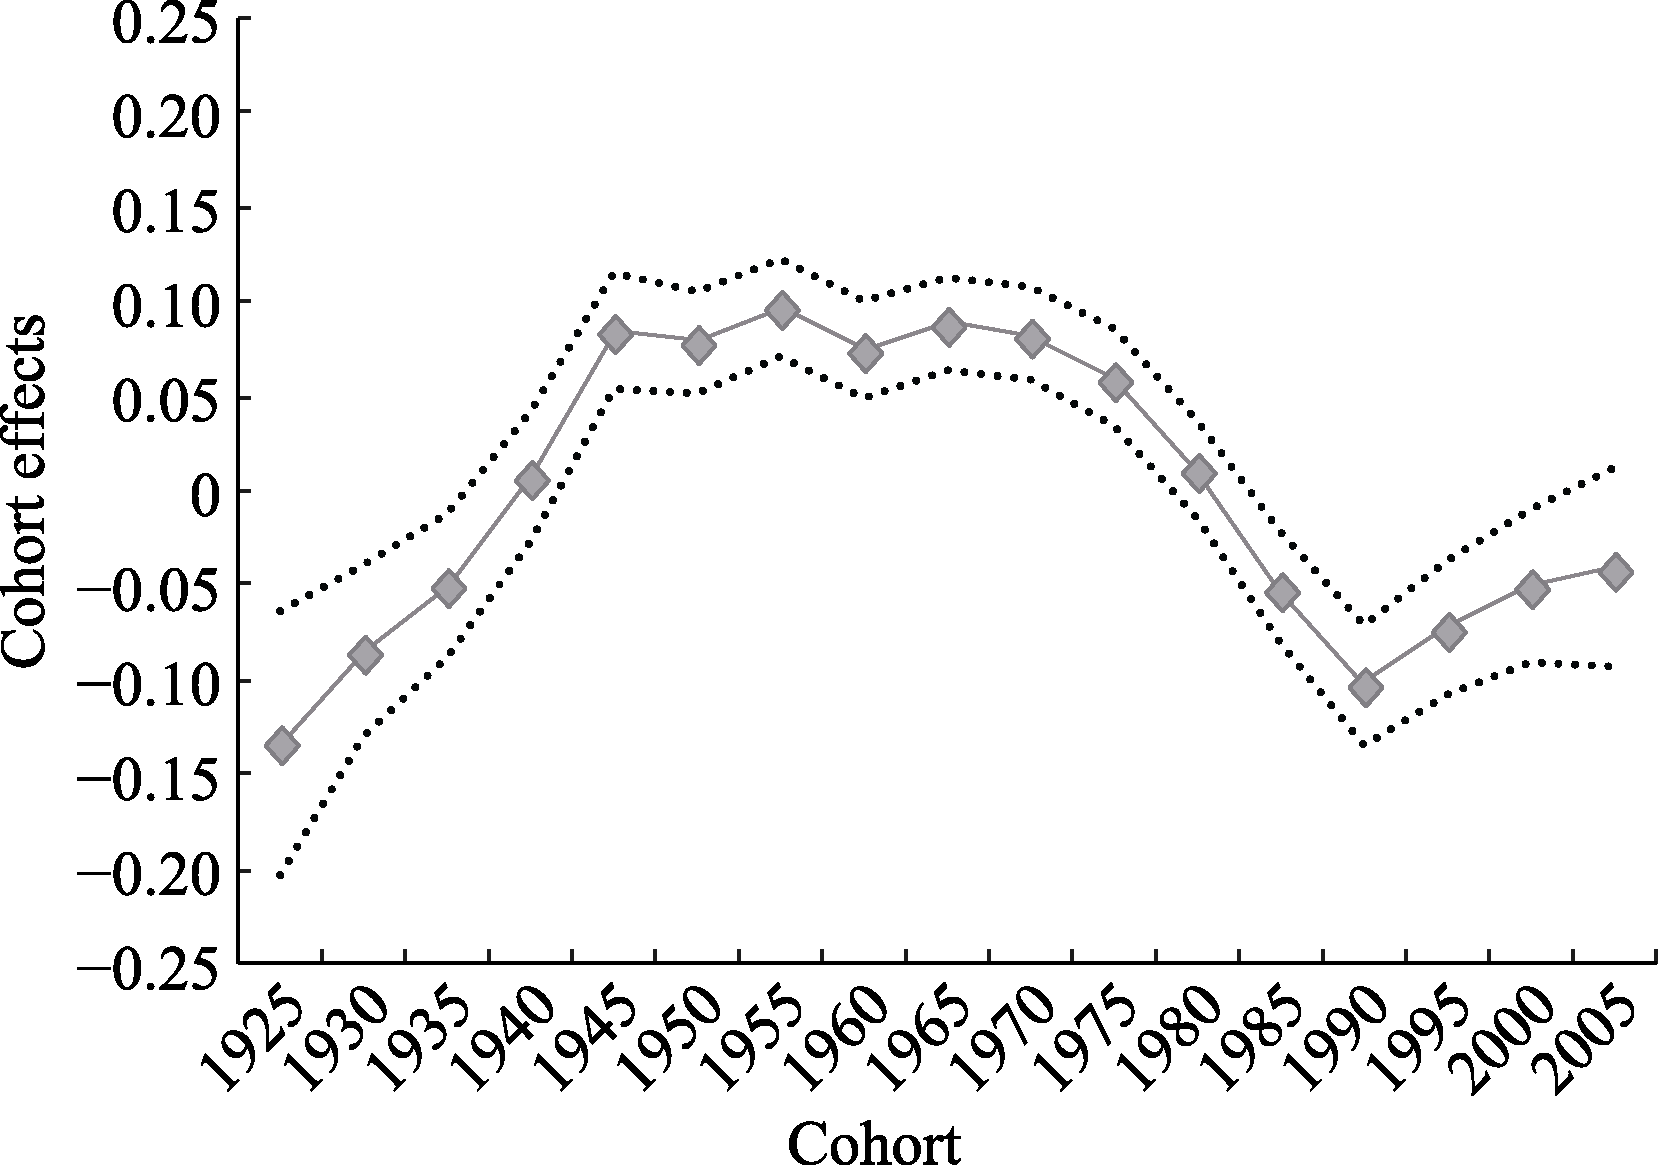
Figure 9. Main Effect of Cohort.
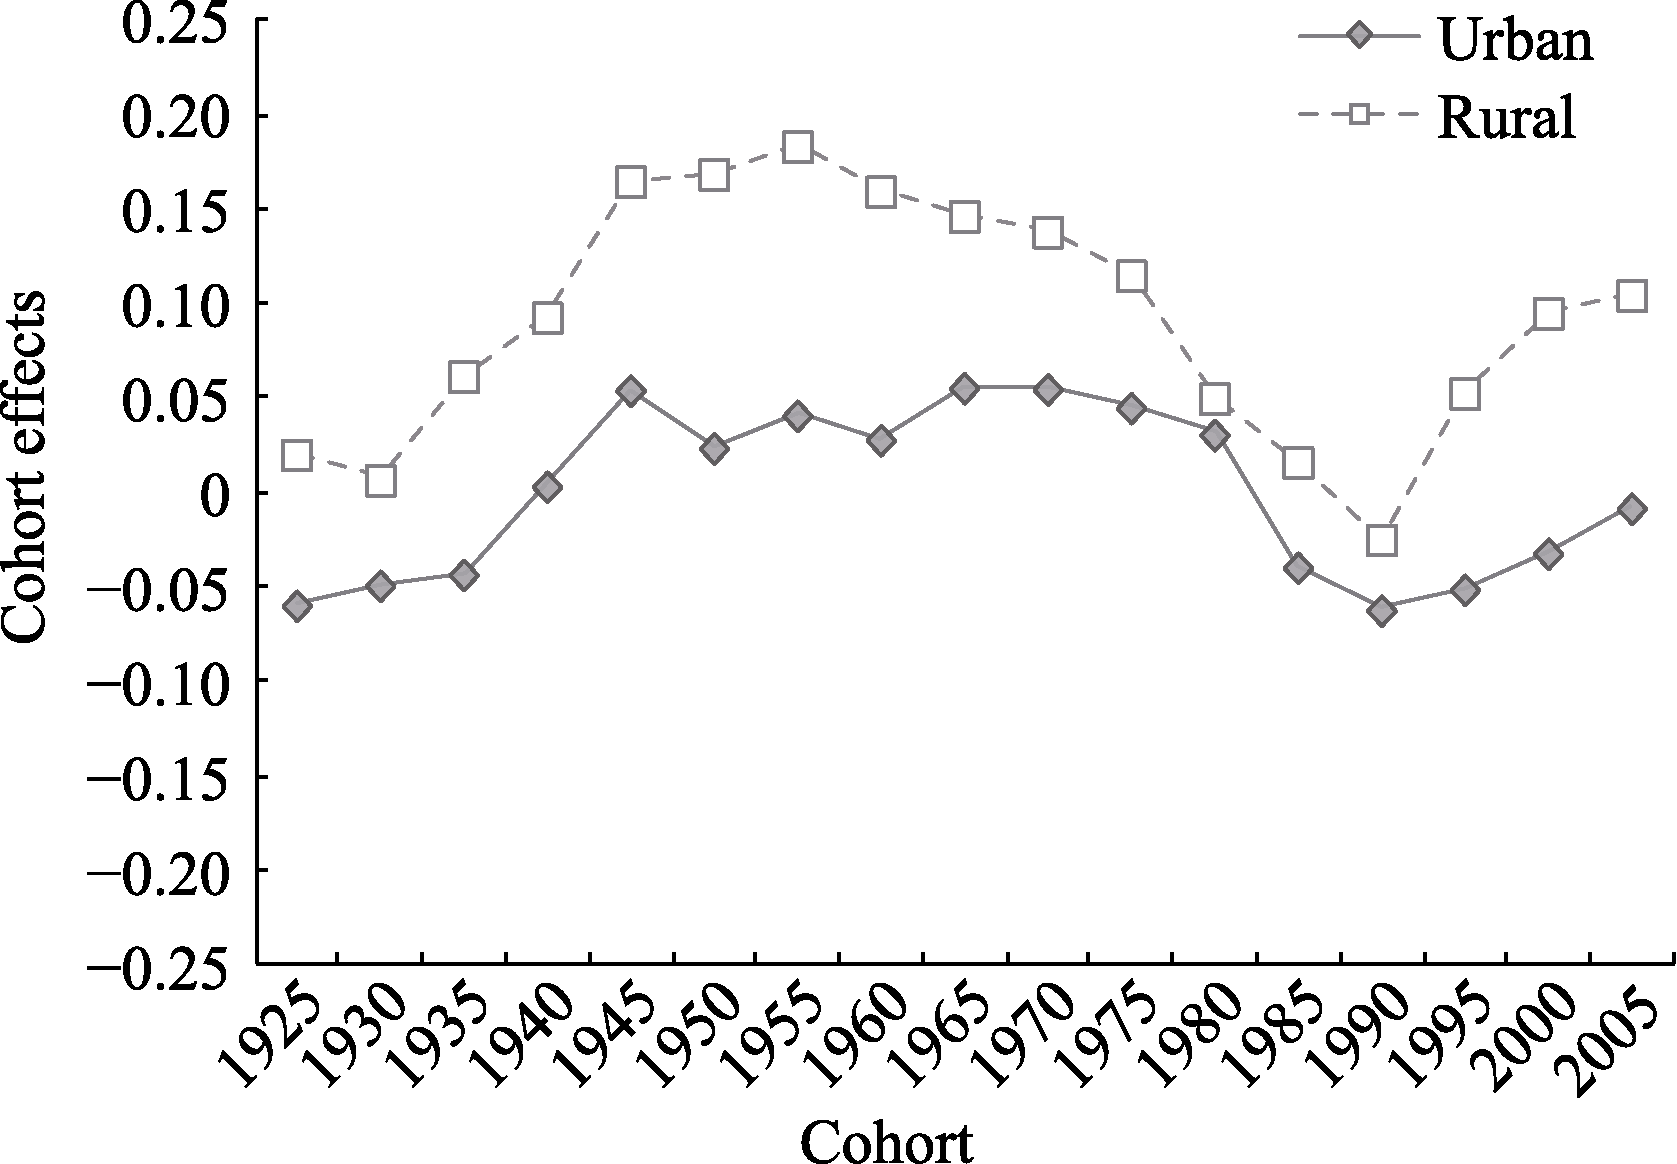
Figure 10. Hukou Differences in Cohort Effects.
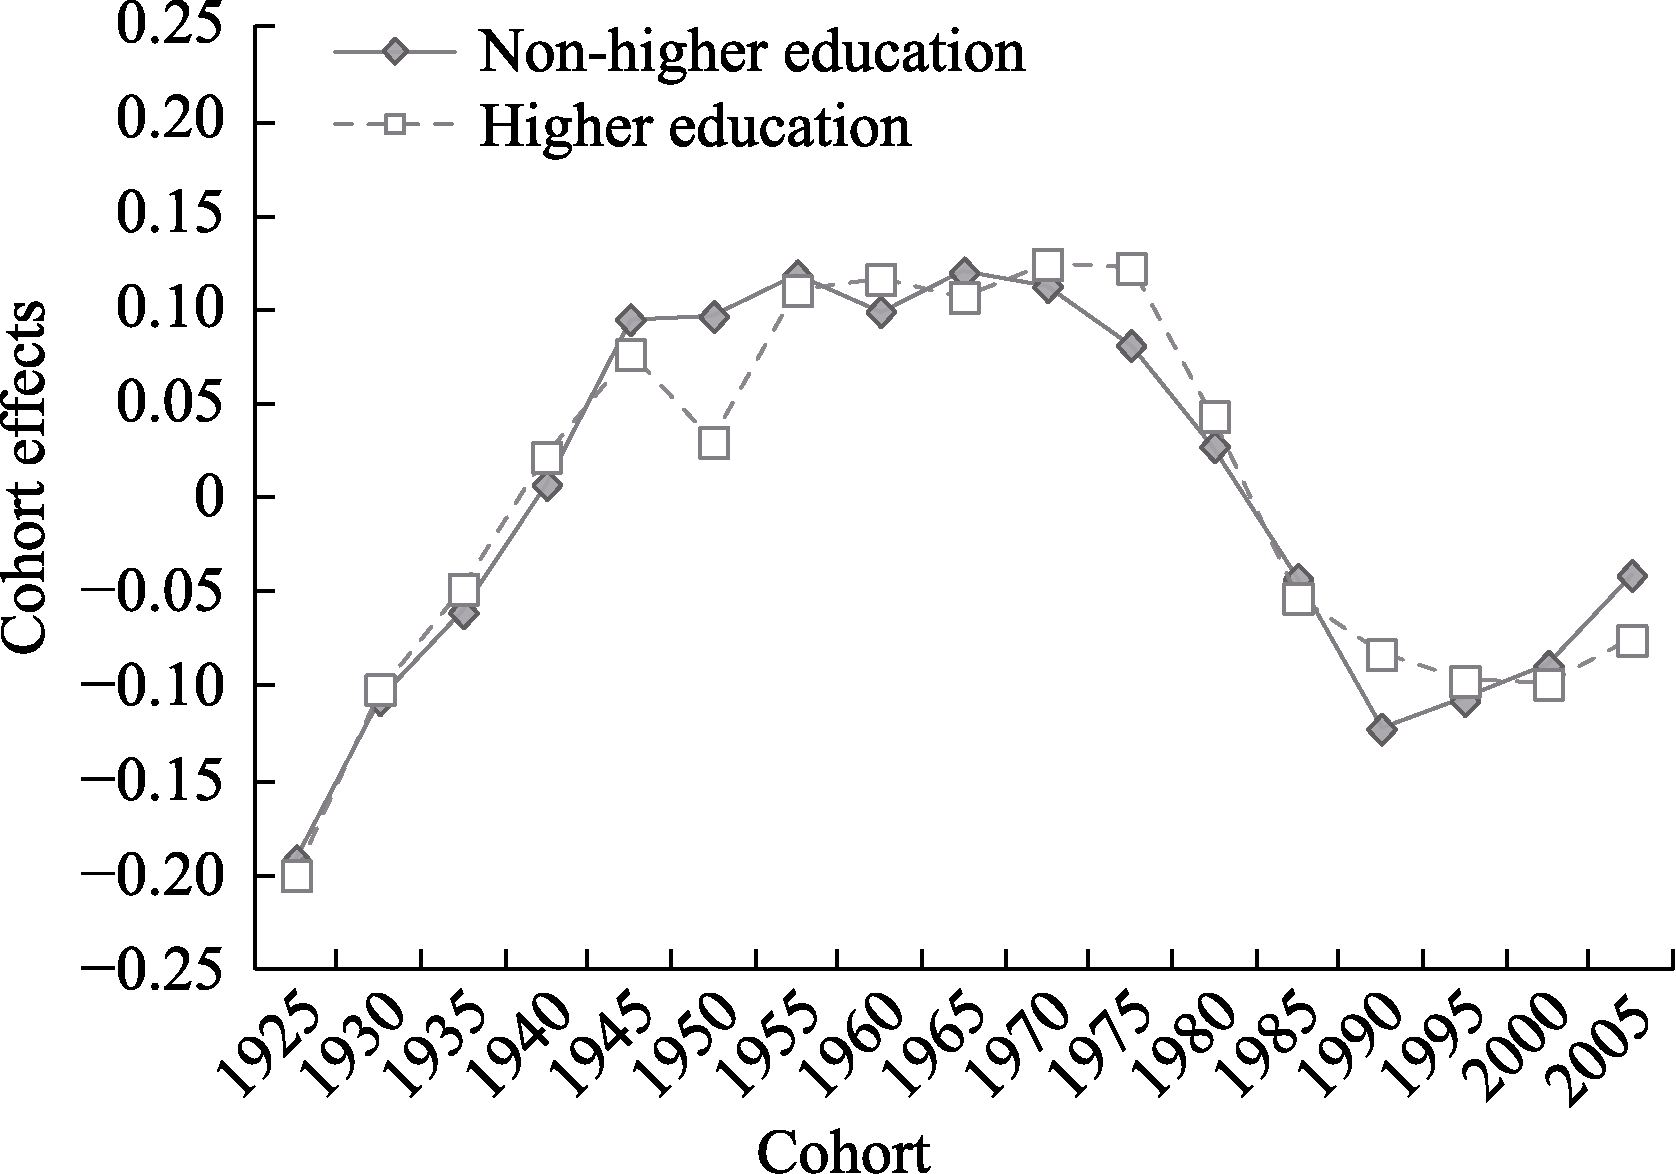
Figure 11. Educational Level Differences in Cohort Effects.
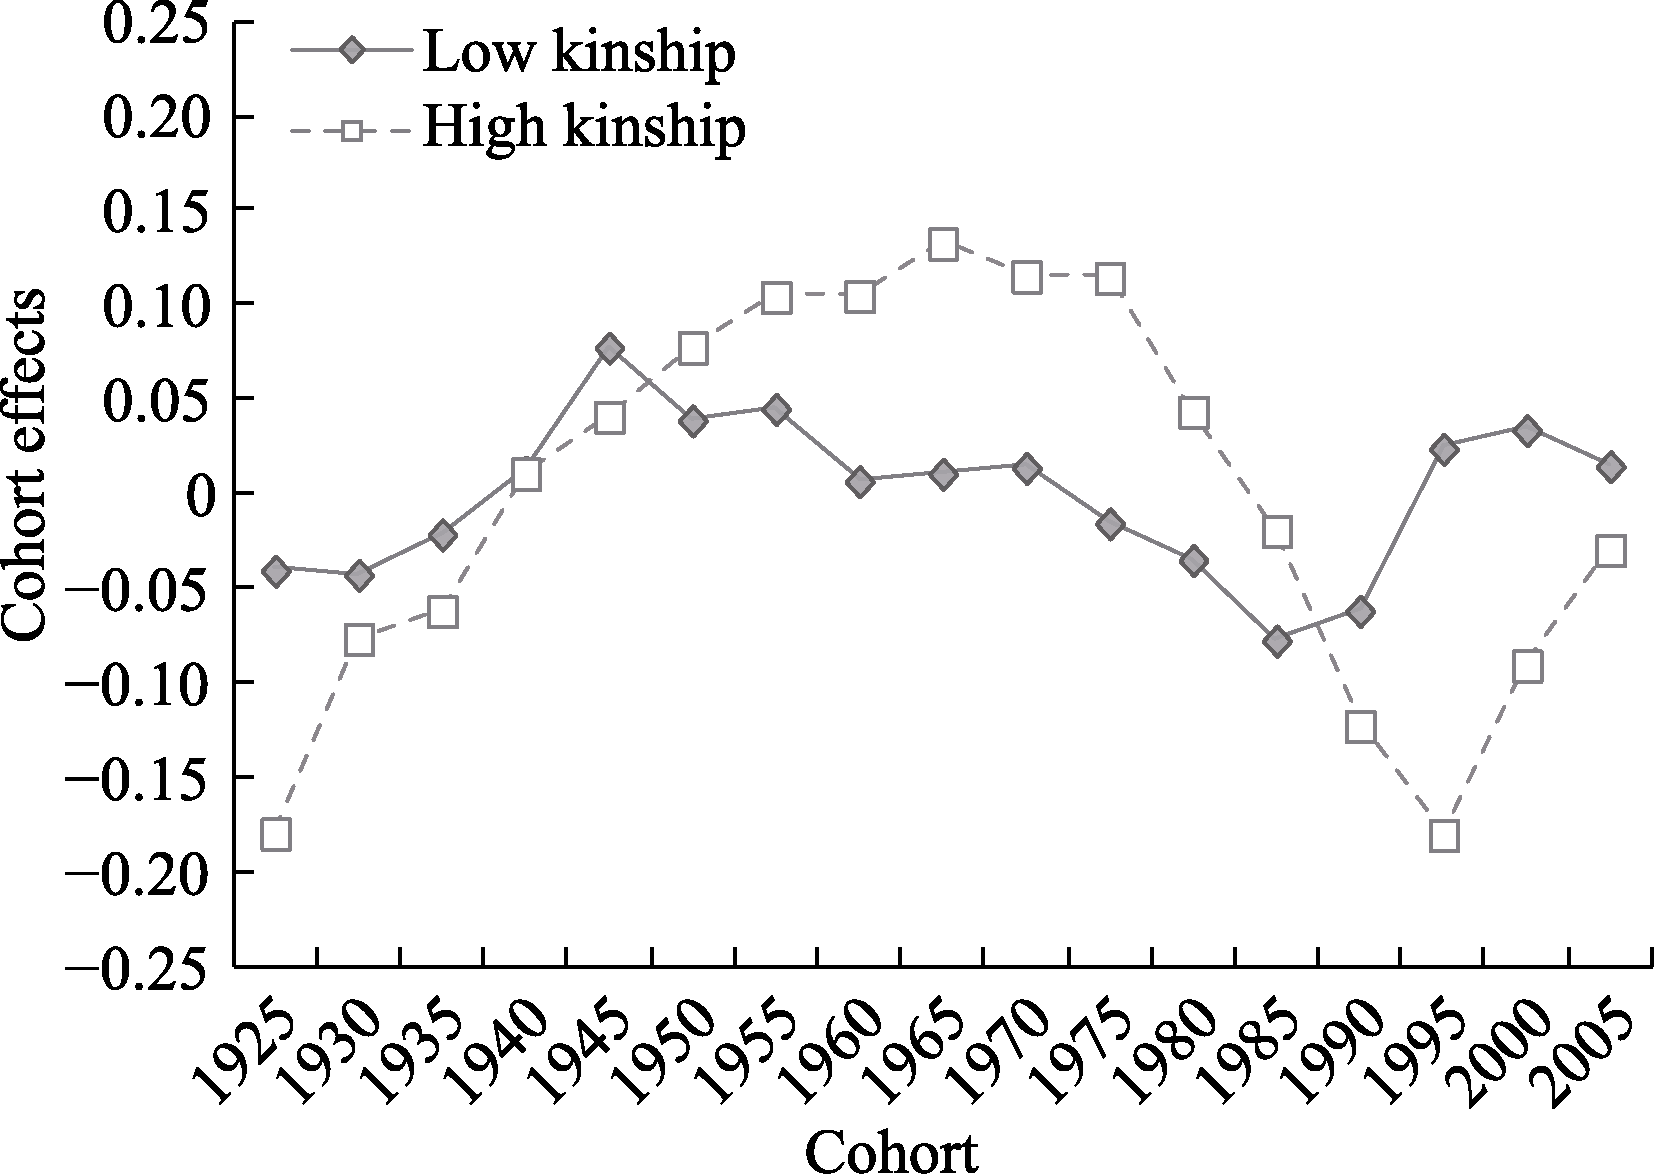
Figure 12. Kinship Differences in Cohort Effects. Note. In Figure 9, the vertical axis “cohort effect” represents the random effect coefficient (v0k) of different cohorts on the level of generalized trust. Figures 10 to 12 further incorporate group variables such as household registration (hukou), educational level, and kinship, examining their fixed effects (γ9) on the level of generalized trust, as well as their cohort random effect coefficients (v9k) on the level of generalized trust.
| Macro Variable | Coefficients | Variance | ΔVariance | |
|---|---|---|---|---|
| Period Covariates | ||||
| Basic Model | 0.4214 | |||
| Marketization Index | 0.5279** | 0.1898 | 54.96% | |
| Population Mobility Rate | 0.0882*** | 0.1411 | 66.52% | |
| Number of Social Organizations | 2.9720*** | 0.1476 | 64.97% | |
| Period Kinship | ?1.0571*** | 0.0045 | 98.93% | |
| Period Average Education Level | 0.7740*** | 0.0978 | 76.78% | |
| Government Trust Index | 0.0622*** | 0.1537 | 63.53% | |
| Gini Coefficient | ?60.1118** | 0.2376 | 43.62% | |
| Generation Variance | ||||
| Basic Model | 0.0070 | |||
| Cohort Average Education Level | ?0.0722*** | 0.0020 | 72.12% | |
| Birth Cohort Size | 0.0155** | 0.0041 | 41.67% | |
| Cohort Kinship | ?0.2223* | 0.0070 | 0.21% | |
Table 4 Main Analysis Results with Individual Macro Variables Added to the Model
| Macro Variable | Coefficients | Variance | ΔVariance | |
|---|---|---|---|---|
| Period Covariates | ||||
| Basic Model | 0.4214 | |||
| Marketization Index | 0.5279** | 0.1898 | 54.96% | |
| Population Mobility Rate | 0.0882*** | 0.1411 | 66.52% | |
| Number of Social Organizations | 2.9720*** | 0.1476 | 64.97% | |
| Period Kinship | ?1.0571*** | 0.0045 | 98.93% | |
| Period Average Education Level | 0.7740*** | 0.0978 | 76.78% | |
| Government Trust Index | 0.0622*** | 0.1537 | 63.53% | |
| Gini Coefficient | ?60.1118** | 0.2376 | 43.62% | |
| Generation Variance | ||||
| Basic Model | 0.0070 | |||
| Cohort Average Education Level | ?0.0722*** | 0.0020 | 72.12% | |
| Birth Cohort Size | 0.0155** | 0.0041 | 41.67% | |
| Cohort Kinship | ?0.2223* | 0.0070 | 0.21% | |
| Explanatory Variables | HAPC | IE | CGLM | Explanatory Variables | HAPC | IE | CGLM | ||
|---|---|---|---|---|---|---|---|---|---|
| Intercept | 3.0442*** | 2.9691*** | 3.8079*** | 2013 | 0.1303 | 0.2929 | ?0.3429 | ||
| Gender | 0.0236*** | 0.0181** | 0.0235*** | 2005 | ?0.0409 | ?0.1616 | (omitted) | ||
| Political Affiliation | 0.1209*** | 0.1083*** | 0.1218*** | 2015 | 0.3061 | 0.2929 | ?0.1675 | ||
| Ethnicity | ?0.040** | ?0.0334** | ?0.0395** | 2017 | 0.2958 | 0.2929 | ?0.1777 | ||
| Marital Status | 0.0390*** | 0.0391*** | 0.0391*** | 2018 | 0.3793 | 0.4697 | ?0.0924 | ||
| Age Effects | 2021 | 0.4720 | 0.4697 | (omitted) | |||||
| 15 | 0.0913 | 0.0967 | ?0.2741 | Cohort Efftects | |||||
| 20 | 0.0489 | 0.0137 | ?0.2972 | 1925 | ?0.1325 | ?0.4654 | ?0.2790 | ||
| 25 | 0.0165 | ?0.0471 | ?0.3509 | 1930 | ?0.0847 | ?0.0802 | ?0.0035 | ||
| 30 | ?0.0059 | ?0.0840 | ?0.3916 | 1935 | ?0.0495 | ?0.0034 | 0.0386 | ||
| 35 | ?0.0183 | ?0.1270 | ?0.4271 | 1940 | 0.0075 | 0.0678 | 0.0883 | ||
| 40 | ?0.0207 | ?0.1341 | ?0.4271 | 1945 | 0.0846 | 0.1575 | 0.1707 | ||
| 45 | ?0.0131 | ?0.1321 | ?0.4299 | 1950 | 0.0788 | 0.1584 | 0.1776 | ||
| 50 | 0.0045 | ?0.1355 | ?0.4257 | 1955 | 0.0974 | 0.1924 | 0.2173 | ||
| 55 | 0.0321 | ?0.1010 | ?0.3807 | 1960 | 0.0746 | 0.1835 | 0.2125 | ||
| 60 | 0.0697 | ?0.0389 | ?0.3181 | 1965 | 0.0884 | 0.1836 | 0.2271 | ||
| 65 | 0.1173 | 0.0698 | ?0.2116 | 1970 | 0.0823 | 0.1561 | 0.2141 | ||
| 70 | 0.1749 | 0.0899 | ?0.1769 | 1975 | 0.0592 | 0.1090 | 0.1779 | ||
| 75 | 0.2425 | 0.2231 | ?0.0546 | 1980 | 0.0112 | 0.0291 | 0.1171 | ||
| 80 | 0.3201 | 0.3064 | (omitted) | 1985 | ?0.0517 | ?0.0676 | 0.0367 | ||
| Period Effects | 1990 | ?0.1019 | ?0.1481 | ?0.0308 | |||||
| 2003 | ?0.9314 | ?1.1389 | ?1.4104 | 1995 | ?0.0727 | ?0.1544 | ?0.0151 | ||
| 2005 | ?1.3143 | ?1.1389 | ?1.7925 | 2000 | ?0.0501 | ?0.1567 | (omitted) | ||
| 2010 | 0.3523 | 0.3764 | ?0.1236 | 2005 | ?0.0409 | ?0.1616 | (omitted) | ||
| 2012 | 0.3099 | 0.3764 | ?0.1650 | ||||||
Table A1 Comparison of Analysis Results of Basic Model Using HAPC, IE, and CGLM Methods
| Explanatory Variables | HAPC | IE | CGLM | Explanatory Variables | HAPC | IE | CGLM | ||
|---|---|---|---|---|---|---|---|---|---|
| Intercept | 3.0442*** | 2.9691*** | 3.8079*** | 2013 | 0.1303 | 0.2929 | ?0.3429 | ||
| Gender | 0.0236*** | 0.0181** | 0.0235*** | 2005 | ?0.0409 | ?0.1616 | (omitted) | ||
| Political Affiliation | 0.1209*** | 0.1083*** | 0.1218*** | 2015 | 0.3061 | 0.2929 | ?0.1675 | ||
| Ethnicity | ?0.040** | ?0.0334** | ?0.0395** | 2017 | 0.2958 | 0.2929 | ?0.1777 | ||
| Marital Status | 0.0390*** | 0.0391*** | 0.0391*** | 2018 | 0.3793 | 0.4697 | ?0.0924 | ||
| Age Effects | 2021 | 0.4720 | 0.4697 | (omitted) | |||||
| 15 | 0.0913 | 0.0967 | ?0.2741 | Cohort Efftects | |||||
| 20 | 0.0489 | 0.0137 | ?0.2972 | 1925 | ?0.1325 | ?0.4654 | ?0.2790 | ||
| 25 | 0.0165 | ?0.0471 | ?0.3509 | 1930 | ?0.0847 | ?0.0802 | ?0.0035 | ||
| 30 | ?0.0059 | ?0.0840 | ?0.3916 | 1935 | ?0.0495 | ?0.0034 | 0.0386 | ||
| 35 | ?0.0183 | ?0.1270 | ?0.4271 | 1940 | 0.0075 | 0.0678 | 0.0883 | ||
| 40 | ?0.0207 | ?0.1341 | ?0.4271 | 1945 | 0.0846 | 0.1575 | 0.1707 | ||
| 45 | ?0.0131 | ?0.1321 | ?0.4299 | 1950 | 0.0788 | 0.1584 | 0.1776 | ||
| 50 | 0.0045 | ?0.1355 | ?0.4257 | 1955 | 0.0974 | 0.1924 | 0.2173 | ||
| 55 | 0.0321 | ?0.1010 | ?0.3807 | 1960 | 0.0746 | 0.1835 | 0.2125 | ||
| 60 | 0.0697 | ?0.0389 | ?0.3181 | 1965 | 0.0884 | 0.1836 | 0.2271 | ||
| 65 | 0.1173 | 0.0698 | ?0.2116 | 1970 | 0.0823 | 0.1561 | 0.2141 | ||
| 70 | 0.1749 | 0.0899 | ?0.1769 | 1975 | 0.0592 | 0.1090 | 0.1779 | ||
| 75 | 0.2425 | 0.2231 | ?0.0546 | 1980 | 0.0112 | 0.0291 | 0.1171 | ||
| 80 | 0.3201 | 0.3064 | (omitted) | 1985 | ?0.0517 | ?0.0676 | 0.0367 | ||
| Period Effects | 1990 | ?0.1019 | ?0.1481 | ?0.0308 | |||||
| 2003 | ?0.9314 | ?1.1389 | ?1.4104 | 1995 | ?0.0727 | ?0.1544 | ?0.0151 | ||
| 2005 | ?1.3143 | ?1.1389 | ?1.7925 | 2000 | ?0.0501 | ?0.1567 | (omitted) | ||
| 2010 | 0.3523 | 0.3764 | ?0.1236 | 2005 | ?0.0409 | ?0.1616 | (omitted) | ||
| 2012 | 0.3099 | 0.3764 | ?0.1650 | ||||||
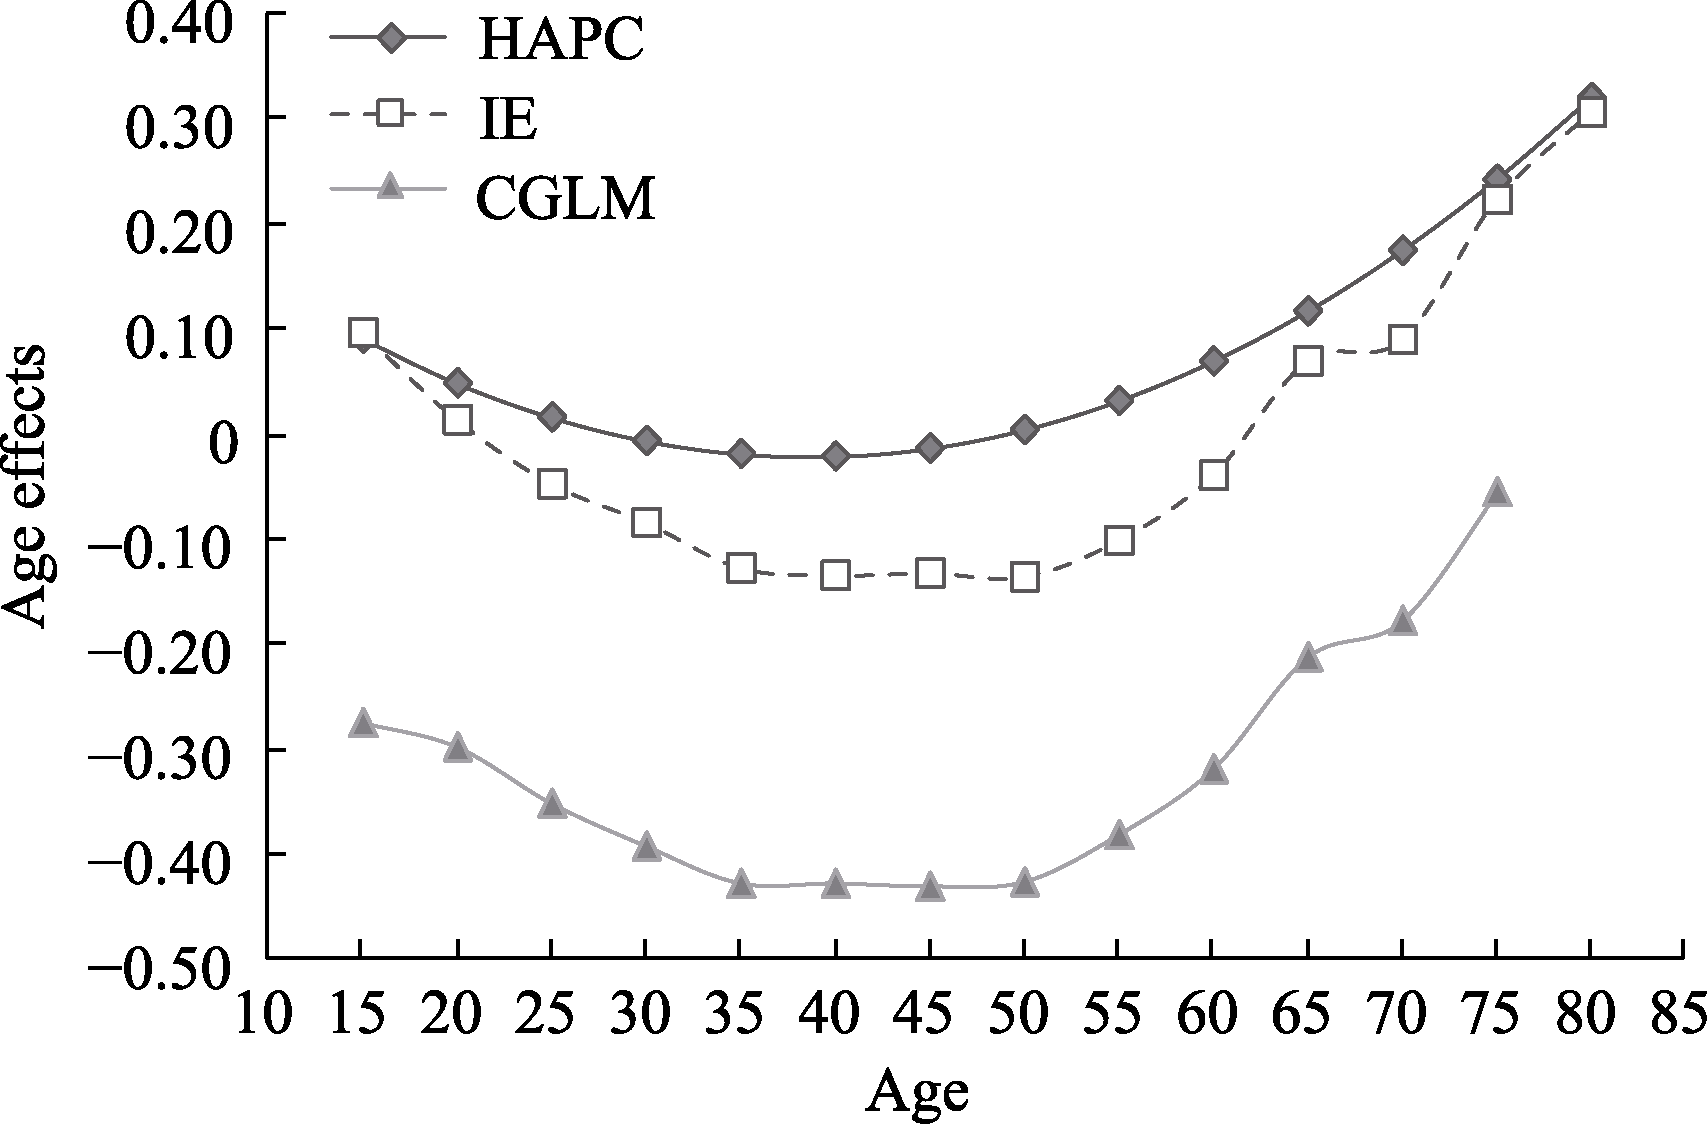
Figure A1. Comparison of Age Effects.
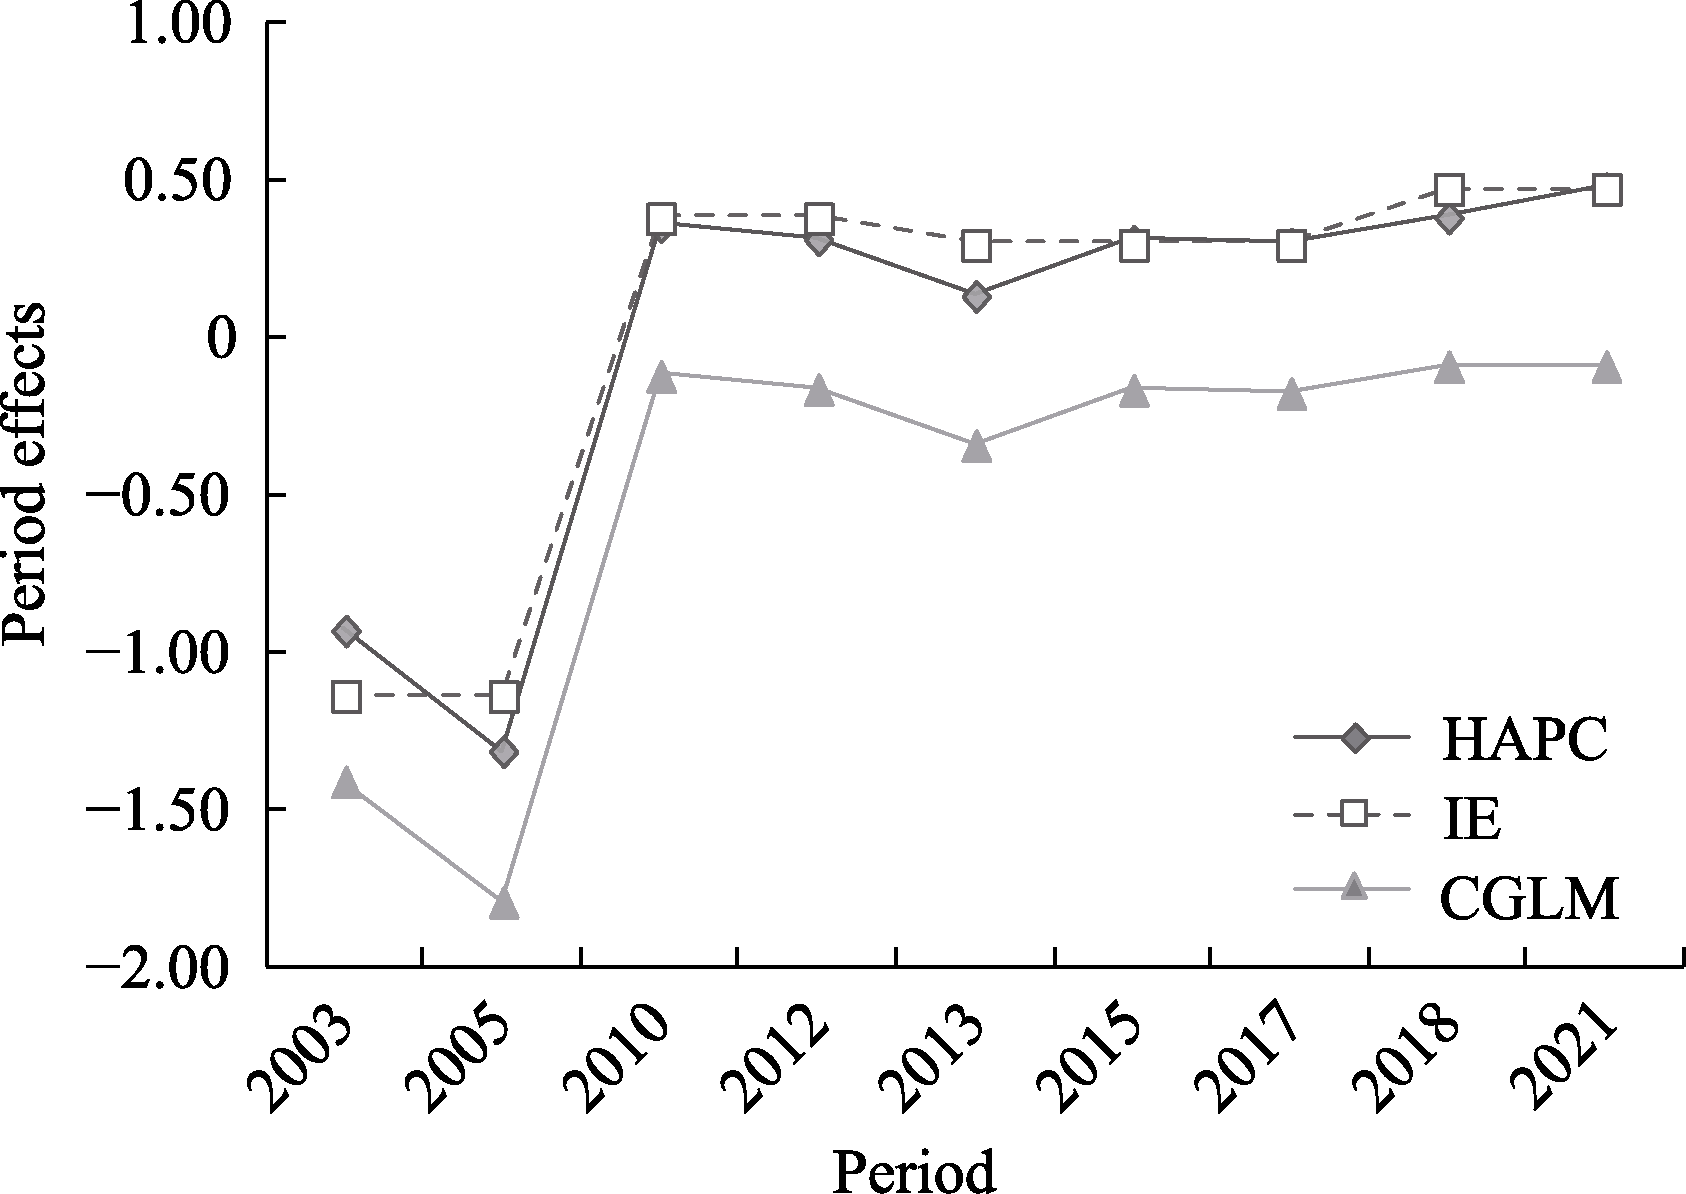
Figure A2. Comparison of Period Effects.
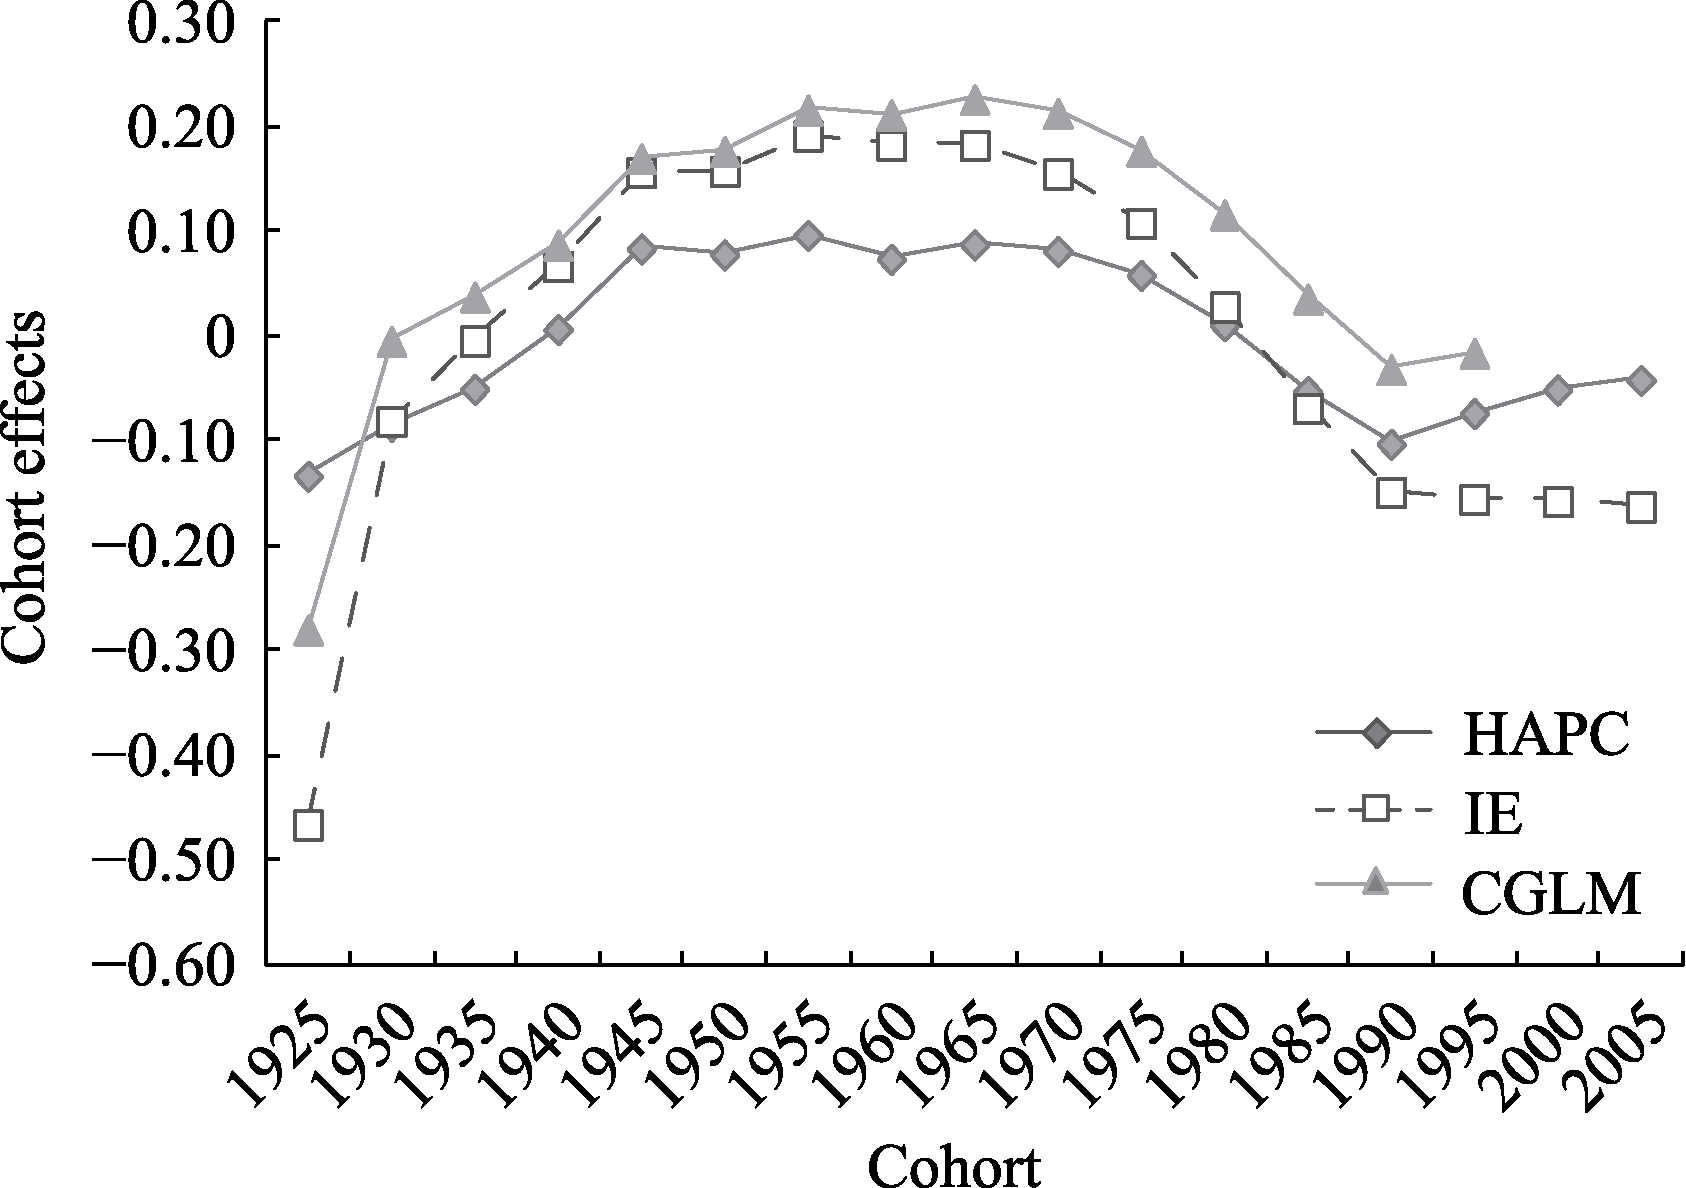
Figure A3. Comparison of Cohort Effects.
| [1] | Alesina, A., & Ferrara, E. l. (2002). Who trusts others? Journal of Public Economics, 85(2), 207-234. |
| [2] | Ao, D., Zou, Y. C., & Gao, X. (2013). An analysis of the within-regional and cross-regional variations in the generalized trust of urban residents: The resource factor theory. Chinese Journal of Sociology, 33(6), 161-179. |
| [3] |
Balliet, D., & Van Lange, P. A. M. (2013). Trust, conflict, and cooperation: A meta-analysis. Psychological Bulletin, 139(5), 1090-1112.
doi: 10.1037/a0030939 pmid: 23231532 |
| [4] | Barber, B. (1983). The logic and limits of trust. New Jersey: Rutgers University Press. |
| [5] | Bjørnskov, C. (2007). Determinants of generalized trust: A cross- country comparison. Public Choice, 130(1), 1-21. |
| [6] | Brehm, J., & Rahn, W. (1997). Individual-level evidence for the causes and consequences of social capital. American Journal of Political Science, 41(3), 999-1023. |
| [7] |
Cai, H. J., Huang, Z. H., Lin, L., Zhang, M. Y., Wang, X. O., Zhu, H. J.,... Jing, Y. M. (2020). The psychological change of the Chinese people over the past half century: A literature review. Advances in Psychological Science, 28(10), 1599-1688.
doi: 10.3724/SP.J.1042.2020.01599 |
| [8] | Cai, W. P. (2017). The impact of higher education on social trust and the evolution of its mechanism of action. Hubei Social Sciences, (2), 167-173. |
| [9] | Chen, M. Q. (2023-09-12). Consolidate the mentality foundation of Chinese modernized society. Chinese Social Sciences Today. |
| [10] |
Clark, A. K. & Eisenstein, M. A. (2013). Interpersonal trust: An age-period-cohort analysis revisited. Social Science Research, 42(2), 361-375.
doi: 10.1016/j.ssresearch.2012.09.006 pmid: 23347482 |
| [11] | Delhey, J., & Newton, K., & Welzel, C. (2011). How general is trust in “most people”? Solving the radius of trust problem. American Sociological Review, 76(5), 786-807. |
| [12] | Dincer, O. C. & Uslaner, E. M. (2010). Trust and growth, Public Choice, 142(1-2), 59-67. |
| [13] | Ding, C. M., Zhang, L., & Wang, C. (2020). Income disparity and social trust under the background of transition. Review of Economy and Management, 36(2), 15-25. |
| [14] | Erikson, E. H. (1950). Childhood and society. New York: W. W. Norton & Company. |
| [15] | Freitag, M., & Traunmüller, R. (2009). Spheres of trust: An empirical analysis of the foundations of particularised and generalised trust. European Journal of Political Research, 48(6), 782-803. |
| [16] | Hamamura, T., & Xu, Y. (2015). Changes in Chinese culture as examined through changes in personal pronoun usage. Journal of Cross-Cultural Psychology, 46(7), 930-941. |
| [17] | Han, Y. C. (2021a). The internet use, communication perimeter and generational difference in general trust. Journal of Shenzhen University (Humanities & Social Sciences), 38(6), 114-124. |
| [18] | Han, Y. C. (2021b). Population mobility and change of trust during the transition period (2005-2015). Journal of Southeast University (Philosophy and Social Science), 23(3), 108-116+148. |
| [19] |
Hu, A. (2015). A loosening tray of sand? Age, period, and cohort effects on generalized trust in Reform-Era China, 1990-2007. Social Science Research, 51, 233-246.
doi: 10.1016/j.ssresearch.2014.09.008 pmid: 25769864 |
| [20] | Hu, A. N., & Zhou, Y. (2013). Revisiting the negative effects of confucian culture on general trust: An examination based on the 2007 China resident survey data. Sociological Studies, (2), 1-23. |
| [21] | Hu, K., & Hu, R. (2008). The compositional differences of social capital between rural and urban areas. Journal of Xiamen University (Arts & Social Sciences), (6), 64-70.). |
| [22] |
Huang, J., Brink, H. M., Groot, W. (2011). College education and social trust: An evidence-based study on the causal mechanisms. Social Indicators Research, 104(2), 287-310.
pmid: 21980217 |
| [23] | Huang, J., Deng, Y. H. (2012). Higher education and social trust: A study based on Chinese and British survey data. Social Sciences in China, (11), 98-111+205-206. |
| [24] | Inglehart, R., & Wayne, E. B. (2000). Modernization, cultural change, and the persistence of traditional values. American Sociological Review, 65(1), 19-51. |
| [25] | Jie, A. H. (2000). The unit: A type of special social life scope. Journal of Zhejiang University (Humanities and Social Sciences), (5), 73-80. |
| [26] | Jing, Y., Cai, H., Bond, M. H., Li, Y., Stivers, A. W., & Tan, Q. (2021). Levels of interpersonal trust across different types of environment: The micro-macro interplay between relational distance and human ecology. Journal of Experimental Psychology: General, 150(7), 1438-1457. |
| [27] | Li, L. L., & Wang, P. (2018). Changing social attitudes in China in transition (2005-2015). Social Sciences in China, (3), 83-101. |
| [28] | Li, T. Y., & Fung, H. H. (2013). Age differences in trust: An investigation across 38 countries. The Journals of Gerontology, Series B: Psychological Sciences and Social Sciences, 68( 3), 347-355. |
| [29] | Li, X. G., & Guo, X. X. (2022). Dynamics of social capital in Urban China, 1999 to 2014: An age-period-cohort analysis. Social Networks, 68(10), 394-406. |
| [30] | Lin, J., Li, W., Guo, Z., & Kou, Y. (2023). When and why does economic inequality predict prosocial behaviour? Examining the role of interpersonal trust among different targets. European Journal of Social Psychology. 54(1), 136-153. https://doi.org/10.1002/ejsp.3007. |
| [31] | Lin, K., Liu, X. Q., & Mao, H. (2010). Social trust and social quality: The analysis and assessment on the data of social quality survey in Zhejiang province. The Journal of Jiangsu Administration Institute, (4), 61-67. |
| [32] | Luhmann, N. (1979). Trust and power. New Jersey: John Wiley & Sons, Inc. |
| [33] | Lv, F., & Mei, L. (2016). Reconstruction of social foundational order in the post-Danwei era. Academia Bimestris (4), 76-81. |
| [34] | Mark, E. W. (2004). Democracy and trust (Wu Hui, Trans.). Huaxia. (Original work published 1999) |
| [35] | Mayer, R. C., Davis, J. H., & Schoorman, F. D. (1995). An integrative model of organizational trust. Academy of Management Review, 20(3), 709-734. |
| [36] | Morselli, D., & Glaeser, S. (2018). Economic conditions and social trust climates in Europe over ten years: An ecological analysis of change. Journal of Trust Research, 8(1), 68-86. |
| [37] | Paxton, P. (1999). Is social capital declining in the United States? A multiple indicator assessment. American Journal of Sociology, 105(1), 88-127. |
| [38] | Pletzer, J. L., Balliet, D., Joireman, J., Kuhlman, D. M., Voelpel, S. C., & Van Lange, P. A. M. (2018). Social value orientation, expectations, and cooperation in social dilemmas: A meta-analysis. European Journal of Personality, 32(1), 62-83. |
| [39] | Putnam, R. D. (1995a). Bowling alone: America’s declining social capital. Journal of Democracy, 6(1), 223-234. |
| [40] | Putnam, R. D. (1995b). Tuning in, tuning out: The strange disappearance of social capital in America. PS: Political Science and Politics, 28(4), 664-683. |
| [41] | Putnam, R. D. (2001). Civic disengagement in contemporary America. Government and Opposition, 36(2), 135-156. |
| [42] | Robinson, R. V., & Jackson, E. F. (2001). Is trust in others declining in America? An age-period-cohort analysis. Social Science Research, 30(1), 117-145. |
| [43] | Romano, A., Sutter, M., Liu, J. H., Yamagishi, T., & Balliet, D. (2021). National parochialism is ubiquitous across 42 nations around the world. Nature Communications, 12(1), 4456. |
| [44] | Rothstein, B., & Dietlind, S. (2003). Social capital, impartiality and the welfare state:An institutional approach. In M.Hooghe & D.Stolle (Eds.), Generating social capital: Civil society and institutions in comparative perspective. NewYork: Palgrave MacMillan. |
| [45] |
Rotter, J. B. (1967). A new scale for the measurement of interpersonal trust. Journal of Personality, 35(4), 651-665.
doi: 10.1111/j.1467-6494.1967.tb01454.x pmid: 4865583 |
| [46] | Shen, G. J., & Zhang, C. C. (2016). Income inequality, social stratification and social trust. Comparative Economic & Social Systems, (1), 121-136. |
| [47] | Smith, T. W. (1997). Factors relating to misanthropy in contemporary American society. Social Science Research, 26(2), 170-196. |
| [48] |
Thomson, R., Yuki, M., Talhelm, T., Schug, J., Kito, M., Ayanian, A. H.,... Visserman, M. L. (2018). Relational mobility predicts social behaviors in 39 countries and is tied to historical farming and threat. Proceedings of the National Academy of Sciences of the United States of America, 115(29), 7521-7526.
doi: 10.1073/pnas.1713191115 pmid: 29959208 |
| [49] | Tian, Y. P., & Lv, F. (2009). The end of danwei society and its social risks. Jilin University Journal Social Science Edition, 49(6), 17-23. |
| [50] |
Trzesniewski, K. H., & Donnellan, M. B. (2010). Rethinking “generation me”: A study of cohort effects from 1976-2006. Perspectives on Psychological Science, 5(1), 58-75.
doi: 10.1177/1745691609356789 pmid: 26162063 |
| [51] |
Twenge, J. M., Campbell, W. K., & Carter, N. T. (2014). Declines in trust in others and confidence in institutions among American adults and late adolescents, 1972-2012. Psychological Science, 25(10), 1914-1923.
doi: 10.1177/0956797614545133 pmid: 25205784 |
| [52] | Uslaner, E. M. (2002). The moral foundations of trust. Cambridge: Cambridge University Press. |
| [53] | Vogel, E. F. (1965). From friendship to comradeship: The change in personal relations in communist China. The China Quarterly, 21, 46-66. |
| [54] | Welzel, C. (2014). Evolution, empowerment and emancipation: How societies climb the freedom ladder. World Development, 64, 33-51. |
| [55] | Xie, Y., & Zhou, X. (2014). Income inequality in today’s China. Proceedings of the National Academy of Sciences, 111(19), 6928-6933. |
| [56] | Xin, Z., & Xin, S. (2017). Marketization process predicts trust decline in China. Journal of Economic Psychology, 62, 120-129. |
| [57] |
Xin, Z. Q. (2019). Marketization and interpersonal trust decline in China. Advances in Psychological Science, 27(12), 1951-1966.
doi: 10.3724/SP.J.1042.2019.01951 |
| [58] | Xu, Q., Wang, J. S., & Wu, Y. X. (2022). Theory-driven or method-driven? New approaches to age-period-cohort analysis. Sociological Studies, 37(6), 36-58. |
| [59] | Yang, H., & Huang, Y. T. (2022). How can general trust be possible in market economy:A study on the trust in home service industry. Journal of East China University of Science and Technology (Social Science Edition), 37(1), 54-65. |
| [60] | Yang, M., Meng, T. G., & Fang, R. (2011). Social trust in a changing society: Stock and change from 1990 to 2010. Journal of Peking University (Philosophy and Social Sciences), 48(6), 100-109. |
| [61] | Yang, Y., & Land, K. C. (2013). Age-period-cohort analysis: New models, methods, and empirical applications. New York: Chapman and Hall/CRC. |
| [62] | Yu, G. L., & Wang, H. (2016). Social transformation: Social psychology analysis on the lack of public sense of security. Sociological Review of China, 4(3), 11-20. |
| [63] | Yu, H. B. (2017). On the change of Chinese peasants’ interpersonal trust and its determinants: Analysis of the data from five waves survey (2002-2015) in 40 villages of Jiangxi province. Journal of Central China Normal University (Humanities and Social Sciences), 56(5), 1-10. |
| [64] | Yuan, M., Spadaro, G., Jin, S., Wu, J. H., Kou, Y., Paul, A. M. V. L., & Balliet, D. (2022). Did cooperation among strangers decline in the United States? A cross-temporal meta-analysis of social dilemmas (1956-2017). Psychological Bulletin, 148(3-4), 129-157. |
| [65] | Yuan, M. L., Wu, J. H., Jing, S. X., Lin, J., Kou, Y., & Van Lange, P. A. M. (2024). The changes in cooperation among strangers in China: A cross-temporal meta-analysis of social dilemmas (1999-2019). Acta Psychologica Sinica, 56(9), 1159-1175. |
| [66] | Zhai, X. W. (2008). Trust and risk society: Western theories and Chinese issues. Social Science Research, (4). 123-128. |
| [67] | Zhai, X. W. (2013). How to understand the relationship between confucian culture and trust. Journal of Social Sciences, (6), 70-76. |
| [68] | Zhai, X. W. (2017). Chinese social credit: Theoretical, empirical, and policy research. Beijing: China Social Sciences Press. |
| [69] | Zhai, X. W. (2023). Relational dimension theory and its explanatory power. Open Times, (1), 90-94. |
| [70] | Zhao, C., & Dong, C. (2019). Democracy promotionand social trust improvement: An empirical analysis of the “unexpected” effect of farmers’cooperatives. China Rural Survey, (6), 45-58. |
| [71] | Zhao, W. L., & Feng, Y. (2011, July). Regional comparison of trust among urban residents in China. Presented at the 2010 Annual Meeting of the Chinese Sociological Society, Harbin, China. |
| [72] | Zhong, X. J., & Su, P. T. (2022). The transformation and symbiosis of trust: The logic of community order construction in community governance: An analysis of trust network change of urban locksmith. Chongqing Social Sciences, (12), 66-84. |
| Viewed | ||||||
|
Full text |
|
|||||
|
Abstract |
|
|||||