ISSN 0439-755X
CN 11-1911/B
CN 11-1911/B
Acta Psychologica Sinica ›› 2024, Vol. 56 ›› Issue (7): 876-894.doi: 10.3724/SP.J.1041.2024.00876
• Special issue: Exploring cultural and psychological transformations in Chinese society • Previous Articles Next Articles
TANG Ningyu( ), ZHEN Danlei, GUAN Jian
Published:2024-07-25
Online:2024-05-21
Contact:
TANG Ningyu
E-mail:nytang@sjtu.edu.cn
TANG Ningyu, ZHEN Danlei, GUAN Jian. (2024). Work values of Chinese generational cohorts. Acta Psychologica Sinica, 56(7), 876-894.
Add to citation manager EndNote|Ris|BibTeX
URL: https://journal.psych.ac.cn/acps/EN/10.3724/SP.J.1041.2024.00876
| Generaional cohorts | Birth years | n | Materialism | Post-materialism | ||
|---|---|---|---|---|---|---|
| M | SD | M | SD | |||
| Pre-reform | Before 1978 | 4656 | 0.48 | 0.55 | −0.48 | 0.55 |
| Reform | 1978−1989 | 1110 | 0.41 | 0.55 | −0.41 | 0.55 |
| Post-reform | After 1989 | 84 | 0.16 | 0.58 | −0.16 | 0.58 |
Table 1 Work values of generational cohorts: means and standard deviations (Study 1)
| Generaional cohorts | Birth years | n | Materialism | Post-materialism | ||
|---|---|---|---|---|---|---|
| M | SD | M | SD | |||
| Pre-reform | Before 1978 | 4656 | 0.48 | 0.55 | −0.48 | 0.55 |
| Reform | 1978−1989 | 1110 | 0.41 | 0.55 | −0.41 | 0.55 |
| Post-reform | After 1989 | 84 | 0.16 | 0.58 | −0.16 | 0.58 |
| Variables | Materialism | Post-materialism | ||
|---|---|---|---|---|
| Model 1 | Model 2 | Model 3 | Mode 4 | |
| Generational cohorts | ||||
| Pre-reform | 0.01(0.04) | (baseline) | −0.01(0.04) | (baseline) |
| Reform | (baseline) | −0.01(0.04) | (baseline) | 0.01(0.04) |
| Post-reform | −0.14*(0.07) | −0.14† (0.08) | 0.14*(0.07) | 0.14† (0.08) |
| age | ||||
| Under 30 (baseline) | ||||
| 30~39 | 0.12***(0.04) | 0.12***(0.04) | −0.12***(0.04) | −0.12***(0.04) |
| 40~49 | 0.09† (0.05) | 0.09† (0.05) | −0.09† (0.05) | −0.09† (0.05) |
| 50~59 | 0.08(0.05) | 0.08(0.05) | −0.08(0.05) | −0.08(0.05) |
| Period | ||||
| 2012 (baseline) | ||||
| 2014 | 0.21***(0.02) | 0.21***(0.02) | −0.21***(0.02) | −0.21***(0.02) |
| 2016 | 0.22***(0.02) | 0.22***(0.02) | −0.22***(0.02) | −0.22***(0.02) |
| Controls | ||||
| Education | −0.05***(0.01) | −0.05***(0.01) | 0.05***(0.01) | 0.05***(0.01) |
| Gender | 0.04*(0.02) | 0.04*(0.02) | −0.04*(0.02) | −0.04*(0.02) |
| Job type | 0.05***(0.01) | 0.05***(0.01) | −0.05***(0.01) | −0.05***(0.01) |
| Hukou | −0.07***(0.02) | −0.07***(0.02) | 0.07***(0.02) | 0.07***(0.02) |
| Intercept | 0.18***(0.04) | 0.19***(0.06) | −0.18***(0.04) | −0.19***(0.06) |
| R2 | 0.08 | 0.08 | 0.08 | 0.08 |
| F | 39.32*** | 39.32*** | 39.32*** | 39.32*** |
Table 2 The APC model results of Materialism and Post-materialism values (Study 1)
| Variables | Materialism | Post-materialism | ||
|---|---|---|---|---|
| Model 1 | Model 2 | Model 3 | Mode 4 | |
| Generational cohorts | ||||
| Pre-reform | 0.01(0.04) | (baseline) | −0.01(0.04) | (baseline) |
| Reform | (baseline) | −0.01(0.04) | (baseline) | 0.01(0.04) |
| Post-reform | −0.14*(0.07) | −0.14† (0.08) | 0.14*(0.07) | 0.14† (0.08) |
| age | ||||
| Under 30 (baseline) | ||||
| 30~39 | 0.12***(0.04) | 0.12***(0.04) | −0.12***(0.04) | −0.12***(0.04) |
| 40~49 | 0.09† (0.05) | 0.09† (0.05) | −0.09† (0.05) | −0.09† (0.05) |
| 50~59 | 0.08(0.05) | 0.08(0.05) | −0.08(0.05) | −0.08(0.05) |
| Period | ||||
| 2012 (baseline) | ||||
| 2014 | 0.21***(0.02) | 0.21***(0.02) | −0.21***(0.02) | −0.21***(0.02) |
| 2016 | 0.22***(0.02) | 0.22***(0.02) | −0.22***(0.02) | −0.22***(0.02) |
| Controls | ||||
| Education | −0.05***(0.01) | −0.05***(0.01) | 0.05***(0.01) | 0.05***(0.01) |
| Gender | 0.04*(0.02) | 0.04*(0.02) | −0.04*(0.02) | −0.04*(0.02) |
| Job type | 0.05***(0.01) | 0.05***(0.01) | −0.05***(0.01) | −0.05***(0.01) |
| Hukou | −0.07***(0.02) | −0.07***(0.02) | 0.07***(0.02) | 0.07***(0.02) |
| Intercept | 0.18***(0.04) | 0.19***(0.06) | −0.18***(0.04) | −0.19***(0.06) |
| R2 | 0.08 | 0.08 | 0.08 | 0.08 |
| F | 39.32*** | 39.32*** | 39.32*** | 39.32*** |
| Variables | M | SD | 1 | 2 | 3 | 4 | 5 | 6 | 7 | 8 | 9 | 10 | 11 | 12 | 13 |
|---|---|---|---|---|---|---|---|---|---|---|---|---|---|---|---|
| 1. Materialism | 0.07 | 0.61 | |||||||||||||
| 2. Post-materialism | −0.07 | 0.61 | −1.00** | ||||||||||||
| 3. Open to change | −0.17 | 0.46 | −0.36** | 0.36** | |||||||||||
| 4. Conservation | 0.03 | 0.38 | 0.26** | −0.26** | −0.56** | ||||||||||
| 5. Self-enhancement | 0.10 | 0.43 | 0.57** | −0.57** | −0.50** | 0.06 | |||||||||
| 6. Self-transcendence | 0.04 | 0.41 | −0.45** | 0.45** | −0.08* | −0.36** | −0.56** | ||||||||
| 7. Pre-reform | 0.31 | 0.46 | −0.01 | 0.01 | −0.06 | −0.01 | 0.00 | 0.07* | |||||||
| 8. Reform | 0.31 | 0.46 | 0.00 | 0.00 | −0.03 | −0.01 | 0.02 | 0.02 | −0.45** | ||||||
| 9. Post-reform | 0.38 | 0.49 | 0.01 | −0.01 | 0.08* | 0.02 | −0.02 | −0.08* | −0.53** | −0.53** | |||||
| 10. Gender | 1.56 | 0.50 | 0.06 | −0.06 | 0.04 | −0.01 | 0.10** | −0.14** | −0.04 | −0.03 | 0.06 | ||||
| 11. Unmarried | 0.16 | 0.37 | 0.16** | −0.16** | 0.01 | 0.00 | 0.14** | −0.15** | −0.25** | −0.23** | 0.45** | 0.13** | |||
| 12. Married | 0.83 | 0.38 | −0.16** | 0.16** | 0.01 | −0.01 | −0.15** | 0.15** | 0.24** | 0.20** | −0.42** | −0.14** | −0.96** | ||
| 13. Education | 4.78 | 0.91 | −0.05 | 0.05 | 0.08* | −0.04 | −0.01 | −0.04 | −0.26** | 0.09** | 0.16** | −0.02 | 0.08* | −0.07* | |
| 14. Hukou | 1.25 | 0.43 | 0.07* | −0.07* | 0.04 | −0.03 | 0.08* | −0.10** | −0.12** | −0.06* | 0.17** | 0.06* | 0.20** | −0.19** | −0.20** |
Table 3 Means, standard deviations, and correlations (Study 2)
| Variables | M | SD | 1 | 2 | 3 | 4 | 5 | 6 | 7 | 8 | 9 | 10 | 11 | 12 | 13 |
|---|---|---|---|---|---|---|---|---|---|---|---|---|---|---|---|
| 1. Materialism | 0.07 | 0.61 | |||||||||||||
| 2. Post-materialism | −0.07 | 0.61 | −1.00** | ||||||||||||
| 3. Open to change | −0.17 | 0.46 | −0.36** | 0.36** | |||||||||||
| 4. Conservation | 0.03 | 0.38 | 0.26** | −0.26** | −0.56** | ||||||||||
| 5. Self-enhancement | 0.10 | 0.43 | 0.57** | −0.57** | −0.50** | 0.06 | |||||||||
| 6. Self-transcendence | 0.04 | 0.41 | −0.45** | 0.45** | −0.08* | −0.36** | −0.56** | ||||||||
| 7. Pre-reform | 0.31 | 0.46 | −0.01 | 0.01 | −0.06 | −0.01 | 0.00 | 0.07* | |||||||
| 8. Reform | 0.31 | 0.46 | 0.00 | 0.00 | −0.03 | −0.01 | 0.02 | 0.02 | −0.45** | ||||||
| 9. Post-reform | 0.38 | 0.49 | 0.01 | −0.01 | 0.08* | 0.02 | −0.02 | −0.08* | −0.53** | −0.53** | |||||
| 10. Gender | 1.56 | 0.50 | 0.06 | −0.06 | 0.04 | −0.01 | 0.10** | −0.14** | −0.04 | −0.03 | 0.06 | ||||
| 11. Unmarried | 0.16 | 0.37 | 0.16** | −0.16** | 0.01 | 0.00 | 0.14** | −0.15** | −0.25** | −0.23** | 0.45** | 0.13** | |||
| 12. Married | 0.83 | 0.38 | −0.16** | 0.16** | 0.01 | −0.01 | −0.15** | 0.15** | 0.24** | 0.20** | −0.42** | −0.14** | −0.96** | ||
| 13. Education | 4.78 | 0.91 | −0.05 | 0.05 | 0.08* | −0.04 | −0.01 | −0.04 | −0.26** | 0.09** | 0.16** | −0.02 | 0.08* | −0.07* | |
| 14. Hukou | 1.25 | 0.43 | 0.07* | −0.07* | 0.04 | −0.03 | 0.08* | −0.10** | −0.12** | −0.06* | 0.17** | 0.06* | 0.20** | −0.19** | −0.20** |
| Generaional cohorts | Birth years | n | Materialism | Post-materialism | Open to change | Conservation | Self-enhancement | Self-transcendence | ||||||
|---|---|---|---|---|---|---|---|---|---|---|---|---|---|---|
| M | SD | M | SD | M | SD | M | SD | M | SD | M | SD | |||
| Pre-reform | Before 1978 | 306 | 0.06 | 0.63 | −0.06 | 0.63 | −0.20 | 0.45 | 0.02 | 0.38 | 0.10 | 0.44 | 0.08 | 0.38 |
| Reform | 1978−1989 | 306 | 0.07 | 0.53 | −0.07 | 0.53 | −0.18 | 0.45 | 0.02 | 0.35 | 0.11 | 0.37 | 0.05 | 0.37 |
| Post-reform | After 1989 | 380 | 0.07 | 0.66 | −0.07 | 0.66 | −0.12 | 0.46 | 0.04 | 0.39 | 0.08 | 0.48 | 0.00 | 0.46 |
Table 4 Work values of generational cohorts: means and standard deviations (Study 2)
| Generaional cohorts | Birth years | n | Materialism | Post-materialism | Open to change | Conservation | Self-enhancement | Self-transcendence | ||||||
|---|---|---|---|---|---|---|---|---|---|---|---|---|---|---|
| M | SD | M | SD | M | SD | M | SD | M | SD | M | SD | |||
| Pre-reform | Before 1978 | 306 | 0.06 | 0.63 | −0.06 | 0.63 | −0.20 | 0.45 | 0.02 | 0.38 | 0.10 | 0.44 | 0.08 | 0.38 |
| Reform | 1978−1989 | 306 | 0.07 | 0.53 | −0.07 | 0.53 | −0.18 | 0.45 | 0.02 | 0.35 | 0.11 | 0.37 | 0.05 | 0.37 |
| Post-reform | After 1989 | 380 | 0.07 | 0.66 | −0.07 | 0.66 | −0.12 | 0.46 | 0.04 | 0.39 | 0.08 | 0.48 | 0.00 | 0.46 |
| Variables | Materialism | Post-materialism | ||
|---|---|---|---|---|
| Model 1 | Model 2 | Model 3 | Model 4 | |
| Generational cohorts | ||||
| Pre-reform | −0.01 (0.05) | 0.01 (0.05) | ||
| Reform | 0.01 (0.05) | −0.01 (0.05) | ||
| Post-reform | −0.11* (0.05) | −0.09† (0.05) | 0.11* (0.05) | 0.09† (0.05) |
| Controls | ||||
| Gender | 0.05 (0.04) | 0.05 (0.04) | −0.05 (0.04) | −0.05 (0.04) |
| Unmarried | 0.11 (0.19) | 0.11 (0.19) | −0.11 (0.19) | −0.11 (0.19) |
| Married | −0.20 (0.18) | −0.20 (0.18) | 0.20 (0.18) | 0.20 (0.18) |
| Education | −0.03 (0.02) | −0.03 (0.02) | 0.03 (0.02) | 0.03 (0.02) |
| Hukou | 0.06 (0.05) | 0.06 (0.05) | −0.06 (0.05) | −0.06 (0.05) |
| Intercept | 0.25 (0.24) | 0.23 (0.23) | −0.25 (0.24) | −0.23 (0.23) |
| R2 | 0.04 | 0.04 | 0.04 | 0.04 |
| F | 5.41*** | 5.41*** | 5.41*** | 5.41*** |
Table 5 Relationships between generational cohorts and work values (materialism and post-materialism work values; Study 2)
| Variables | Materialism | Post-materialism | ||
|---|---|---|---|---|
| Model 1 | Model 2 | Model 3 | Model 4 | |
| Generational cohorts | ||||
| Pre-reform | −0.01 (0.05) | 0.01 (0.05) | ||
| Reform | 0.01 (0.05) | −0.01 (0.05) | ||
| Post-reform | −0.11* (0.05) | −0.09† (0.05) | 0.11* (0.05) | 0.09† (0.05) |
| Controls | ||||
| Gender | 0.05 (0.04) | 0.05 (0.04) | −0.05 (0.04) | −0.05 (0.04) |
| Unmarried | 0.11 (0.19) | 0.11 (0.19) | −0.11 (0.19) | −0.11 (0.19) |
| Married | −0.20 (0.18) | −0.20 (0.18) | 0.20 (0.18) | 0.20 (0.18) |
| Education | −0.03 (0.02) | −0.03 (0.02) | 0.03 (0.02) | 0.03 (0.02) |
| Hukou | 0.06 (0.05) | 0.06 (0.05) | −0.06 (0.05) | −0.06 (0.05) |
| Intercept | 0.25 (0.24) | 0.23 (0.23) | −0.25 (0.24) | −0.23 (0.23) |
| R2 | 0.04 | 0.04 | 0.04 | 0.04 |
| F | 5.41*** | 5.41*** | 5.41*** | 5.41*** |
| Variables | Open to change | Conservation | Self-enhancement | Self-transcendence | ||||
|---|---|---|---|---|---|---|---|---|
| Model 1 | Model 2 | Model 3 | Model 4 | Model 5 | Model 6 | Model 7 | Model 8 | |
| Generational cohorts | ||||||||
| Pre-reform | 0.00 (0.04) | −0.01 (0.03) | 0.00 (0.04) | 0.02 (0.03) | ||||
| Reform | 0.00 (0.04) | 0.01 (0.03) | 0.00 (0.04) | −0.02 (0.03) | ||||
| Post-reform | 0.07† (0.04) | 0.07† (0.04) | 0.02 (0.03) | 0.04 (0.03) | −0.10** (0.04) | −0.10** (0.04) | 0.01 (0.03) | −0.01 (0.04) |
| Controls | ||||||||
| Gender | 0.04 (0.03) | 0.04 (0.03) | −0.01 (0.02) | −0.01 (0.02) | 0.07* (0.03) | 0.07* (0.03) | −0.10*** (0.03) | −0.10** (0.03) |
| Unmarried | 0.19 (0.14) | 0.19 (0.14) | −0.05 (0.12) | −0.05 (0.12) | −0.08 (0.14) | −0.08 (0.14) | −0.07 (0.13) | −0.07 (0.13) |
| Married | 0.25† (0.14) | 0.25† (0.14) | −0.05 (0.12) | −0.05 (0.12) | −0.27* (0.13) | −0.27* (0.13) | 0.07 (0.12) | 0.07 (0.12) |
| Education | 0.04* (0.02) | 0.04* (0.02) | −0.03† (0.01) | −0.03† (0.01) | 0.01 (0.02) | 0.01 (0.02) | −0.02 (0.02) | −0.02 (0.02) |
| Hukou | 0.06 (0.04) | 0.06 (0.04) | −0.05 (0.03) | −0.05 (0.03) | 0.06† (0.03) | 0.06† (0.03) | −0.07* (0.03) | −0.07* (0.03) |
| Intercept | −0.74*** (0.18) | −0.75*** (0.17) | 0.26† (0.15) | 0.25† (0.15) | 0.16 (0.17) | 0.15 (0.16) | 0.33* (0.16) | 0.35* (0.16) |
| R2 | 0.02 | 0.02 | 0.01 | 0.01 | 0.04 | 0.04 | 0.04 | 0.04 |
| F | 2.71** | 2.71** | 0.74 | 0.74 | 6.23*** | 6.23*** | 6.45*** | 6.45*** |
Table 6 Relationships between generational cohorts and work values (Cable and Edwards’s work values; Study 2)
| Variables | Open to change | Conservation | Self-enhancement | Self-transcendence | ||||
|---|---|---|---|---|---|---|---|---|
| Model 1 | Model 2 | Model 3 | Model 4 | Model 5 | Model 6 | Model 7 | Model 8 | |
| Generational cohorts | ||||||||
| Pre-reform | 0.00 (0.04) | −0.01 (0.03) | 0.00 (0.04) | 0.02 (0.03) | ||||
| Reform | 0.00 (0.04) | 0.01 (0.03) | 0.00 (0.04) | −0.02 (0.03) | ||||
| Post-reform | 0.07† (0.04) | 0.07† (0.04) | 0.02 (0.03) | 0.04 (0.03) | −0.10** (0.04) | −0.10** (0.04) | 0.01 (0.03) | −0.01 (0.04) |
| Controls | ||||||||
| Gender | 0.04 (0.03) | 0.04 (0.03) | −0.01 (0.02) | −0.01 (0.02) | 0.07* (0.03) | 0.07* (0.03) | −0.10*** (0.03) | −0.10** (0.03) |
| Unmarried | 0.19 (0.14) | 0.19 (0.14) | −0.05 (0.12) | −0.05 (0.12) | −0.08 (0.14) | −0.08 (0.14) | −0.07 (0.13) | −0.07 (0.13) |
| Married | 0.25† (0.14) | 0.25† (0.14) | −0.05 (0.12) | −0.05 (0.12) | −0.27* (0.13) | −0.27* (0.13) | 0.07 (0.12) | 0.07 (0.12) |
| Education | 0.04* (0.02) | 0.04* (0.02) | −0.03† (0.01) | −0.03† (0.01) | 0.01 (0.02) | 0.01 (0.02) | −0.02 (0.02) | −0.02 (0.02) |
| Hukou | 0.06 (0.04) | 0.06 (0.04) | −0.05 (0.03) | −0.05 (0.03) | 0.06† (0.03) | 0.06† (0.03) | −0.07* (0.03) | −0.07* (0.03) |
| Intercept | −0.74*** (0.18) | −0.75*** (0.17) | 0.26† (0.15) | 0.25† (0.15) | 0.16 (0.17) | 0.15 (0.16) | 0.33* (0.16) | 0.35* (0.16) |
| R2 | 0.02 | 0.02 | 0.01 | 0.01 | 0.04 | 0.04 | 0.04 | 0.04 |
| F | 2.71** | 2.71** | 0.74 | 0.74 | 6.23*** | 6.23*** | 6.45*** | 6.45*** |
| Variables | Pre-reforma | Reformb | Post-reformc | a vs. b | a vs. c | b vs. c | ||||
|---|---|---|---|---|---|---|---|---|---|---|
| M | SD | M | SD | M | SD | F(η2p) | F(η2p) | F(η2p) | F(η2p) | |
| Materialism and post-materialism work values | ||||||||||
| Materialism | 0.35 | 0.60 | −0.07 | 0.57 | −0.46 | 0.64 | 7.21*** (0.02) | 0.07 (0.00) | 7.42*** (0.02) | 14.81** (0.04) |
| Post-materialism | −0.35 | 0.60 | 0.07 | 0.57 | 0.46 | 0.64 | 7.21*** (0.02) | 0.07 (0.00) | 7.42*** (0.02) | 14.81** (0.04) |
| Cable and Edwards’s (2004) work values | ||||||||||
| Open to change | −0.46 | 0.68 | −0.07 | 0.53 | 0.41 | 0.56 | 4.51* (0.01) | 0.26 (0.00) | 5.30* (0.02) | 9.35** (0.03) |
| Conservation | 0.24 | 0.48 | −0.07 | 0.51 | −0.44 | 0.59 | 6.81** (0.04) | 0.14 (0.00) | 7.08* (0.02) | 12.58*** (0.03) |
| Self-enhancemnt | 0.01 | 0.58 | 0.18 | 0.44 | 0.21 | 0.48 | 1.58 (0.00) | |||
| Self-transcedence | 0.20 | 0.52 | −0.04 | 0.46 | −0.18 | 0.50 | 1.56 (0.00) | |||
Table 7 Work values of generational cohorts: means, standard deviations, and generational differences (Study 3)
| Variables | Pre-reforma | Reformb | Post-reformc | a vs. b | a vs. c | b vs. c | ||||
|---|---|---|---|---|---|---|---|---|---|---|
| M | SD | M | SD | M | SD | F(η2p) | F(η2p) | F(η2p) | F(η2p) | |
| Materialism and post-materialism work values | ||||||||||
| Materialism | 0.35 | 0.60 | −0.07 | 0.57 | −0.46 | 0.64 | 7.21*** (0.02) | 0.07 (0.00) | 7.42*** (0.02) | 14.81** (0.04) |
| Post-materialism | −0.35 | 0.60 | 0.07 | 0.57 | 0.46 | 0.64 | 7.21*** (0.02) | 0.07 (0.00) | 7.42*** (0.02) | 14.81** (0.04) |
| Cable and Edwards’s (2004) work values | ||||||||||
| Open to change | −0.46 | 0.68 | −0.07 | 0.53 | 0.41 | 0.56 | 4.51* (0.01) | 0.26 (0.00) | 5.30* (0.02) | 9.35** (0.03) |
| Conservation | 0.24 | 0.48 | −0.07 | 0.51 | −0.44 | 0.59 | 6.81** (0.04) | 0.14 (0.00) | 7.08* (0.02) | 12.58*** (0.03) |
| Self-enhancemnt | 0.01 | 0.58 | 0.18 | 0.44 | 0.21 | 0.48 | 1.58 (0.00) | |||
| Self-transcedence | 0.20 | 0.52 | −0.04 | 0.46 | −0.18 | 0.50 | 1.56 (0.00) | |||
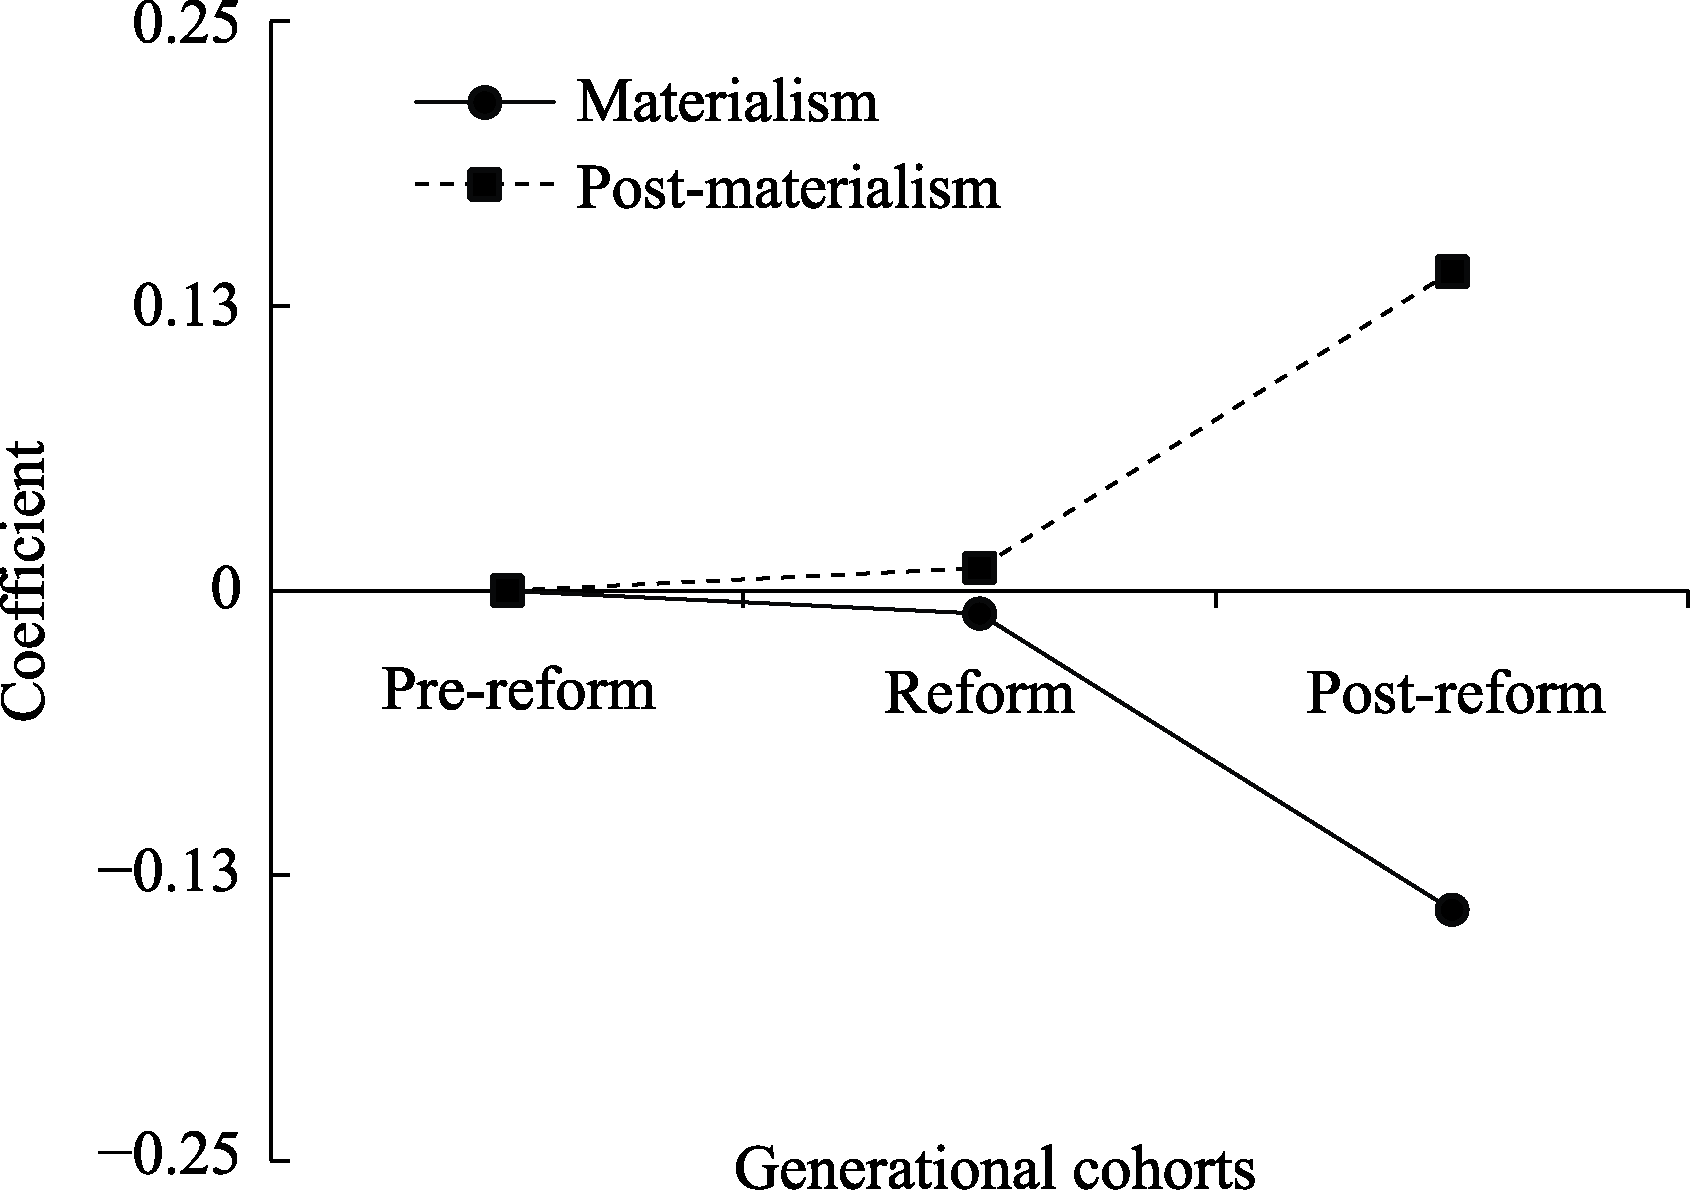
Figure 1. Generational difference in work values (Materialism and post-materialism work values; Using pre-reform as the reference group; Study 1).
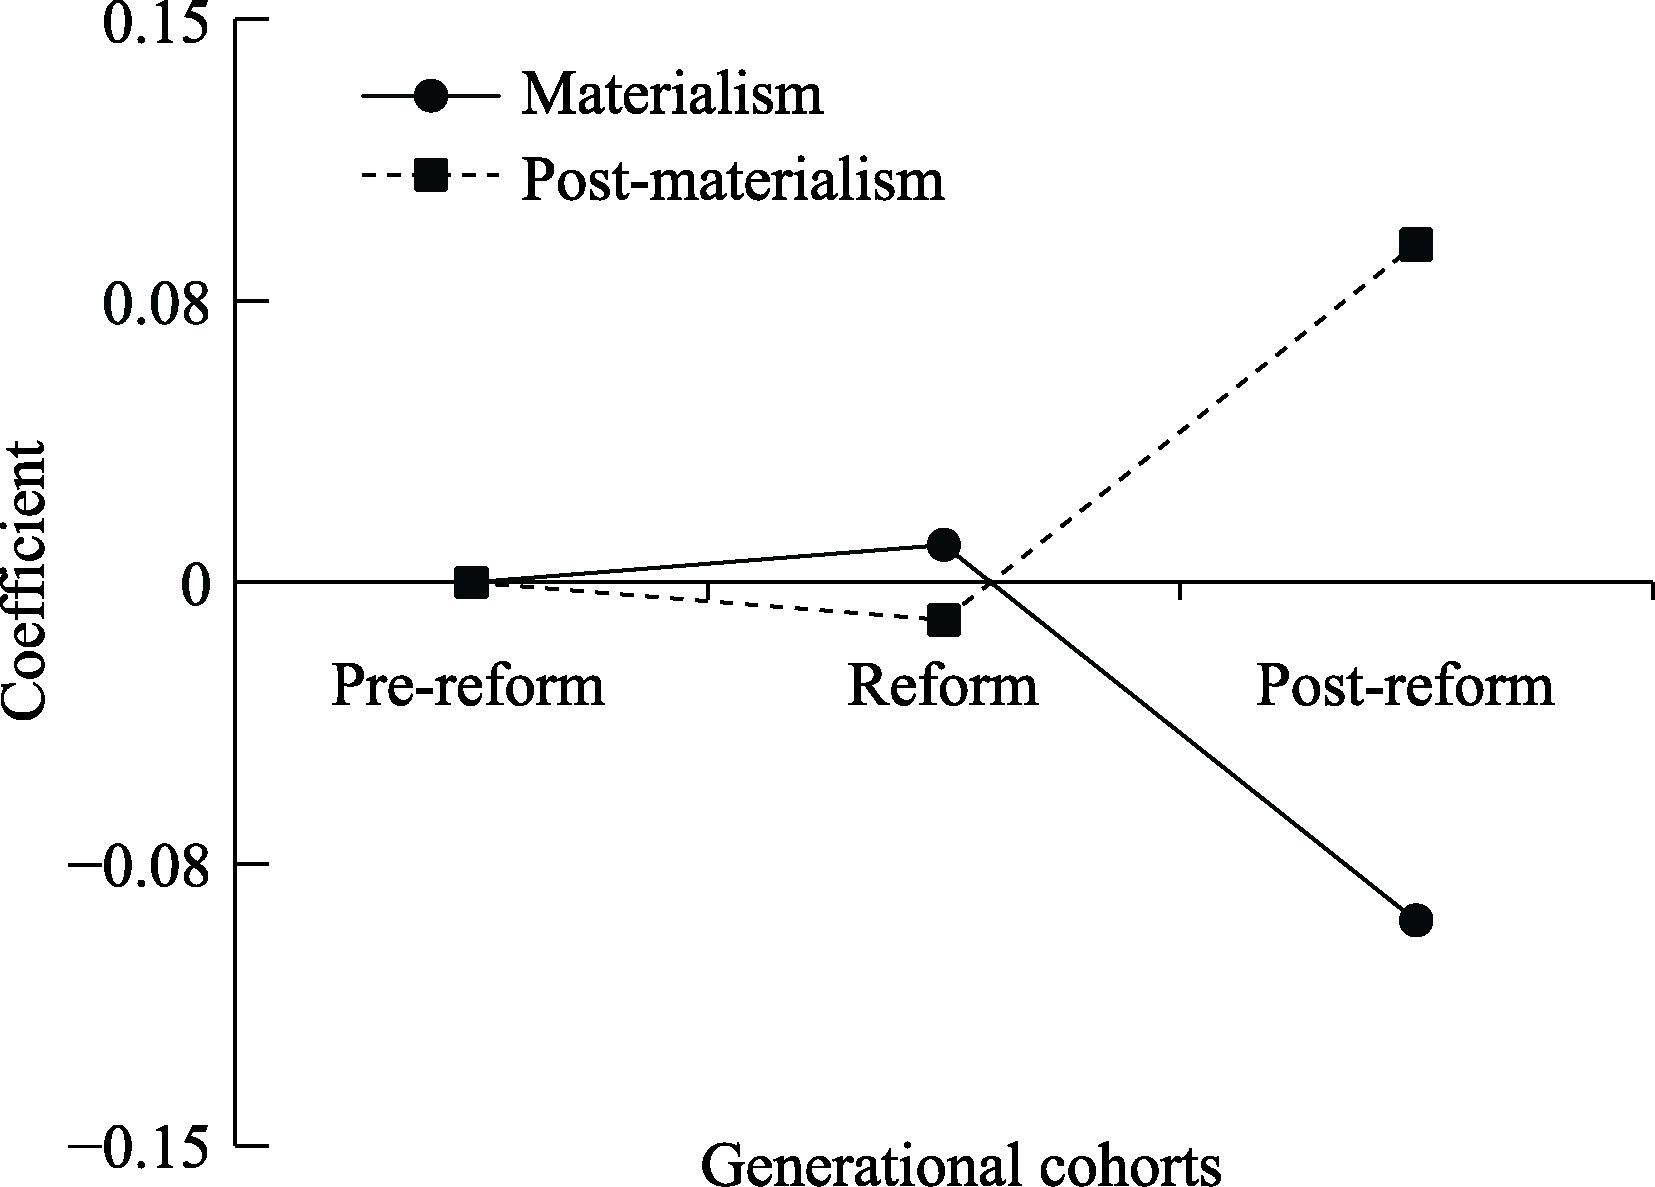
Figure 2. Generational difference in work values (Materialism and post-materialism work values; Using pre-reform as the reference group; Study 2).
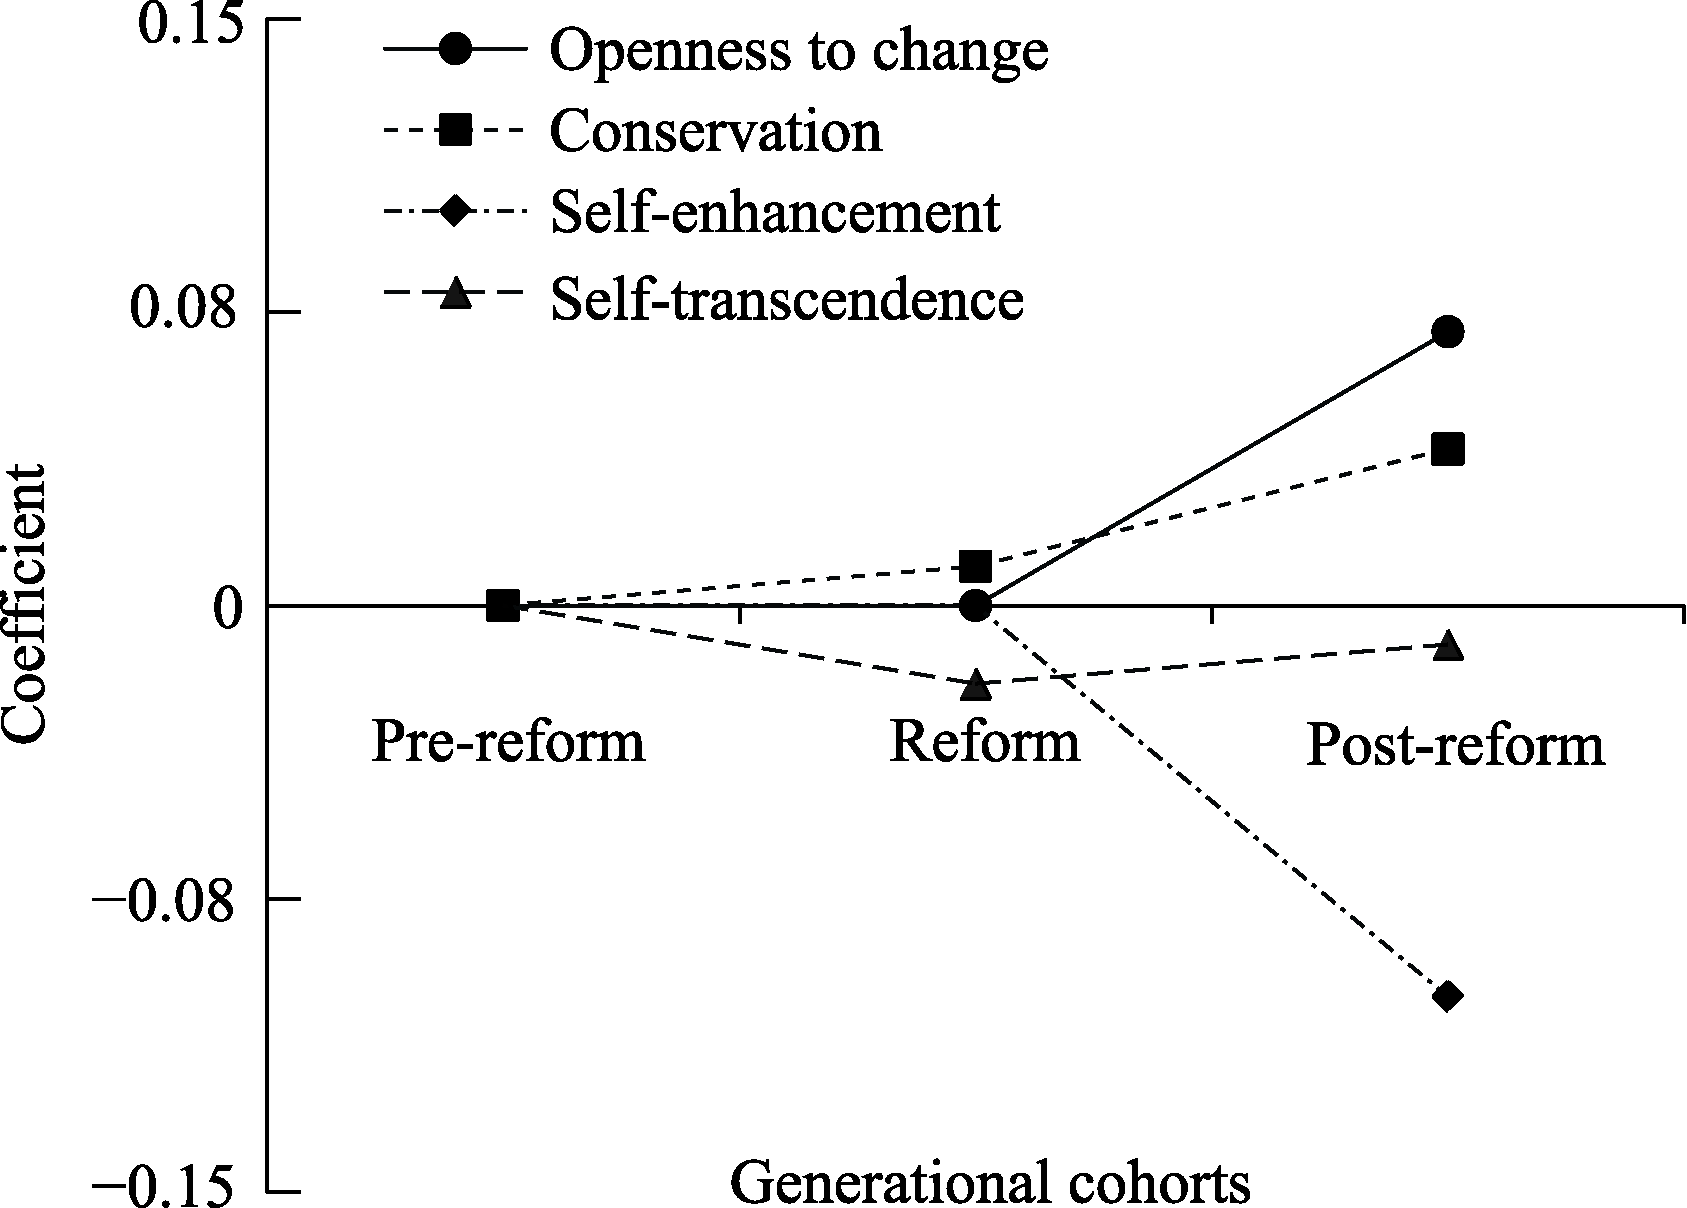
Figure 3. Generational difference in Generational difference in work values (Cable and Edwards’s work values; using pre-reform as the reference group; Study 2).
| No related articles found! |
| Viewed | ||||||
|
Full text |
|
|||||
|
Abstract |
|
|||||