Table 1 Means, Standard Deviations, and correlations among studied variables
| Variable | M | SD | 1 | 2 | 3 | 4 | 5 | 6 | 7 | 8 | 9 |
| 1 Team’s University background | 2.45 | 0.78 | | | | | | | | | |
| 2 Team’s Gender Composition | 1.11 | 0.17 | −0.07 | | | | | | | | |
| 3 Team Size | 3.92 | 0.75 | −0.31** | −0.05 | | | | | | | |
| 4 Teacher Contact Frequency | 3.69 | 0.74 | −0.11 | 0.02 | −0.08 | | | | | | |
| 5 Teacher Feedback Frequency | 3.56 | 0.81 | −0.06 | 0.03 | −0.17 | 0.83** | | | | | |
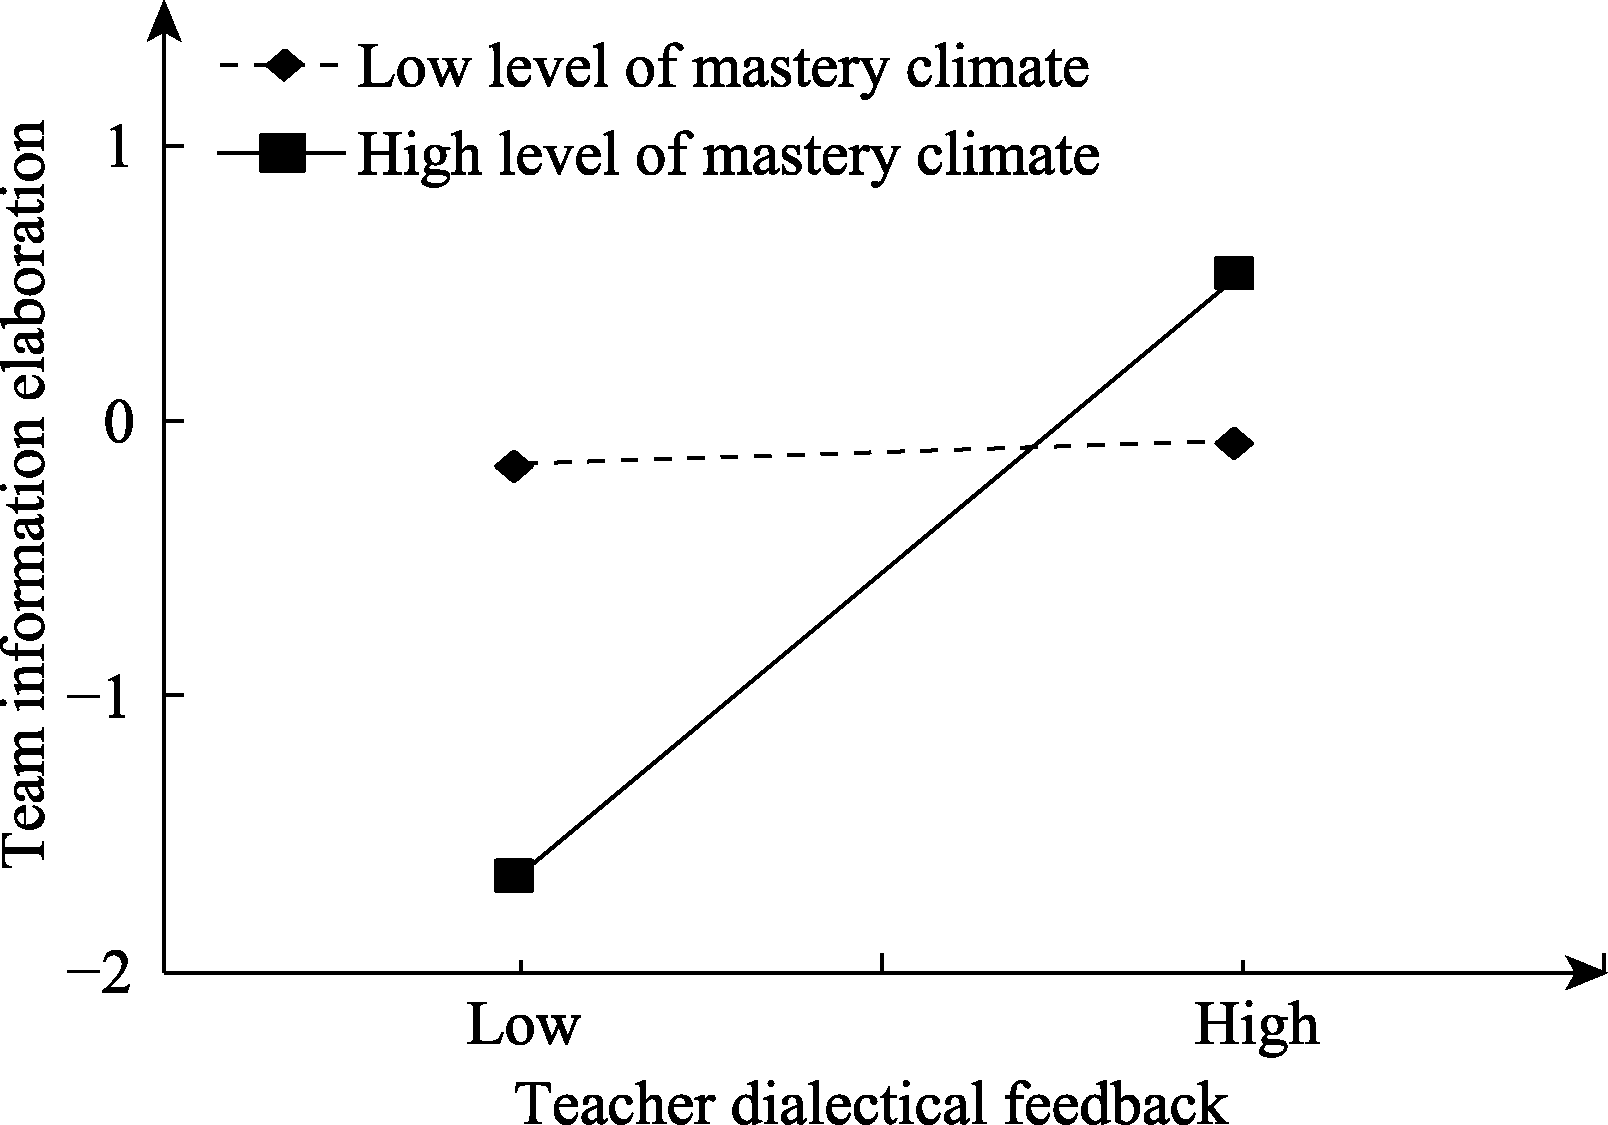
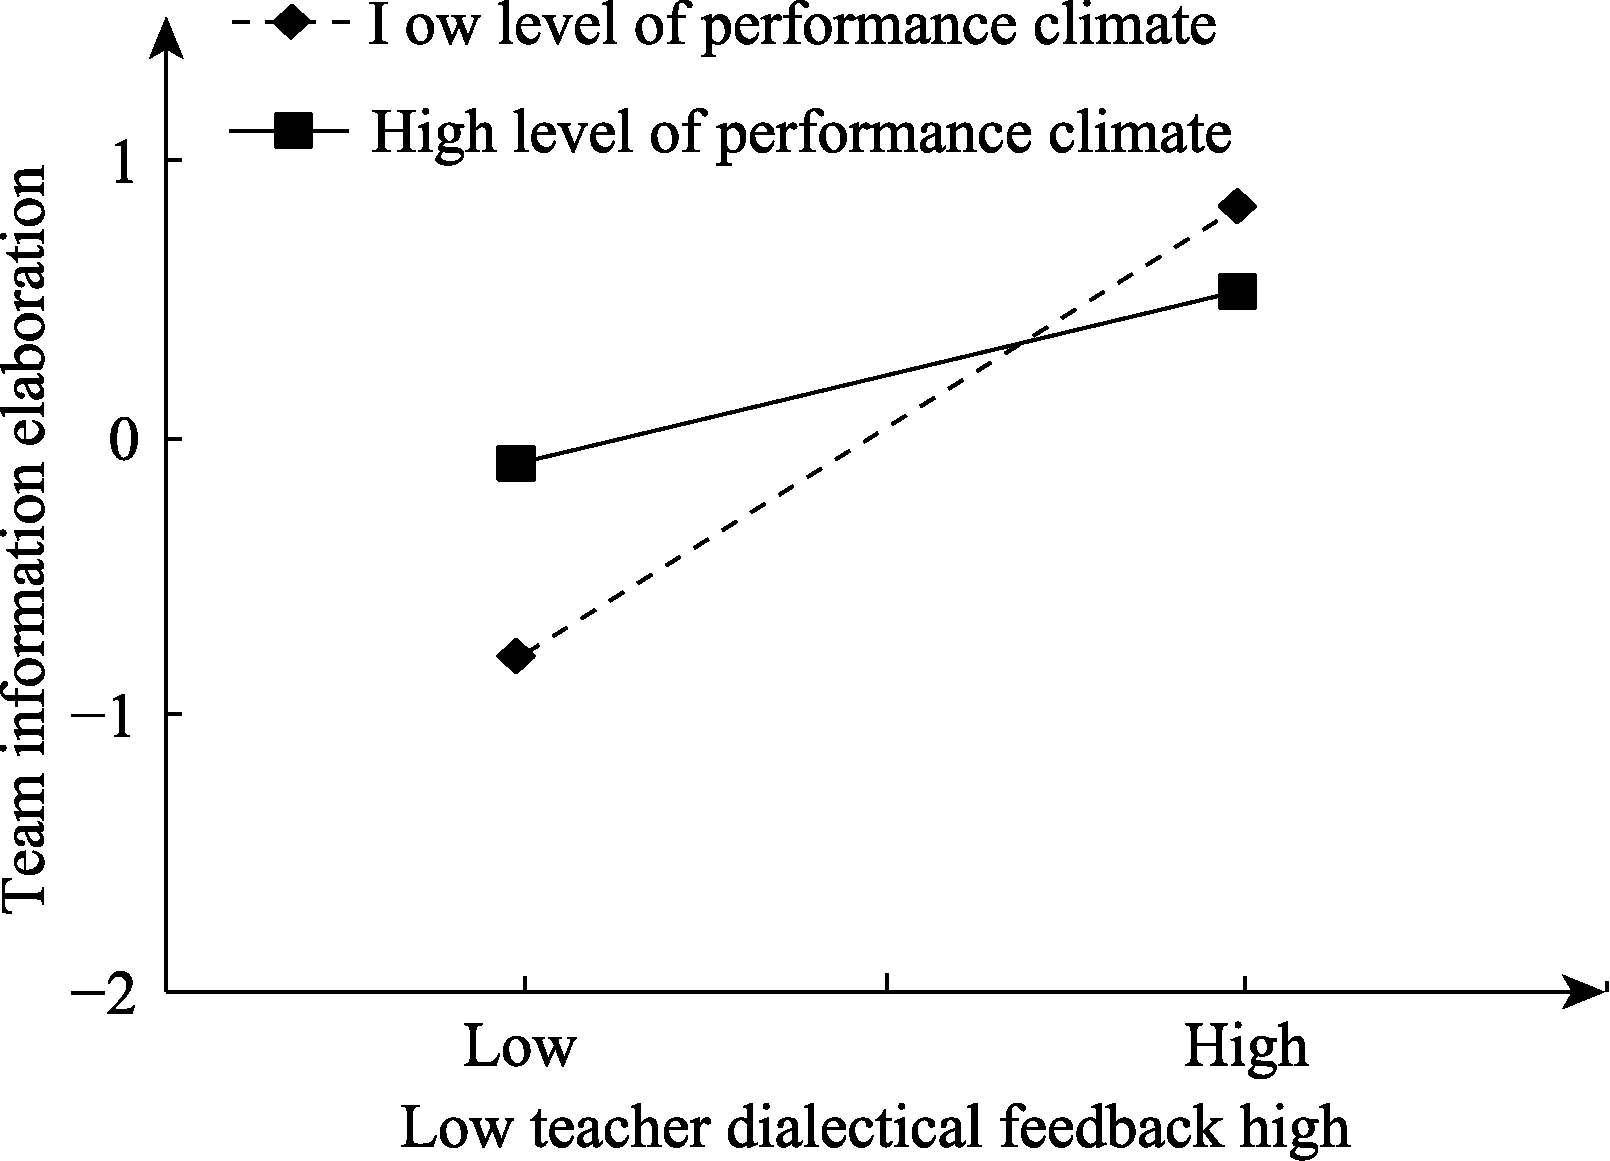
| 6 Teacher Dialectical Feedback | 4.09 | 0.67 | −0.22 | −0.05 | −0.18 | 0.64** | 0.66** | | | | |
| 7 Mastery Climate | 3.10 | 0.68 | 0.01 | −0.15 | 0.05 | 0.15 | 0.24* | 0.11 | | | |
| 8 Performance Climate | 3.90 | 0.49 | −0.22 | −0.21 | −0.05 | 0.20 | 0.29** | 0.41** | 0.28* | | |
| 9 Team Information Elaboration | 4.23 | 0.61 | −0.15 | −0.14 | −0.13 | 0.36** | 0.39** | 0.63** | 0.04 | 0.30** | |
| 10 Team Creativity | 4.17 | 0.46 | −0.16 | −0.21 | −0.15 | 0.34** | 0.46** | 0.69** | 0.19 | 0.45** | 0.82** |
 ), LI Linying3, LI Haihong4, HUA Weijun1