

1 引言
心理测验(Psychological Testing)发展百余年来, 已经被广泛应用于教育(Di Giunta et al., 2013)、企业管理(Schmidt, 2002)、临床医疗(Judd, Schettler, & Rush, 2016)等各个领域, 并发挥重要作用。但传统心理测验具有的一些不足之处使其在应用上面临挑战。首先, 传统心理测验由于采取明显的测验形式, 容易令个体产生测验焦虑, 而焦虑会显著降低受测者的外在表现, 使个体真实的能力水平被低估(Cassady & Johnson, 2002)。已有研究表明, 对测验成绩的焦虑会影响个体的注意(Keogh & French, 2001)、降低工作记忆表现(Ikeda, Iwanaga, & Seiwa, 1996)、降低智力测验表现并使得问题解决更加艰难(Cassady & Johnson, 2002)。更为严重的是, 这种由焦虑引起的不良测验成绩会反过来作用于个体自尊, 并直接导致恐惧、防御性与逃避性行为(Hembree, 1988), 对个体的长期发展十分不利。其次, 某些经典的心理测验已经被使用了很多年, 可能会导致测验的曝光效应, 从而无法评估个体的真实水平(Bors & Vigneau, 2003)。研究表明, 测验的频繁使用容易被人们破解所谓的“解题秘诀”, 个体可能事先获得题目和答案信息而使分数提高(Neisser, 1997), 或通过不断的备考和练习来提高测评结果(Bors & Vigneau, 2003), 但这并不能反映出受测者的真实水平, 反而会干扰真实的测量结果, 对测评的信效度造成污染(Neisser, 1997; Hausknecht, Halpert, Di Paolo, & Moriarty Gerrard, 2007)。
鉴于传统心理测验存在的问题, 研究者开始考虑采用其他形式和工具对个体能力和人格特质进行评估。近年来, 随着计算机网络的发展和电子游戏的普及, 基于游戏的评估方式渐渐流行起来。
基于游戏的评估(game-based assessment, GBA)是指:通过游戏(game)或者游戏化的活动(game-like activities), 来对某一对象进行评估(Heinzen, Landrum, Gurung, & Dunn, 2015)。从心理学的角度来说, 即采用游戏的方式, 对一个人的能力、人格等心理特性和行为进行量化评估。这里所说的游戏是指所有一般意义上的游戏, 既包括生活中诸如下棋、捉迷藏等真实游戏, 也包括模拟经营、伦敦塔、连连看等各类平台上的电子游戏(video game)。基于游戏的评估方法与传统的心理测验相比具有诸多优点。首先, 将心理评估游戏化意味着我们可以跳出传统纸笔测验及其变式, 创造出丰富而多样化的测验形式和内容, 例如:视觉运动技能(visuomotor skill)的测量已经可以通过手指与触屏的游戏式互动来实现(Tenorio Delgado, Arango Uribe, Aparicio Alonso, & Rosas Díaz, 2016)。其次, 游戏的可玩性、隐蔽性和仿真性等特点使得基于游戏的评估更易被人们接受, 其测验情境更接近于真实生活, 具有挑战性和交互式的特点, 能够极大程度地提高受测者的动机和投入程度, 并且还能通过降低社会称许性的影响(Heinzen et al., 2015), 在一定程度上避免传统心理测验中的测验焦虑和测验曝光问题。此外, 全新的测验形式意味着可以用不同以往的方式来收集数据。例如以电子游戏作为心理测评的载体, 可以通过计算机后台记录玩家的游戏任务操作过程(DiCerbo & Behrens, 2012)。对这些过程信息加以正确利用, 能够让研究者对个体的能力和特质有一个更为全面的了解, 也更有利于测验效度的提升, 使得心理学研究的重点从“结果是什么”转变为分析“怎样产生结果” (Greiff, Wüstenberg, & Avvisati, 2015)。目前, 基于游戏的评估得到了研究者的重视, 如Sonnleitner和Köstering等人分别利用基因实验室和伦敦塔游戏任务对个体的复杂问题解决和计划性等认知能力进行了评估(Sonnleitner et al., 2012; Köstering et al., 2015); Ventura和Baumert等人分别利用沙盒游戏和独裁者博弈游戏任务来评估个体的坚持性、公平性和利他性等人格特质(Ventura & Shute, 2013; Baumert, Schlösser, & Schmitt, 2014)。
然而, 目前基于游戏的评估在应用中也存在一些问题, 还没有在数据分析和计分逻辑中充分利用游戏的过程信息, 仅使用少数指标对某变量进行评估。例如Li, Zhang, Du, Zhu和Li (2015)通过推箱子游戏测量被试的元认知计划, 但仅记录并使用了第一步时间与总时间的比值, 以此作为评估指标; Berg和Byrd (2002)在使用伦敦塔游戏测量计划性时, 仅使用第一步移动前的时间作为评估指标。在上述研究中, 大量过程性信息被浪费, 而这些信息很可能隐藏着可以衡量个体特质或能力的指标, 如每一步思考的时间、动作的回溯等(Greiff et al., 2015), 因而无法对个体特质或能力进行全面完备的评估。
鉴于基于游戏的评估在应用中所存在的问题, 心理测评领域亟需一种有效的数据分析方法来处理这些问题, 以实现对个体能力和特质更为准确的评估。随着人工智能研究的兴起和发展, 机器学习已经成为一门集挑战性、实用性、价值性于一体的热门学科, 尤其是谷歌AlphaGo在人机大战中获胜的奇迹使得机器学习成为备受瞩目和极富发展前景的领域。目前, 已经有研究者将机器学习引入心理学领域, 并应用于人格预测(Wu, Kosinski, & Stillwell, 2015)。此外, Zhang, Song, Cui, Liu和Zhu (2016)根据人类步态可作为情绪识别的依据这一原理, 设计了内置加速度传感器的智能手环, 用于测量被试的情绪状态。研究首先对123名被试进行了情绪操纵和原始数据收集, 之后进行数据预处理和特征提取, 然后通过机器学习的方法对数据进行处理和建模, 结果发现机器学习的不同算法均能够较为准确地识别情绪(快乐、中性、愤怒), 尤其是LibSVM算法在区分中性和愤怒情绪上的准确率高达91.3%; 在进行三种情绪状态的区分上, 也达到了81.2%的准确率。
需要指出的是, 机器学习算法通常需要使用到大体量的数据, 计算机过程数据追踪技术—— log-file为此提供了实现可能。所谓log-file是指包含受测者所有活动足迹的日志文件, 其优点是能够全面、实时地记录全部数据, 信息量丰富, 有利于后期的数据挖掘和分析(Moharil et al., 2014)。这一技术不仅实现了对研究变量的在线测量, 而且避免了传统方法中数据收集工作耗时费力的缺陷, 可在大规模施测的同时无干扰地记录被试的真实行为。近年来, 采用基于计算机网络平台的游戏log-file方式对变量进行研究已经成为心理学领域的新趋势, 如Sonnleitner等人(2012)开发的游戏任务, 会在计算机后台生成log-file文件, 但遗憾的是他们并没有充分利用log-file信息, 只是选取了少数几个指标用于评估受测者的复杂问题解决能力。这其中的主要原因在于数据挖掘本身的困难。log-file数据通常变量众多、数量巨大, 从这些数据中找出有意义的信息和关系是比较困难的(Csapó, Ainley, Bennett, Latour, & Law, 2012)。也正因为如此, 机器学习技术可以在这类研究中体现出独特的优势, 能够通过充分利用log-file的信息, 建立较为复杂的模型, 实现更为准确的预测。
基于上述分析, 本研究拟采用游戏任务, 并结合log-file技术和机器学习技术, 尝试对个体的能力倾向(aptitude)和学业成就(achievement)两类能力进行预测, 在操作层面将以抽象推理能力和数学学习成绩作为研究变量。之所以选择这两类能力, 是因为能力倾向和学业成绩均是学生求学生涯中的重要变量, 前者能够反映出个体在广泛的信息加工任务中的潜能, 后者则是学习结果的主要表现, 对学生自我概念的建构、思维能力的发展以及社会适应的培养等方面都具有显著的影响(Duncan et al., 2007)。研究拟选取“推箱子”作为游戏任务。在该游戏中, 受测者需要调用其认知和元认知加工, 持续对箱子的位置和小人的移动路线进行思考, 涉及到大量的抽象推理、空间想象与操作, 以及数字运算工作, 因此, 受测者在游戏过程中的表现很有可能能够反映其推理能力和数学学业成就的水平。由于从游戏log-file中收集到的原始数据并不规范, 不能直接作为特征加入模型中, 因此需要研究者进行特征提取, 从而生成有可能反映受测者能力的特征。以往关于推箱子的研究涉及到认知能力、元认知能力、认知效率三种指标(张博, 黎坚, 徐楚, 李一茗, 2014)。本研究在选取特征时虽然也将从这三个方面进行考虑, 但会选取更多特征, 通过增加特征数量使模型的预测率更高。例如在认知能力方面, 拟选取完成箱子比例、关卡是否成功等特征; 在元认知能力方面, 拟选取第一步计划时间与总时间的比值、第一步计划时间与平均执行时间的比值, 以及二者的对数等特征; 在认知效率方面, 拟选取思考步数、与最优步数之差等特征。此外, 考虑到受测者在“成功”的关卡与“失败”的关卡中可能存在不同的表现, 因此在特征选取时对两种通关情况也进行了区分。
2 方法
研究包含4个步骤:数据采集、特征提取、数据预处理和模型训练。
2.1 数据采集
2.1.1 被试
首都师范大学第一附属中学的395名初一和初二学生参加了研究, 有效被试为360名, 其中女生172名, 男生188名。初一学生平均年龄为13.2岁, 最小为11.9岁, 最大为15.1岁; 初二学生平均年龄为14.6岁, 最小为14.1岁, 最大为16.3岁。
2.1.2 推箱子游戏
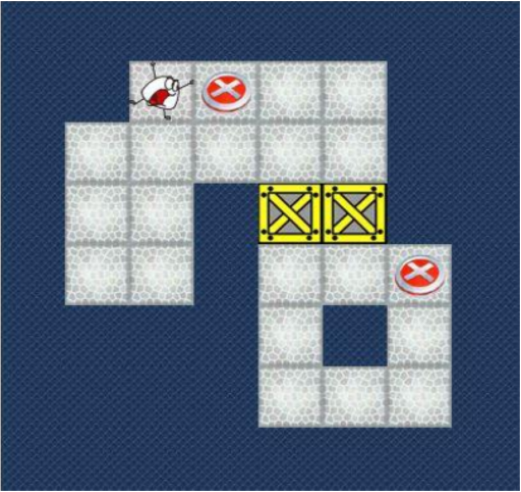
推箱子(Sokoban)是一款经典益智游戏, 由一个小人和至少1个箱子组成, 玩家需要操纵小人上下左右移动, 将箱子推入目标位置。经过研究者对程序的改编, 计算机后台可以自动生成log-file文件, 记录受测者每一步的潜伏期与按键动作, 例如时间节点、小人移动的方向、推动的箱子、完成步数等。游戏一共23题, 所有题目都不允许悔棋。前3题为练习题, 用于帮助受测者熟悉键盘操作及游戏规则。在练习题阶段, 答错可重来, 直到全部通过方可进入正式游戏。第4~23题为正式题目, 每题限时2 min。与练习阶段不同, 正式题目只有一次机会, 若一次未通过, 则只能放弃该题。正式题目中的箱子个数在1~3之间, 每题均有唯一最优解。游戏界面如图1所示。
图1
2.1.3 测量工具
瑞文标准推理测验(Standard Progressive Matrices, SPM; Raven, 1989):用于测量一般智力中的抽象推理能力, 共计60个条目, 每答对一题计一分, 满分60分, 总分即为推理能力得分。在本研究的受测者中, 平均分为46.2, 标准差为8.5。
数学成绩:研究者获得了学生的三次数学测验的成绩(期中、月考、期末), 每次数学测验均为年级内统一施测, 因此在年级内具有可比性。将三次数学成绩取平均值以获得对学生数学能力较为准确的估计。本研究中, 数学成绩的平均分为64.9分, 标准差为19.9。
本研究属于机器学习中的监督学习(supervised learning)类别, 而监督学习分为两种, 一是利用分类算法预测标称型数据, 二是利用回归算法预测连续型数据。对于本研究而言, 推理能力和数学成绩是连续型数据, 理论上应使用回归算法进行预测, 但是回归算法对特征数量和样本量的要求较高, 其创建的模型需要拟合所有的样本点, 当数据拥有众多特征且特征之间的关系十分复杂时, 构建全局模型难以实现(Harrington, 2013)。囿于现实因素, 研究无法获取更多受测者, 且众多特征间的关系较为复杂, 坚持使用回归算法将无法达到良好的预测效果。因此, 作为一项尝试性研究, 本研究在数据分析中将两个结果变量转化为标称型数据, 具体做法是:将瑞文推理测验得分在前25%的学生记为1, 后25%得分的学生记为0, 构造瑞文得分的二分变量作为最终结果变量(即机器学习算法的标签), 其他学生的数据不予使用, 最终有效的受测者是180名; 将数学成绩按照年级分层, 将每个年级数学成绩排名前25%的学生标记为1, 后25%的学生标记为0, 构造数学成绩的二分变量作为最终结果变量, 其余学生的数据不予使用, 最终有效受测者也为180名。
2.1.4 测试流程
所有学生均以班级为单位在计算机教室参加测试。受测者首先在计算机上完成推箱子游戏任务, 然后填写纸质版的瑞文推理测验。施测过程都由任课教师、班主任和主试一同监督, 保证安静、独立作答。
2.2 特征提取
程序记录的受测者顺利通过某一关的典型数据形式如图2所示。通常, 在第一步之前会有较长时间的思考, 在思考完成后则有较快的按键反应, 在操作过程中, 偶尔会出现潜伏期。除了过程数据外, 程序同样记录了受测者在本关是否通过、有几个箱子被移到了指定位置、受测者是否主动放弃本关、任务超时等信息。下面将对特征提取的具体方法进行说明。
图2

2.2.1 第一步所用时间
由图2可知, 受测者通常会分配较长时间在第一步之前的思考中。参照文献, 我们计算出受测者在每一关中第一步所用时间占总时间的比重。此外, 用第一步时间除以平均执行时间(定义方法见2.2.3)以及对上述变量取其对数形式, 构造出多个特征以进行较为全面的衡量。
2.2.2 执行间思考
受测者在执行过程中可能会停下来思考, 反映在数据中即是:在执行过程中某一步用时较其他时间异常变高。为了反映这种波动性, 计算受测者除了第一步之后各步用时的标准差, 即执行间波动, 同时, 记录时间超过平均值一个标准差以上的步数占总步数的比例作为受测者在执行过程中的思考次数的指标。
2.2.3 平均执行时间
剔除掉包含思考的行动后(包括第一步), 将余下的行动时间求平均。这部分时间反映了受测者在无需思考的情况下执行操作的时间。
2.2.4 冗余步数
根据受测者的行动路线可以求出受测者每一步行动后的整体状态。计算出其路径中重复的状态(即在两个状态中, 小人和所有箱子的位置完全相同)占最优路径中总状态数的比例。其中, 对于一个状态重复多次的情况只记为1, 以避免玩家在两个状态间“来回踱步”产生误差。
2.2.5 与最优路径重合比例
通过广度优先搜索算法, 可以求出每一关的最优路径, 并计算受测者的路径与最优路径重合的比例。具体而言, 计算受测者路径的状态集合与最优路径状态集合的交集, 计算交集占最优路径状态集的比例, 同样排除掉“来回踱步”的情况。
2.2.6 与最优路径相差步数
受测者步数与最优步数的差异, 也作为一个指标加入模型中。
2.2.7 完成箱子的比例
所有关卡中, 程序都会报告受测者完成的箱子数量占总箱子数量的比例, 把它作为一个特征加入到模型中。
2.2.8 每题是否成功、放弃
每道题有三种状态, 成功通过、放弃、超时, 用两个二分变量来刻画这三种情况, 并作为特征加入模型中, 即对于“是否成功”这一特征来说, 成功记为1, 放弃记为0, 超时记为0; 对于“是否放弃”这一特征来说, 成功记为0, 放弃记为1, 超时记为0。
2.3 数据预处理
原始数据以每一关为一个观测值, 但在训练模型时需要以受测者为单位的观测值。直接将长型数据转换为宽型数据, 即对于每个受测者每一关都提取出上述特征, 总共特征数是单关特征数的20倍, 这会存在以下问题:一, 由于样本规模不大, 特征过多不利于模型训练, 容易过拟合; 二, 同一个指标在成功和失败两种状态下可能有不同的意义, 以“与最优路径相差步数”这一特征为例, 失败的状态下, 受测者的步数通常会低于最优路径步数, 数字越大表明受测者越坚持, 而在成功的状态下, 数字越大则反应受测者的步数偏离最优路径越远。为了克服以上问题, 将上述特征均以成功与否划分为两组, 即对于以上每个特征, 都构造出两类:一类用于描述该特征在成功的关卡中对推理能力和数学成绩的预测能力, 另一类描述在失败的关卡中对二者的预测能力。对于是否成功、是否放弃两个二分变量, 直接在各组间求平均容易忽略掉每道题的难度信息, 故使用因子分析从其中提取出两个因子作为特征用以训练模型。因此, 模型中共放入23个特征用于训练, 特征的描述统计结果见表1。
表1 特征的描述统计结果
| 特征 | 平均值 | 标准差 | 最小值 | 最大值 |
|---|---|---|---|---|
| 失败组 | ||||
| 第一步用时/平均执行时间 | 22.71 | 24.26 | 2.52 | 198.34 |
| ln (第一步用时/平均执行时间) | 2.31 | 0.82 | 0.81 | 4.97 |
| 完成箱子的比例 | 0.33 | 0.08 | 0.00 | 0.57 |
| 第一步用时/总时间 | 0.22 | 0.12 | 0.04 | 0.76 |
| ln (第一步用时/总时间) | -1.92 | 0.60 | -3.31 | -0.29 |
| 思考步数占比 | -2.39 | 0.23 | -3.04 | -1.69 |
| 平均执行时间 | 0.64 | 0.15 | 0.37 | 1.33 |
| 执行间波动 | 2.15 | 1.20 | 0.35 | 10.52 |
| 重复步数占比 | 0.07 | 0.03 | 0.00 | 0.20 |
| 与最优步数相差 | -5.75 | 9.45 | -23.36 | 65.78 |
| 与最优路径重合步数占比 | 0.17 | 0.04 | 0.04 | 0.32 |
| 成功组 | ||||
| 第一步用时/平均执行时间 | 24.36 | 23.81 | 2.65 | 168.97 |
| ln (第一步用时/平均执行时间) | 2.49 | 0.78 | 0.92 | 4.95 |
| 第一步用时/总时间 | 0.25 | 0.14 | 0.04 | 0.77 |
| ln (第一步用时/总时间) | -1.77 | 0.61 | -3.18 | -0.27 |
| 思考步数占比 | -2.61 | 0.27 | -3.53 | -1.64 |
| 平均执行时间 | 0.48 | 0.11 | 0.33 | 1.18 |
| 执行间波动 | 1.17 | 0.76 | 0.20 | 5.43 |
| 重复步数占比 | 0.03 | 0.02 | 0.00 | 0.16 |
| 与最优步数相差 | 7.65 | 5.45 | 0.00 | 52.67 |
| 与最优路径重合步数占比 | 0.71 | 0.14 | 0.17 | 1.06 |
注:因子分析抽取出的两个因子不具有平均数、标准差等描述性统计含义, 故未放在表格中。
研究者计算了上述特征与瑞文测验成绩和数学成绩的相关, 结果发现成功组和失败组的第一步用时/总时间、ln (第一步用时/总时间)、第一步用时/平均执行时间、ln (第一步用时/平均执行时间)等特征均与瑞文测验成绩和数学成绩有显著相关, 相关系数在0.19~0.46之间。此外, 数学成绩还与失败组思考步数占比、失败组完成箱子的比例显著相关, 相关系数分别是0.16和0.17。这些结果初步表明了本研究特征选取的有效性。
2.4 模型训练
推理能力与数学成绩的模型训练策略一致, 使用基于Python 3的scikit-learning包(Pedregosa et al., 2011)提供的随机森林模型进行训练, 该算法是分类学习的常用算法。随机森林(Random Forests, RF)是决策树的集合, 利用多棵树对样本进行训练和评估。该算法会重复选择随机样本, 在训练集中生成多个样本集, 每个样本集都会形成一棵树, 最后根据生成的这些树在测试集中进行评估, 投票最多的作为最终类标签(Breiman, 2001)。
研究中, 首先随机划出30%的样本作为评估集, 70%的样本用于交叉验证以及超参数搜索。在70%的样本中, 使用4折交叉验证策略将样本再次随机分成4组, 依次选择其中一组作为验证集, 其他三组作为训练集。在训练集上训练特定参数的模型, 将获得的模型在验证集中测试, 计算模型得分。4个轮次后, 每组样本均有3次作为训练集, 1次作为验证集, 将4组中获得的得分求平均, 为对应超参数的模型在交叉验证组中的得分。
随机森林模型具有多个参数可供调整, 不同的参数设置会影响模型的拟合效果。本研究关注的主要参数为:最大特征数、最大深度、最小分裂样本量、拟合器数量。最大特征数表示在寻找一个最优的分裂过程中需要考虑的特征数; 最大深度表示一个决策树最大的深度, 达到该深度后即停止分裂; 当一个节点上的样本量低于最小分裂样本量时该节点即停止分裂; 拟合器数量是指在随机森林中的树的数量。采用网格搜索的策略寻找出最优的参数, 对每一种超参数组合都进行一次交叉验证, 选择出交叉验证中平均得分最高的超参数组合。搜索的范围为:最大特征数由5至16, 最小分裂样本量由2至10, 最大深度由2至8, 拟合器数量包括5、10、50、160四种, 因此总共需要进行3024次交叉验证。经过3024次交叉验证后, 在验证集上得分最高的超参数组合即为最优参数组合。但是通过交叉验证获得的得分并不能准确评估该模型的有效性, 这是因为超参数搜索本身也相当于拟合的过程, 容易出现过拟合。因此对于该模型的评估需要在评估集上测试。首先, 使用获得的最优参数, 用交叉验证中涉及的所有70%的样本对随机森林模型进行拟合, 再用拟合后的模型以及评估集中的特征对推理能力分类和数学成绩分类进行预测, 用预测得到的分类与真实分类作比较, 计算得分。由此得到的得分是对模型预测能力比较准确的评估。
分类模型建立后, 可以用多种评估方式考察模型的预测效果, 主要可以分为4类:真实阳性(True Positive), 即预测为阳性且实际上也为阳性; 虚假阳性(Fake Positive), 即预测为阳性但实际上为阴性; 真实阴性(True Negative), 即预测为阴性实际上也为阴性; 虚假阴性(Fake Negative), 即预测为阴性但实际上是阳性。每种类别的表示方式如表2所示。
根据上述分类可以得到最常用的指标:
(1) 精确率(Accuracy):精确率是最为简单、直接的一个指标, 为正确预测的观测值数量除以总观测值数量, 即(TP+TN)/(TP+TN+FP+FN);
(2) 查准率(Precision, P):查准率描述在预测为阳性的样本中, 真实阳性的比例, 即TP/(FP+TP);
(3) 查全率(Recall, R): 查全率描述在所有实际阳性样本中, 预测为阳性的比例, 即TP/(TP+FN);
(4) F1:查准率与查全率两者显然是存在一些矛盾:追求查准率则会牺牲一些查全率, 反之亦然。F1则是查准率与查全率两者之间较为平衡的一个指标, 公式为F1 = 2RP/(R+P)。
在超参数搜索中, 分别以4种计分方式为目标, 即对应每个计分方式均找到一个能使其最大化的超参数组合, 以满足不同的预测需要。
3 结果
通过对模型的调整可以发现一个模型中所有特征的平均重要性, 特征重要性定义为:标准化后的特征减少的基尼不纯度(Tan, Steinbach, & Kumar, 2006)。图3显示的是数学成绩预测模型中排列前十的特征(推理能力预测模型与此类似), 可见, 第一步时间与平均执行时间的比值取对数(成功组)在数学成绩预测模型中的平均重要性最高; 第二重要的特征是从成功与否指标中通过因子分析提取出来的第一个因素; 与最优解相差的步数、思考时间占比、执行间波动、重复步数占比等因素均对模型有一定贡献, 证实了研究所提取的特征的有效性。
图3

通过对上文所述的特征进行训练, 所得模型在评估集上的表现如表3所示。第一列表示在超参数搜索时评估模型使用的标准, 即最优化目标, 其他四列表示相应的模型在评估集上相应指标的得分。结果表明, 在超参数搜索阶段采用不同的最优化目标对结果的影响不大。用该模型预测数学成绩, 能够达到80%左右的查准率, 而F1、查全率、精确率都在70%左右; 对于推理能力的预测结果稍弱于对数学成绩的预测, 平均能达到65%左右的F1, 75%左右的查准率, 60%左右的查全率, 以及65%左右的精确率。该结果表明机器学习建立的区分模型结果尚可接受。
表3 模型预测结果
| 最优化目标 | F1 | 查准率 | 查全率 | 精确率 |
|---|---|---|---|---|
| 推理能力 | ||||
| F1优先 | 68.83% | 74.40% | 61.19% | 63.46% |
| 查准率优先 | 63.72% | 75.51% | 59.17% | 65.03% |
| 查全率优先 | 65.01% | 74.91% | 63.10% | 64.21% |
| 精确率优先 | 64.22% | 76.11% | 59.05% | 65.72% |
| 数学成绩 | ||||
| F1优先 | 71.14% | 79.35% | 71.11% | 68.02% |
| 查准率优先 | 75.57% | 83.07% | 73.33% | 73.70% |
| 查全率优先 | 73.09% | 81.06% | 71.78% | 70.62% |
| 精确率优先 | 71.65% | 80.19% | 69.67% | 69.44% |
4 讨论
本研究尝试从推箱子的log-file数据中挖掘信息, 并使用随机森林模型预测学生的推理能力分类以及数学成绩分类, 模型预测的推理能力达到了约75%的查准率以及65%左右的精确率; 预测数学成绩达到了约80%的查准率以及70%左右的精确率, 结果说明模型预测效果尚可, 表明游戏log-file结合机器学习能够训练出较好的区分模型用以预测个体的抽象推理能力和学业成就。
4.1 过程性数据的利用
研究通过从log-file的过程性数据中提取多个特征, 一方面部分支持了以往研究的结果, 另一方面也完善了前人研究中特征利用不充分的不足。
首先, 本研究发现, 计划性指标(即第一步所用时间占全部时间的比值)在推理能力和数学成绩的区分模型中均占有重要地位, 且成功组的比值大于失败组, 说明事先计划对于开展逻辑推理类任务至关重要。无论是在完成图形推理题目, 还是在回答数学试题方面, 对题目或任务的计划会在一定程度上决定最终的结果, 这与以往研究相一致(Li et al., 2015)。
其次, 以往使用推箱子的研究没有区分受测者在题目上成功和失败两种情况, 而同一特征在两种情况下可能代表不同的含义, 这样做会浪费特征本身具有的价值。本研究在获取大量过程性数据的基础上, 对特征在成功或失败情况下进行了分解, 以便充分利用每个特征。结果发现, 同一特征在不同情况下的贡献确实存在差异。例如, 在数学成绩预测模型中, ln (第一步用时/平均执行时间)这个特征在成功和失败情况下均对模型有贡献, 但前者的贡献要大于后者; 在模型贡献排名前十的特征中, 失败情况下有较强预测效果的是“与最优步数差”、“执行间波动”、“重复步数占比”、“与最优路径重合比例”等特征; 而成功情况下有较强预测效果的是“思考步数占比”、“与最优步数差”、“ln (第一步时间/总时间)”等特征。
4.2 机器学习算法的预测效果
对于推理能力和数学成绩这两个结果变量来说, 使用随机森林所建立的区分模型在预测效果上存在一定差异。具体而言, 数学成绩的区分模型能够达到83.07%的查准率, 而对于推理能力的区分模型, 最高能达到76.11%的查准率。该结果一方面说明本研究中的随机森林模型在查准率指标上达到了较为一致的最优预测效果, 另一方面说明从推箱子任务中提取的现有特征更适用于预测数学成绩。这可能是因为, 瑞文推理测验以测量抽象推理能力为主, 相对来说对能力的要求比较单一; 但数学考题涉及的认知和元认知能力更加广泛, 包括对数量关系的梳理、空间图形的表征、使用策略的选择等, 这与推箱子游戏的问题解决过程更为相似。
在模型训练中, 使用不同的最优化目标会对模型预测结果产生一定影响。对于推理能力, 采用精确率优先条件时会得到最高的预测查准率; 对于数学成绩, 采用查准率优先条件时会得到最高的预测查准率。说明对于不同的结果变量, 不同的最优化指标会产生不同的结果, 基本不存在可以同时适用于多个变量的模型。在不同的模型中, 参数、最优化指标会有所不同, 最后的结果也会呈现一定的差异。机器学习的好处就是可以通过不断的调配参数来获取对结果变量最为有效的预测性, 选择具有最优预测效果的模型。
4.3 游戏log-file和计算机技术在心理测量中的应用
随着信息技术的发展, 计算机过程数据分析技术(computer logfiles analysis)在心理测量领域的地位不断提升。计算机过程数据分析技术是指通过追踪、分析受测者在计算机上完成任务过程中的操作行为、操作时间等信息来提取测量指标(Veenman, Bavelaar, De Wolf, & van Haaren, 2014)。该技术相较于传统的技术有诸多显而易见的优点。首先, 传统的测量方法基于被试的自我报告, 或者基于主试对于被试行为的编码, 而过程数据的分析依赖于客观指标, 能够更好地实现标准化(Veenman, Wilhelm, & Beishuizen, 2004); 其次, 传统的测量方法, 尤其是在测量认知能力时, 会有较强的侵入性, 如观察、出声思考技术(Pressley & Afflerbach, 1995)等, 在这些条件下受测者完成任务的能力一定程度上会受到影响; 而过程数据分析则不具有侵入性, 受测者完成任务的过程中不会受到打扰, 能够在最自然地状态下表现(Veenman et al., 2014); 最后, 过程分析技术成本较低, 可以对多个受测者同时施测, 数据分析通过计算机自动化完成, 因此相较于传统的测量技术如出声思考法以及眼动追踪技术(Kinnunen & Vauras, 1995)等更加省时。由于大量的过程数据无法用传统统计方法进行分析, 因而需要机器学习算法的引入和使用。这些优点使得游戏log-file、计算机过程数据分析技术、机器学习将在未来得到更多的发挥空间。
4.4 研究意义与局限性
研究利用推箱子游戏获取的log-file信息, 并使用机器学习算法, 建立了较为有效的区分模型, 初步实现了对学生的能力倾向和学业成就的预测, 结果可以为其他心理学和教育学的测评工作提供借鉴。
同时, 本研究也存在一定局限性。首先, 特征提取和模型建立过程的样本仅包含测验得分排在前25%与后25%的受测者, 两个群体间能力差异较大, 在这种情况下, 80%的查准度并不完美, 并且如果未来的研究目标转化为对连续变量进行预测时, 预测的难度会进一步提高; 其次, 虽然目前基于推箱子游戏的过程数据建立的模型可以较好地预测个体在瑞文推理测验和数学测验上是否成功, 但实际上我们对推箱子这一游戏任务本身到底涉及到哪些认知加工过程并不完全清楚, 因此并不能直接用模型预测的分数代替瑞文推理测验成绩或数学测验成绩。在之后的研究中, 可以考虑从以下几个方面进行改进。第一, 增大样本量。由于本研究在模型训练中使用的样本量低于200, 为了避免过拟合, 必须减少特征数量, 因而限制了模型的拟合能力。未来研究如果能够收集到足够大的样本量, 则可以使用更多的特征, 从而提高模型的预测能力。第二, 增大受测者在所预测能力上的异质性。本研究采用的样本均来自于同一所中学, 受测者的抽象推理能力相对来说具有较强的同质性, 这将增大模型预测的难度。未来研究如果能在不同的地区(城市、农村)、不同水平的学校(重点、普通)取样, 也可能会提高模型的预测能力。第三, 提取更多的特征并尝试其他算法。相对于以往研究, 本研究从推箱子游戏的过程数据中提取了更多样化的指标, 包括重复状态比例、思考次数等, 但log-file中仍有很多信息可以被挖掘。未来的研究可以尝试提取和检验更多的特征, 并可考虑采用机器学习中的回归算法对能力倾向和学业成就进行预测。第四, 相对于瑞文推理测验任务, 推箱子游戏任务所包含的认知加工过程更加多样化, 更具动态性, 未来研究可以考虑结合眼动或者fMRI技术对这一游戏任务所涉及的心理加工过程进行更深入的考察, 从而指导研究者构造出更多有实质意义的特征, 为能力的个体差异的预测提供更有价值的预测源, 甚至通过机器学习建模来替代某些传统能力测量工具。
5 结论
(1) 可以利用游戏log-file收集受测者在任务中的过程性数据, 并利用机器学习算法进行分析。
(2) 机器学习建立的区分模型对数学成绩和推理能力具有较好的预测效果, 利用电脑所记录的游戏过程数据可以对个体的能力进行较为有效的预测。
参考文献
Economic games: A performance-based assessment of fairness and altruism
DOI:10.1027/1015-5759/a000183 URL [本文引用: 1]
The Tower of London spatial problem-solving task: Enhancing clinical and research implementation
DOI:10.1076/jcen.24.5.586.1006
URL
PMID:12187443
[本文引用: 1]

Since its development in 1982, The Tower of London (TOL; Shallice, 1982) spatial problem-solving task has been increasingly employed in test batteries of executive functions. This task has served as a rich source of information on preparation, planning and processing, but a number of issues remain unaddressed in the literature: (1) the problem structure, or problem space of the task, (2) the impact of modifications from the original, Shallice TOL, and (3) the variety of performance measures that can be derived from the TOL. We present here an overview of these issues in the hope that it may lead to a more effective and reasoned use of the TOL task by clinical and nonclinical investigators, alike.
The effect of practice on Raven's Advanced Progressive Matrices
DOI:10.1016/S1041-6080(03)00015-3
URL
[本文引用: 2]
Sixty-seven participants (39 men and 28 women), ranging in age from 26 to 79 years, were administered Raven's Advanced Progressive Matrices (APM) on three occasions. Although total APM scores were found to be highly reliable across the three occasions, the reliabilities of most individual items were extremely low. A single-factor model remained a borderline adequate fit (explaining approximately 20% of the variance) for the interitem correlation matrix on all three occasions. Total APM scores increased significantly across the three occasions (approximately two items per occasion). Improvements in total score across the occasions happened within a context of subjects changing both correct and incorrect responses from the previous occasion. The number of items left unanswered was found to be unrelated to both APM score on any given occasion and the amount of gain in score made across occasions. These findings suggest that the improvements in performance were not based on the acquisition of a strategy design to respond to more items or on the retention of item-specific information, but rather, the improvement reflected learning, something common to the types of items found in the APM.
Random forests
DOI:10.1023/A:1010933404324 URL [本文引用: 1]
Cognitive test anxiety and academic performance
DOI:10.1006/ceps.2001.1094
URL
[本文引用: 2]
A new measure that focused explicitly on the cognitive dimension of test anxiety was introduced and examined for psychometric quality as compared to existing measures of test anxiety. The new scale was found to be a reliable and valid measure of cognitive test anxiety. The impact of cognitive test anxiety as well as emotionality and test procrastination were subsequently evaluated on three course exams and students' self-reported performance on the Scholastic Aptitude Test for 168 undergraduate students. Higher levels of cognitive test anxiety were associated with significantly lower test scores on each of the three course examinations. High levels of cognitive test anxiety also were associated with significantly lower Scholastic Aptitude Test scores. Procrastination, in contrast, was related to performance only on the course final examination. Gender differences in cognitive test anxiety were documented, but those differences were not related to performance on the course exams. Examination of the relation between the emotionality component of test anxiety and performance revealed that moderate levels of physiological arousal generally were associated with higher exam performance. The results were consistent with cognitive appraisal and information processing models of test anxiety and support the conclusion that cognitive test anxiety exerts a significant stable and negative impact on academic performance measures.
Technological issues for computer-based assessment
In P. Griffin, B. McGaw, & E. Care (Eds.),
DOI:10.1007/978-94-007-2324-5_4
URL
[本文引用: 1]
This chapter reviews the contribution of new information-communication technologies to the advancement of educational assessment. Improvements can be described in terms of precision in detecting the actual values of the observed variables, efficiency in collecting and processing information, and speed and frequency of feedback given to the participants and stakeholders. The chapter reviews previous research and development in two ways, describing the main tendencies in four continents (Asia, Australia, Europe and the US) as well as summarizing research on how technology advances assessment in certain crucial dimensions (assessment of established constructs, extension of assessment domains, assessment of new constructs and in dynamic situations). As there is a great variety of applications of assessment in education, each one requiring different technological solutions, the chapter classifies assessment domains, purposes and contexts and identifies the technological needs and solutions for each. The chapter reviews the contribution of technology to the advancement of the entire educational evaluation process, from authoring and automatic generation and storage of items, through delivery methods (Internet-based, local server, removable media, mini-computer labs) to forms of task presentation made possible with technology for response capture, scoring and automated feedback and reporting. Finally, the chapter identifies areas for which further research and development is needed (migration strategies, security, availability, accessibility, comparability, framework and instrument compliance) and lists themes for research projects feasible for inclusion in the Assessment and Teaching of Twenty-first Century Skills project.
Implications of the digital ocean on current and future assessment
In R. W. Lissitz & H. Jiao (Eds.),
The determinants of scholastic achievement: The contribution of personality traits, self-esteem, and academic self-efficacy
DOI:10.1016/j.lindif.2013.07.006
URL
[本文引用: 1]
61Traits, self-esteem, and self-efficacy operate in concert in predicting academic performance.61Self-efficacy mediates the effect of conscientiousness on senior high school grades.61Self-efficacy mediates the effect of self-esteem on senior high school grades.61Such relationships did not differ as a function of gender.61Such relationships held controlling for parents' education and previous scholastic achievement.
School readiness and later achievement
DOI:10.1037/0012-1649.43.6.1428
URL
PMID:18020822
[本文引用: 1]
Abstract Using 6 longitudinal data sets, the authors estimate links between three key elements of school readiness--school-entry academic, attention, and socioemotional skills--and later school reading and math achievement. In an effort to isolate the effects of these school-entry skills, the authors ensured that most of their regression models control for cognitive, attention, and socioemotional skills measured prior to school entry, as well as a host of family background measures. Across all 6 studies, the strongest predictors of later achievement are school-entry math, reading, and attention skills. A meta-analysis of the results shows that early math skills have the greatest predictive power, followed by reading and then attention skills. By contrast, measures of socioemotional behaviors, including internalizing and externalizing problems and social skills, were generally insignificant predictors of later academic performance, even among children with relatively high levels of problem behavior. Patterns of association were similar for boys and girls and for children from high and low socioeconomic backgrounds.
Computer-generated log-file analyses as a window into students' minds? A showcase study based on the PISA 2012 assessment of problem solving
DOI:10.1016/j.compedu.2015.10.018
URL
[本文引用: 2]
61Computer-based assessments enables analyses of log-files that contain students' actions.61We analyzed PISA 2012 problem solving log-files of over 16,000 students.61We related students' strategic approach to performance on an individual and country level.61We identified several groups of students with different levels of (non-)mastery.61We discuss implications of log-file analyses for scientists, teachers, and policy makers.
Machine learning in action
(R. Li, P. Li, Y. D. Qu, & B. Wang, Trans.).
Retesting in selection: A meta- analysis of coaching and practice effects for tests of cognitive ability
DOI:10.1037/0021-9010.92.2.373
URL
PMID:17371085
[本文引用: 1]
Abstract Previous studies have indicated that as many as 25% to 50% of applicants in organizational and educational settings are retested with measures of cognitive ability. Researchers have shown that practice effects are found across measurement occasions such that scores improve when these applicants retest. In this study, the authors used meta-analysis to summarize the results of 50 studies of practice effects for tests of cognitive ability. Results from 107 samples and 134,436 participants revealed an adjusted overall effect size of .26. Moderator analyses indicated that effects were larger when practice was accompanied by test coaching and when identical forms were used. Additional research is needed to understand the impact of retesting on the validity inferences drawn from test scores. (c) 2007 APA, all rights reserved.
Game-based assessment:The mash-up we've been waiting for
In T. Reiners & L. C. Wood (Eds.),
DOI:10.1007/978-3-319-10208-5_11
URL
[本文引用: 2]
This chapter uses game-based assessment (GBA) to crack one of the hardest nuts in higher education: assessment. Section 1 clarifies why higher education needs assessment Section 2 reviews the failings of current approaches to assessment. Section 3 uses those failures to articulate game-based solutions. Section 4 explains why students love to be assessed. Section 5 points out that higher education is already a game and that game-based assessment is likely to yield better data because it is a kinder, more effective way to respond to failure.
Correlates, causes, effects, and treatment of test anxiety
DOI:10.3102/00346543058001047
URL
[本文引用: 1]
Results of 562 studies were integrated by meta-analysis to show the nature, effects, and treatment of academic test anxiety. Effect sizes were computed through the method invented by Glass (Glass, McGaw, & Smith, 1981). Correlations and effect-size groups were tested for consistency and significance with inferential statistics by Hedges and Olkin (1985). Test anxiety (TA) causes poor performance. It relates inversely to students' self-esteem and directly to their fears of negative evaluation, defensiveness, and other forms of anxiety. Conditions (causes) giving rise to differential TA levels include ability, gender, and school grade level. A variety of treatments are effective in reducing test anxiety. Contrary to prior perceptions, improved test performance and grade point average (GPA) consistently accompany TA reduction.
Test anxiety and working memory system
DOI:10.2466/pms.1996.82.3c.1223
URL
PMID:8823887
[本文引用: 1]
Abstract The purpose was to examine the effect of test anxiety on deficits in the articulatory loop in the working memory system. We used a verbal memory task to occupy the articulatory loop and a spatial memory task to occupy the visuospatial scratch pad. 17 highly test-anxious and 19 low-anxiety subjects performed both tasks under an anxiety-inducing situation during which they were observed by a monitor camera. Percentage of correct responses and reaction times were measured as indices of task performance. Highly anxious subjects reported feeling worry and cognitive self-concern more than the low-anxiety group. Highly anxious subjects showed a longer mean reaction time on the verbal memory task than the low-anxiety group. On the spatial memory task there was no difference in quality of performance. This finding might suggest that anxiety such as worry and cognitive self-concern interferes with information processing in the articulatory loop of the working memory system.
A brief clinical tool to estimate individual patients’ risk of depressive relapse following remission: Proof of concept
DOI:10.1176/appi.ajp.2016.15111462
URL
PMID:27418380
[本文引用: 1]
The authors sought to determine whether symptoms experienced by formerly depressed patients after at least 8 weeks of remission can be used to identify their risk for relapse during the next 6 months. The study included 188 patients with major depressive disorder from the National Institute of Mental Health Collaborative Depression Study who had at least one Symptom Checklist-90 (SCL-90) assessment after at least 8 weeks of full remission from a depressive episode (defined as a value of 1 on the weekly psychiatric rating scale for all depressive conditions, recorded on Longitudinal Follow-Up Evaluation interviews). Mixed logistic regression was used to identify a set of SCL-90 items that were most predictive of relapse compared with nonrelapse within the next 6 months. Of 514 SCL-90 assessments completed after remission, 73 (14.2%) were followed by depressive relapse within 6 months. Seventeen SCL-90 items (including symptoms of depression, anxiety, and psychological vulnerability) significantly distinguished relapse from nonrelapse. Of these, a set of 12 symptoms maximally separated relapse from nonrelapse. Experiencing one or more of these symptoms had a sensitivity of 80.8% and a specificity of 51.2% for identifying a period in which a relapse occurred, with a positive predictive value of 21.5% and a negative predictive value of 94.2%. The relapse rate was 5.8% when none of the 12 symptoms were present, 16.4% when one to five symptoms were present, 34.1% when six to nine symptoms were present, and 72.7% when 10 or more symptoms were present. A brief symptom scale can be used to identify patients who, despite full remission from a depressive episode, are at substantial risk of relapse within the next 6 months, and this can be used to provide a basis for personalizing the intensity of follow-up visits.
Test anxiety, evaluative stress, and susceptibility to distraction from threat
DOI:10.1002/per.400
URL
[本文引用: 1]
Abstract Examinations are perhaps one of the main methods of assessment in education. Unfortunately, there are some individuals who are so fearful of such events that performance is impaired. Test anxiety is believed to be the trait that predisposes individuals to react negatively to examinations and tests. One way in which it is believed that test anxiety affects performance is by increasing susceptibility to distraction from task-irrelevant material. However, few studies have directly investigated this impairment. An experiment was therefore conducted to investigate susceptibility to distraction in high and low test-anxious students. The task used was based on one developed by Mathews, May, Mogg and Eysenck (1990), which distinguishes between focused attention and selective search. In order to determine whether a specific susceptibility to distraction exists, the distractors were varied in terms of valence and relevance to examinations. Since test anxiety is a situation-specific trait, an evaluation-related stressor was used to trigger test-anxious reactions. A specific susceptibility to distraction from threat was found amongst high test-anxious participants who received the evaluation-related stressor. However, this effect was only found when participants were using focused attention. This suggests that the disturbed performance often found to be associated with test anxiety might be due to an inability to ignore threatening material when attempting to focus attentional resources. These results are discussed in light of current theories of test anxiety and implications for educational practice. Copyright 2001 John Wiley & Sons, Ltd.
Comprehension monitoring and the level of comprehension in high-and low-achieving primary school children's reading
DOI:10.1016/0959-4752(95)00009-R
URL
[本文引用: 1]
ABSTRACT The level of comprehension monitoring and the level of reading comprehension in low- and high-achieving fourth graders were investigated. Monitoring was assessed by changes in reading time and number of look-backs when confronted with comprehension obstacles. Reading comprehension was assessed with a task in which subjects had to summarize the text. The effect of strategic training on low-achievers' monitoring and comprehension was also investigated. The results indicated that the level of monitoring and the level of comprehension are related, which helps to clarify the differences between low- and high-achieving readers' comprehension. Training improved the low-achievers' monitoring and comprehension. The assessment method, with suggestions for its improvement, is also discussed.
Assessment of planning performance in clinical samples: Reliability and validity of the Tower of London task (TOL-F)
DOI:10.1016/j.neuropsychologia.2015.07.017
URL
PMID:26197091
[本文引用: 1]
61Assessment of planning ability in Stroke, Parkinson, and Mild Cognitive Impairment.61A version of the Tower of London task with a structurally balanced item set is used.61For all groups split-half and lower-bound reliability indices are adequate or high.61Patients' performance is consistently worse than that of well-matched controls61The reliability and criterion validity of a complex cognitive task is demonstrated.
Metacognitive planning: Development and validation of an online measure
DOI:10.1037/pas0000019
URL
PMID:25222433
[本文引用: 2]
Abstract Planning is the critical first stage of metacognition. Although it has long been emphasized theoretically, it has not been the subject of much empirical study due to the lack of a valid assessment tool. Because planning is a metacognitive process, online methods that collect data during task performance would much better capture it. The present study was conducted to develop an online measure of metacognitive planning. Researchers designed a puzzle task that took the form of the popular game Sokoban, and the ratio between planning time and total time of each item was chosen as the metacognitive planning index. The task was administered to a heterogeneous sample of 440 participants composed of college students as well as 5th-, 7th-, and 10th-grade students. The results showed that valid inference could be made from the time ratio score. Cronbach's alpha and test-retest correlation provided robust evidence of reliability of the time ratio score. Confirmatory factor analysis further confirmed its unidimensionality. Validity evidence also supported the use of the time ratio score. After controlling for demographic variables, intelligence, and motivation, the time ratio score still accounted for a significant proportion of variance of Sokoban performance, the Tower of London performance, and academic achievement. The time ratio score was also found to increase with age. Taken together, the results of the study revealed that the time ratio is a psychometrically sound online measure of metacognitive planning. (PsycINFO Database Record (c) 2014 APA, all rights reserved).
Real time generalized log file management and analysis using pattern matching and dynamic clustering
DOI:10.5120/15962-5320
URL
[本文引用: 2]
ABSTRACT The past decade saw an exponential rise in the amount of information available on the World Wide Web. Almost every business organization today uses web based technology to wield its huge client base. Consequently, managing the large data and mining pertinent content has become the need of the hour. This is where the 03eld of big data analytics sows its seeds. The linchpin for this is the process of knowledge discovery. Analyzing server logs and other data footprints, aggregated from clients, can facilitate the building of a concrete knowledge base. Querying the knowledge base can help supplement business and other managerial decisions. The approach herein proposes a real time, generalized alternative to log 03le management and analysis. It incorporates the development of a sustainable platform which would enable the analysts to understand the essence of the data available.
Rising scores on intelligence tests: Test scores are certainly going up all over the world, but whether intelligence itself has risen remains controversial
Scikit-learn: Machine learning in python
Verbal protocols of reading: The nature of constructively responsive reading
.
The raven progressive matrices: A review of national norming studies and ethnic and socioeconomic variation within the united-states
DOI:10.1111/j.1745-3984.1989.tb00314.x
URL
[本文引用: 1]
In this paper, some recent results relating to the stability of scores on the Raven Progressive Matrices Test for different subgroups within and between the United Kingdom, the United States, and other Western societies are summarised. Subsequent sections deal with variation over time. A possible explanation for the variation in norms over time and between ethnic groups within the United States is offered.
The role of general cognitive ability and job performance: Why there cannot be a debate
DOI:10.1080/08959285.2002.9668091
URL
[本文引用: 1]
Given the overwhelming research evidence showing the strong link between general cognitive ability (GCA) and job performance, it is not logically possible for industrial -organizational (I/O) psychologists to have a serious debate over whether GCA is important for job performance. However, even if none of this evidence existed in I/O psychology, research findings in differential psychology on the nature and correlates of GCA provide a sufficient basis for the conclusion that GCA is strongly related to job performance. In I/O psychology, the theoretical basis for the empirical evidence linking GCA and job performance is rarely presented, but is critical to understanding and acceptance of these findings. The theory explains the why behind the empirical findings. From the viewpoint of the kind of world we would like to live in-and would like to believe we live in-the research findings on GCA are not what most people would hope for and are not welcome. However, if we want to remain a science-based field, we cannot reject what we know to be true in favor of what we would like to be true.
The
Introduction to data mining
.
TENI: A comprehensive battery for cognitive assessment based on games and technology
DOI:10.1080/09297049.2014.977241
URL
PMID:25396766
[本文引用: 1]
TENI (Test de Evaluaci n Neuropsicol gica Infantil) is an instrument developed to assess cognitive abilities in children between 3 and 9 years of age. It is based on a model that incorporates games and technology as tools to improve the assessment of children's capacities. The test was standardized with two Chilean samples of 524 and 82 children living in urban zones. Evidence of reliability and validity based on current standards is presented. Data show good levels of reliability for all subtests. Some evidence of validity in terms of content, test structure, and association with other variables is presented. This instrument represents a novel approach and a new frontier in cognitive assessment. Further studies with clinical, rural, and cross-cultural populations are required.
The relation between intellectual and metacognitive skills from a developmental perspective
DOI:10.1016/j.learninstruc.2003.10.004
URL
The first objective of this study was to establish to what extent metacognitive skill development is associated with intelligence. As a second objective, the generality vs. domain-specificity of maturing metacognitive skills was investigated. Both issues have major implications for the training and transferability of metacognitive skills. Participants from four age groups (fourth-, sixth-, and eighth-graders, and university students) performed four inductive learning tasks, representing different domains. Intelligence, metacognitive skillfulness and learning performances were assessed for each participant. Results show that metacognitive skillfulness is a general, person-related characteristic across age groups, rather than being domain-specific. Moreover, metacognitive skills appear to develop and to contribute to learning performance, partly independent of intelligence. Educational implications are discussed.
The on-line assessment of metacognitive skills in a computerized learning environment
DOI:10.1016/j.lindif.2013.01.003
URL
[本文引用: 3]
78 Metacognitive skills can be validly on-line assessed with computer logfiles. 78 Logfile indicators of metacognition are relevant predictors of learning outcomes. 78 Logfile indicators of metacognition predict learning, independent of intelligence.
The validity of a game-based assessment of persistence
DOI:10.1016/j.chb.2013.06.033
URL
[本文引用: 1]
In this study, 154 students individually played a challenging physics video game for roughly 4h. Based on time data for both solved and unsolved problems derived from log files, we created a game-based assessment of persistence that was validated against an existing measure of persistence. We found that the game-based assessment of persistence predicted learning of qualitative physics after controlling for gender, video game experience, pretest knowledge and enjoyment of the game. These findings support the implementation of a real-time formative assessment of persistence to be used to dynamically change gameplay.
Computer- based personality judgments are more accurate than those made by humans
DOI:10.1073/pnas.1418680112
URL
PMID:25583507
[本文引用: 1]
Abstract Judging others' personalities is an essential skill in successful social living, as personality is a key driver behind people's interactions, behaviors, and emotions. Although accurate personality judgments stem from social-cognitive skills, developments in machine learning show that computer models can also make valid judgments. This study compares the accuracy of human and computer-based personality judgments, using a sample of 86,220 volunteers who completed a 100-item personality questionnaire. We show that (i) computer predictions based on a generic digital footprint (Facebook Likes) are more accurate (r = 0.56) than those made by the participants' Facebook friends using a personality questionnaire (r = 0.49); (ii) computer models show higher interjudge agreement; and (iii) computer personality judgments have higher external validity when predicting life outcomes such as substance use, political attitudes, and physical health; for some outcomes, they even outperform the self-rated personality scores. Computers outpacing humans in personality judgment presents significant opportunities and challenges in the areas of psychological assessment, marketing, and privacy.
The developmental differences of problem solving ability between intellectually- gifted and intellectually-average children aged from 11-14 years old
11~14岁超常儿童与普通儿童问题解决能力的发展比较
DOI:10.3724/SP.J.1041.2014.01823
URL
[本文引用: 1]
以北京市某中学和某小学11-14岁之间294名学生为被试,其中超常儿童131人,普通儿童163人。采用推箱子任务,结合横断比较和纵向追踪数据,从认知能力、元认知能力和认知效率三个维度来考察超常儿童与普通儿童问题解决能力的发展差异。结果发现超常儿童在问题解决能力的三个维度上均优于普通儿童,两类儿童问题解决能力的发展模式不一致:超常儿童的问题解决能力发展先快后慢,快速发展期在11-12岁半之间;普通儿童的问题解决能力发展先慢后快,快速发展期在12岁半-14岁之间。超常儿童与普通儿童的问题解决能力差异随年龄增大逐渐减小。
Emotion recognition based on customized smart bracelet with built-in accelerometer
DOI:10.7717/peerj.2258
URL
PMID:27547564
[本文引用: 1]
Abstract BACKGROUND: Recently, emotion recognition has become a hot topic in human-computer interaction. If computers could understand human emotions, they could interact better with their users. This paper proposes a novel method to recognize human emotions (neutral, happy, and angry) using a smart bracelet with built-in accelerometer. METHODS: In this study, a total of 123 participants were instructed to wear a customized smart bracelet with built-in accelerometer that can track and record their movements. Firstly, participants walked two minutes as normal, which served as walking behaviors in a neutral emotion condition. Participants then watched emotional film clips to elicit emotions (happy and angry). The time interval between watching two clips was more than four hours. After watching film clips, they walked for one minute, which served as walking behaviors in a happy or angry emotion condition. We collected raw data from the bracelet and extracted a few features from raw data. Based on these features, we built classification models for classifying three types of emotions (neutral, happy, and angry). RESULTS AND DISCUSSION: For two-category classification, the classification accuracy can reach 91.3% (neutral vs. angry), 88.5% (neutral vs. happy), and 88.5% (happy vs. angry), respectively; while, for the differentiation among three types of emotions (neutral, happy, and angry), the accuracy can reach 81.2%. CONCLUSIONS: Using wearable devices, we found it is possible to recognize human emotions (neutral, happy, and angry) with fair accuracy. Results of this study may be useful to improve the performance of human-computer interaction.
