
Modulation effect of interpersonal approach-avoidance actions on joint Flanker effect
ZHAO Mengfei1, BAI Linyu1, SHEN Mowei2(), WANG Jun1()
1School of Psychology, Zhejiang Normal University; Zhejiang Philosophy and Social Science Laboratory for the Mental Health and Crisis Intervention of Children and Adolescents, Jinhua 321004, China 2Department of Psychology and Behavioral Sciences, Zhejiang University, Hangzhou 310058, China
Published:2026-10-25
Online:2026-08-04
Contact:
SHEN Mowei,WANG Jun
E-mail:mwshen@zju.edu.cn;jun.wang@zjnu.edu.cn
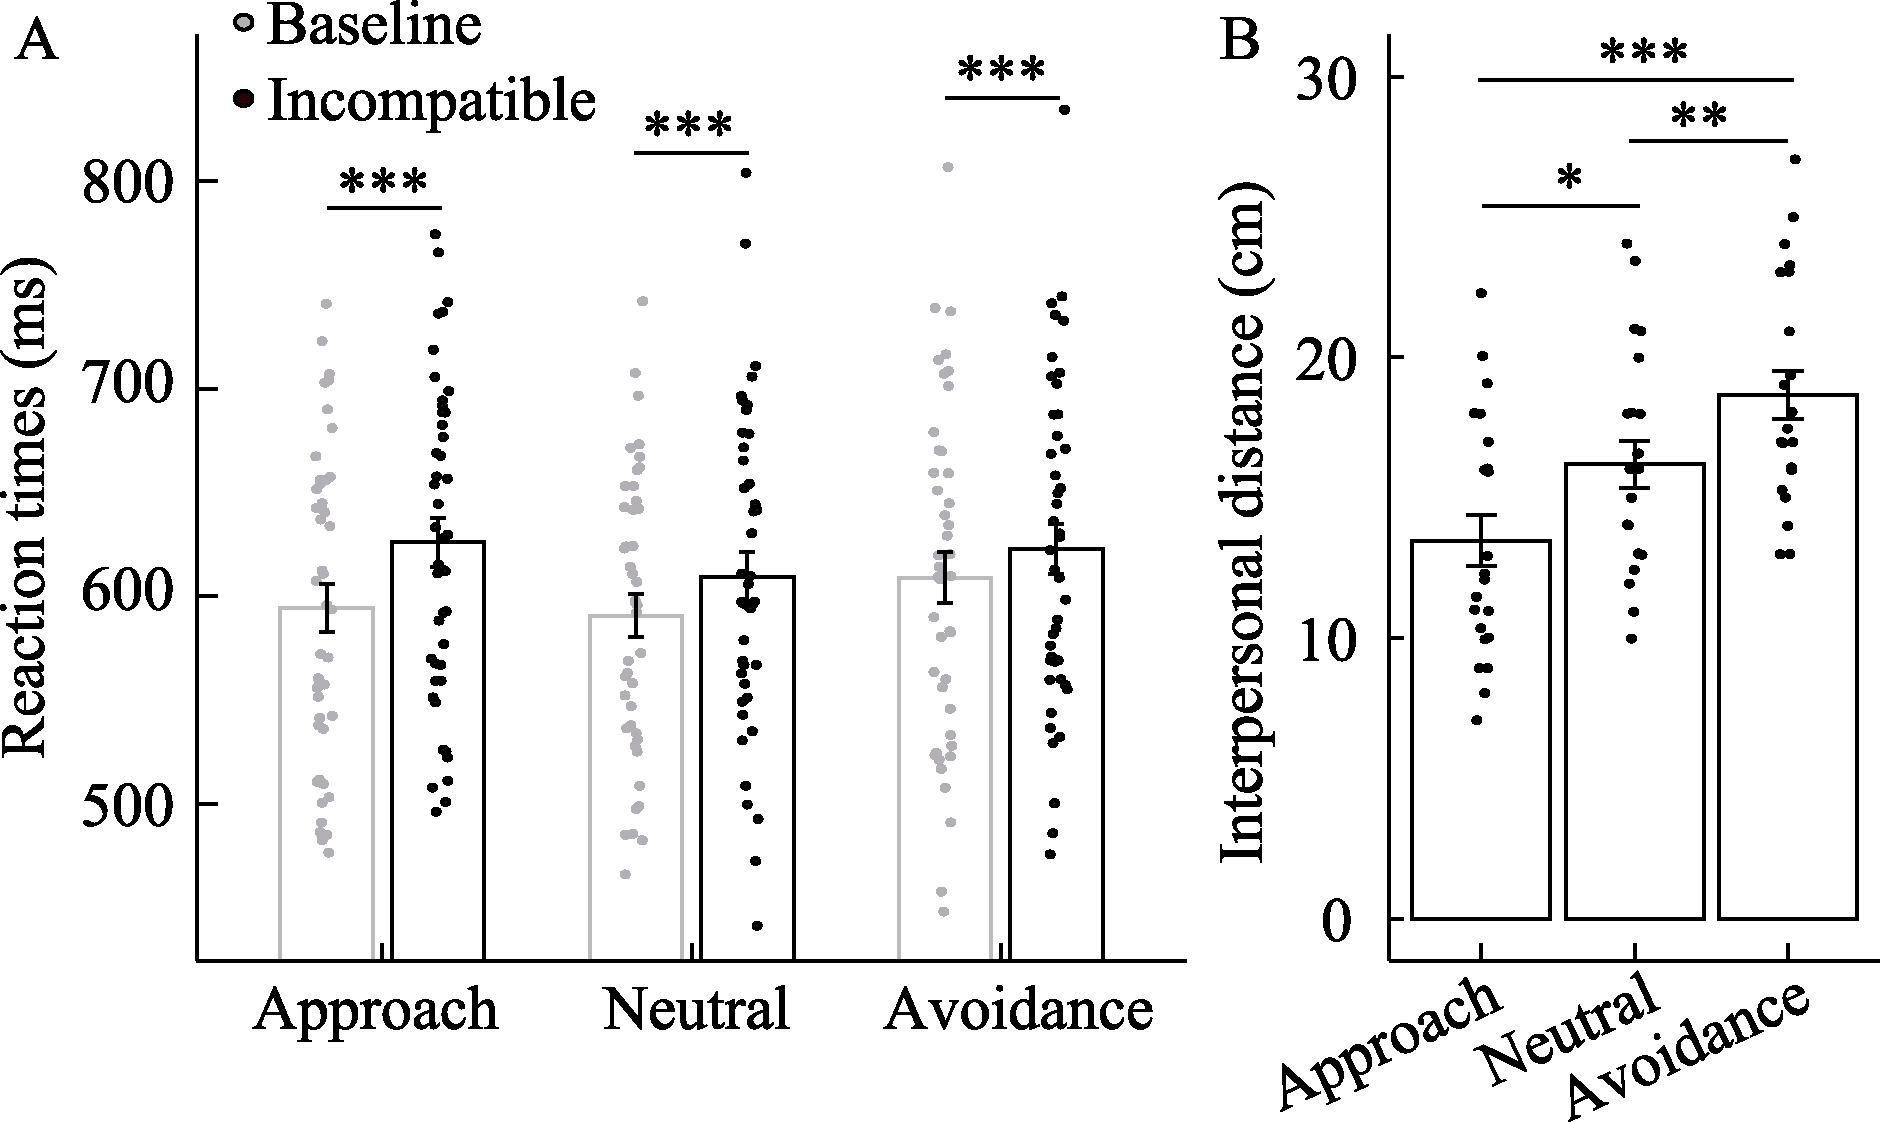
Table 1 Descriptive statistics for reaction times in Experiment 1a
RT (ms)
Approach
Neutral
Avoidance
Baseline
594.37 (75.42)
590.66 (68.33)
609.02 (80.99)
Incompatible
626.00 (77.14)
609.54 (76.94)
622.71 (78.89)
Figure 1.Results of reaction times and interpersonal distance in Experiment 1a. Note: In Figure 1A, grey bars represent the baseline condition, and black bars represent the incompatible condition. In both Figure 1A and 1B, bar heights represent means, black lines represent standard errors, and dots represent individuals’ data. *** p <.001, ** p <.01, * p <.05.
Figure 1. Results of reaction times and interpersonal distance in Experiment 1a.Note: In Figure 1A, grey bars represent the baseline condition, and black bars represent the incompatible condition. In both Figure 1A and 1B, bar heights represent means, black lines represent standard errors, and dots represent individuals’ data. *** p <.001, ** p <.01, * p <.05.
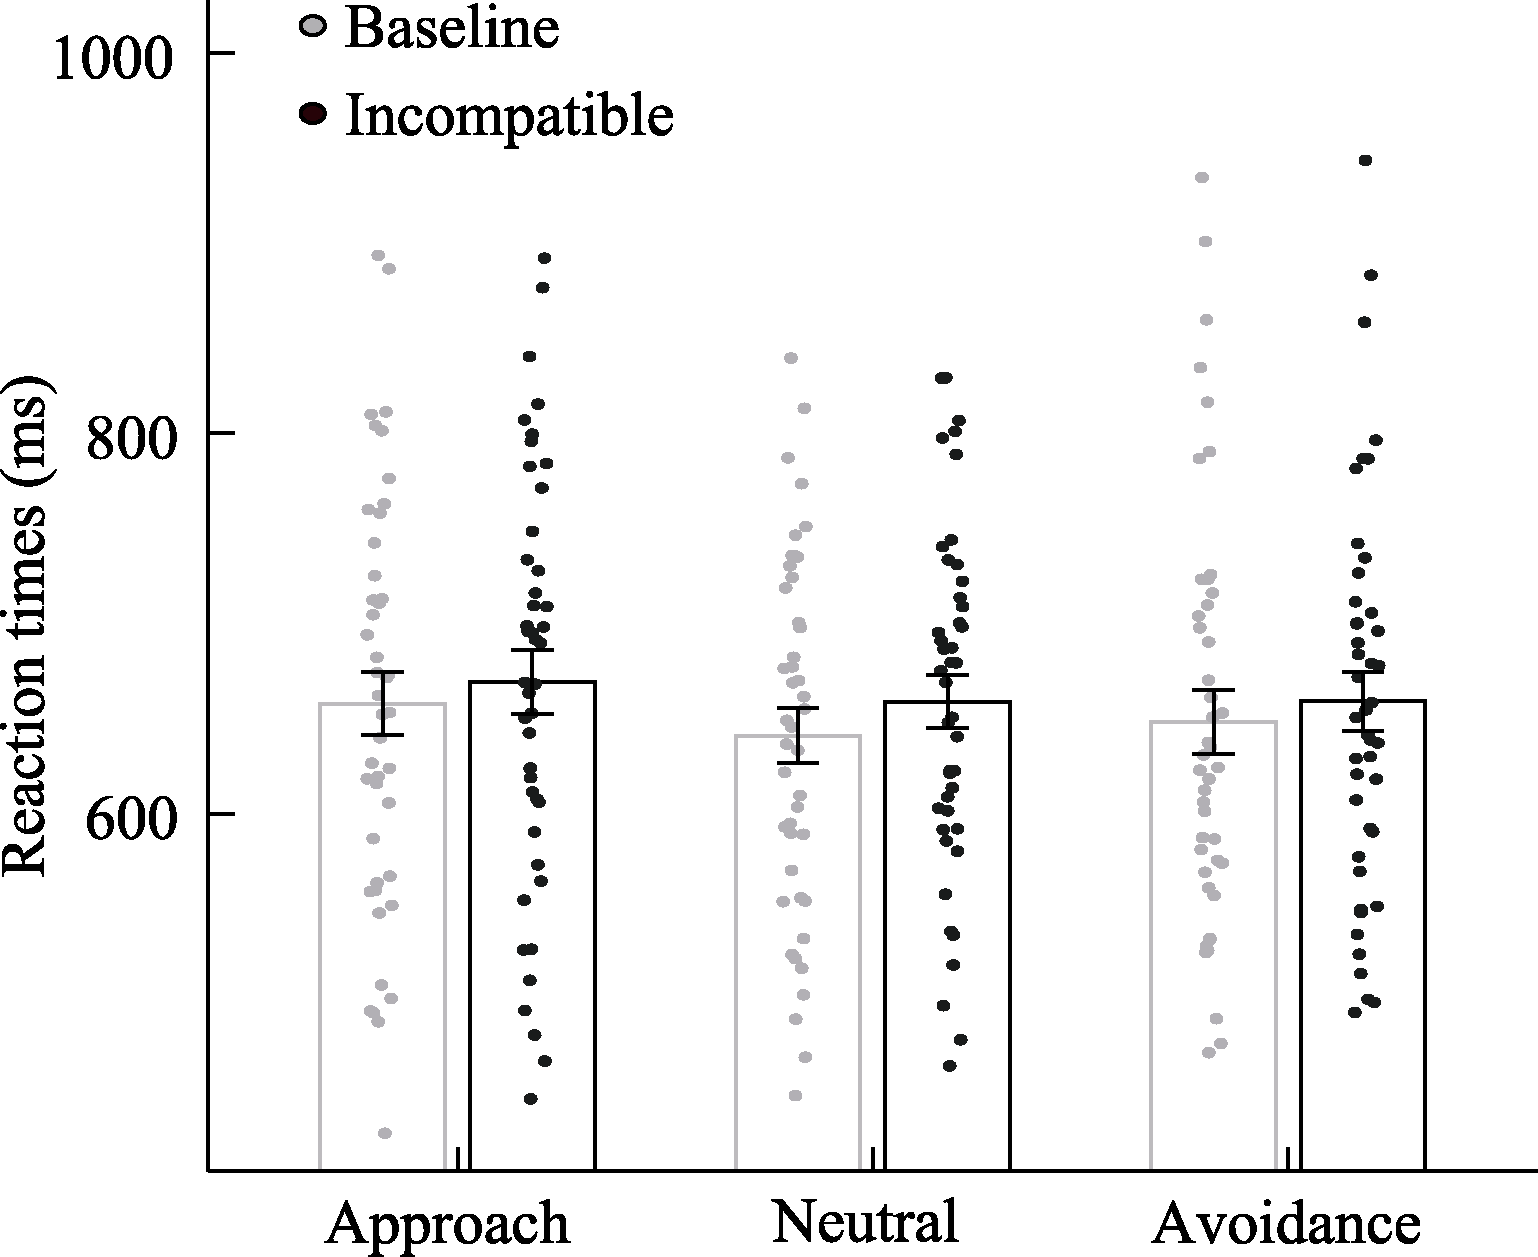
Table 2 Descriptive statistics for reaction times in Experiment 1b
RT (ms)
Approach
Neutral
Avoidance
Baseline
657.86 (109.98)
640.96 (95.36)
648.34 (111.24)
Incompatible
669.17 (110.85)
658.84 (92.51)
659.00 (104.01)
Figure 2.Results of reaction times in Experiment 1b. Note: The grey bars represent the baseline condition, and black bars represent the incompatible condition. The bar heights represent means, black lines represent standard errors, and dots represent individuals’ data.
Figure 2. Results of reaction times in Experiment 1b.Note: The grey bars represent the baseline condition, and black bars represent the incompatible condition. The bar heights represent means, black lines represent standard errors, and dots represent individuals’ data.
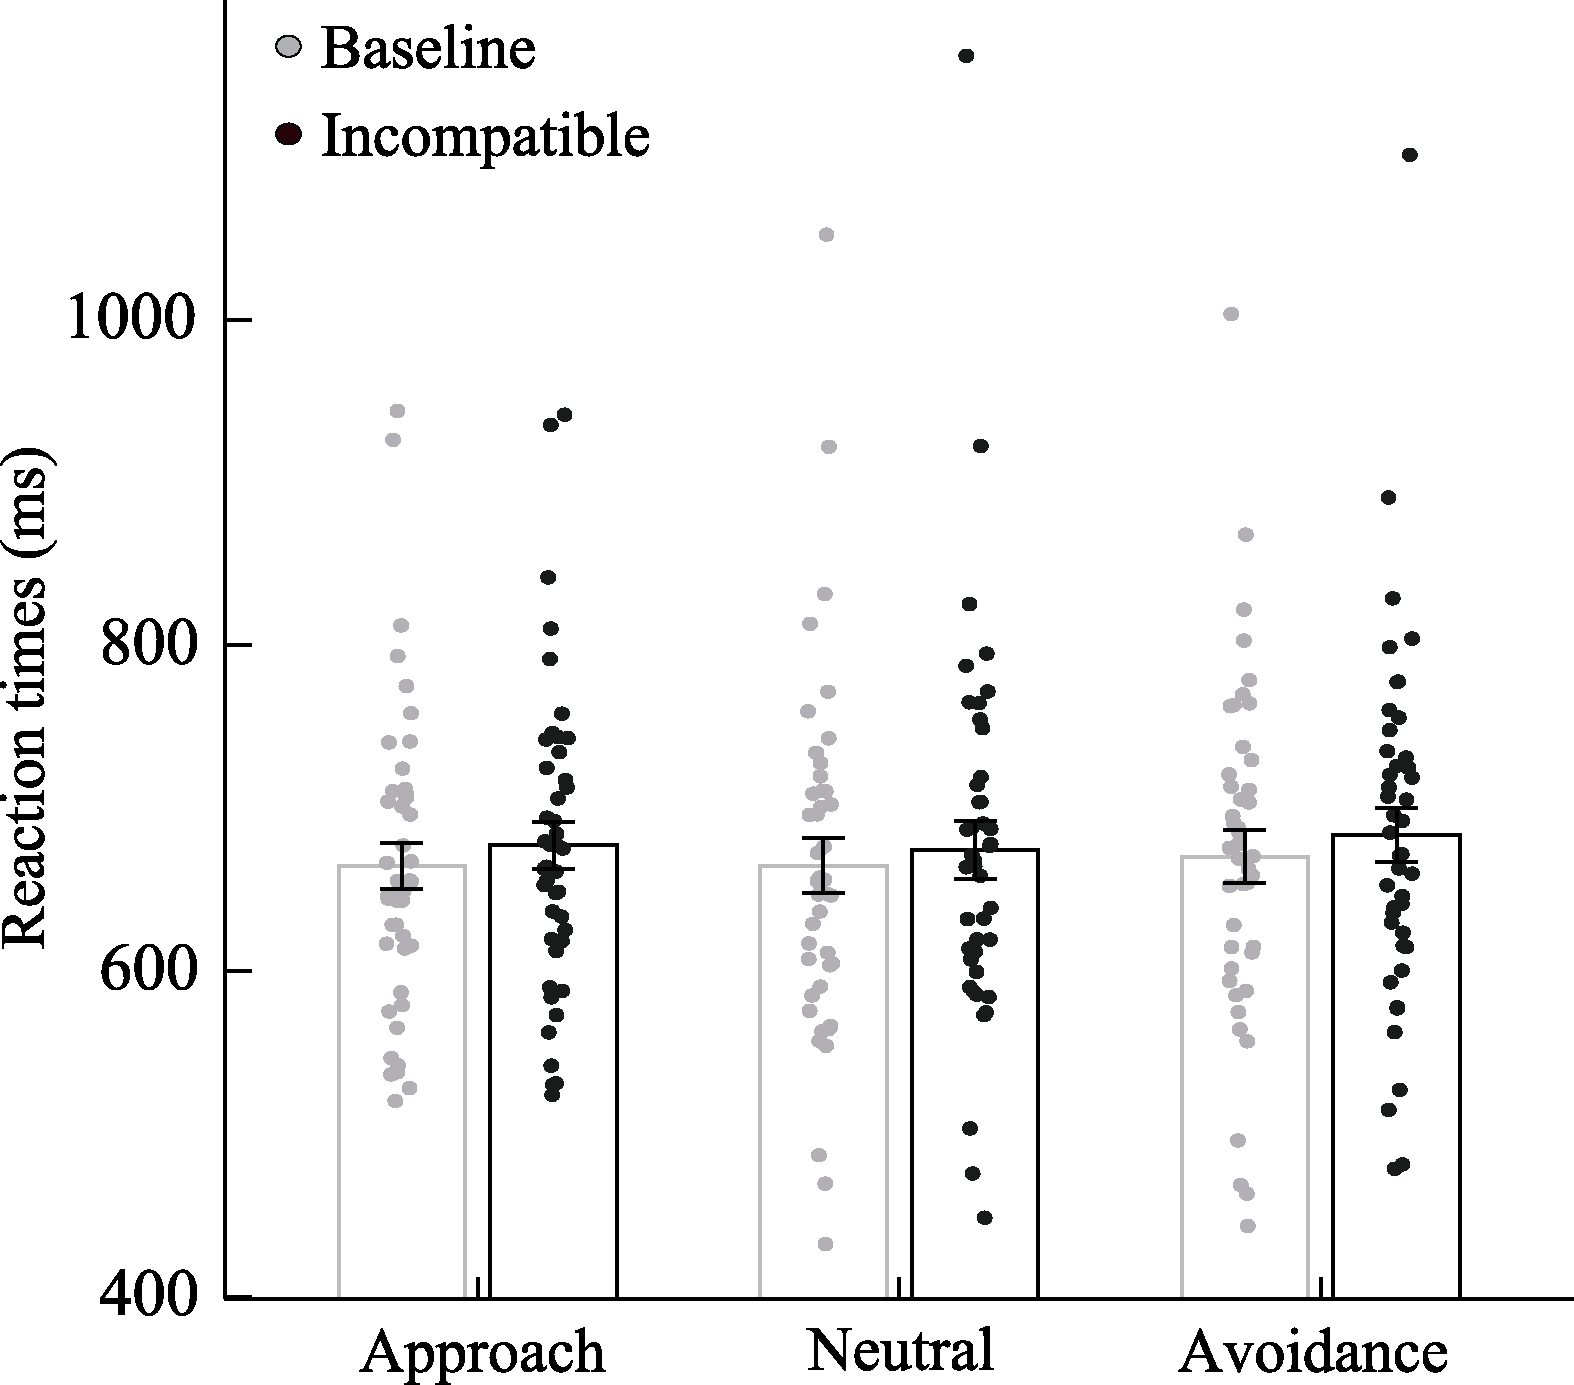
Table 3 Descriptive statistics for reaction times in Experiment 2a
RT (ms)
Approach
Neutral
Avoidance
Baseline
664.65 (93.94)
664.56 (111.75)
670.23 (106.98)
Incompatible
677.03 (94.29)
674.34 (117.89)
683.39 (110.62)
Figure 3.Results of reaction times in Experiment 2a. Note: The grey bars represent the baseline condition, and black bars represent the incompatible condition. The bar heights represent means, black lines represent standard errors, and dots represent individuals’ data.
Figure 3. Results of reaction times in Experiment 2a.Note: The grey bars represent the baseline condition, and black bars represent the incompatible condition. The bar heights represent means, black lines represent standard errors, and dots represent individuals’ data.
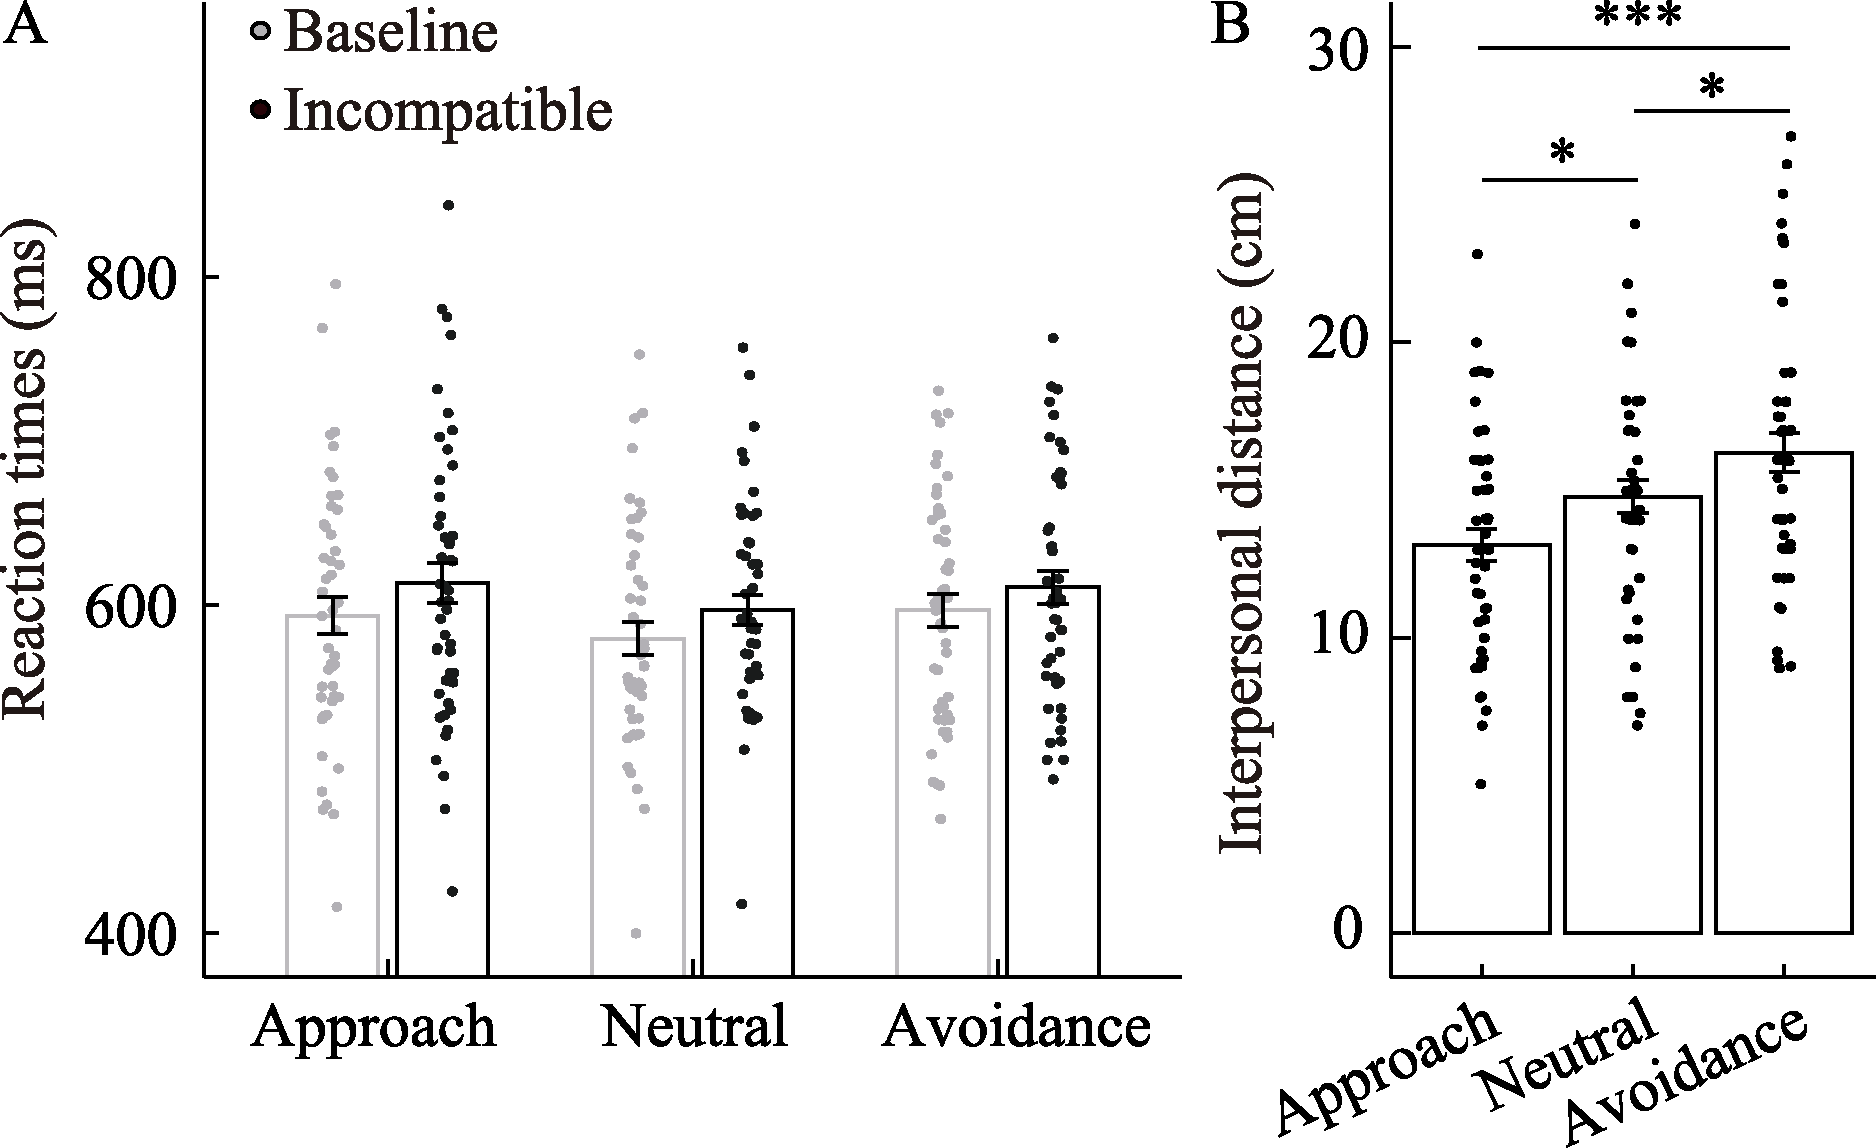
Table 4 Descriptive statistics for reaction times in Experiment 2b
RT (ms)
Approach
Neutral
Avoidance
Baseline
593.33 (78.63)
579.44 (68.84)
596.75 (69.15)
Incompatible
613.37 (85.43)
597.00 (64.16)
610.72 (69.44)
Figure 4.Results of reaction times in Experiment 2b. Note: In Figure 4A, grey bars represent the baseline condition, and black bars represent the incompatible condition. In both Figure 4A and 4B, bar heights represent means, black lines represent standard errors, and dots represent individuals’ data. *** p <.001, * p <.05.
Figure 4. Results of reaction times in Experiment 2b.Note: In Figure 4A, grey bars represent the baseline condition, and black bars represent the incompatible condition. In both Figure 4A and 4B, bar heights represent means, black lines represent standard errors, and dots represent individuals’ data. *** p <.001, * p <.05.