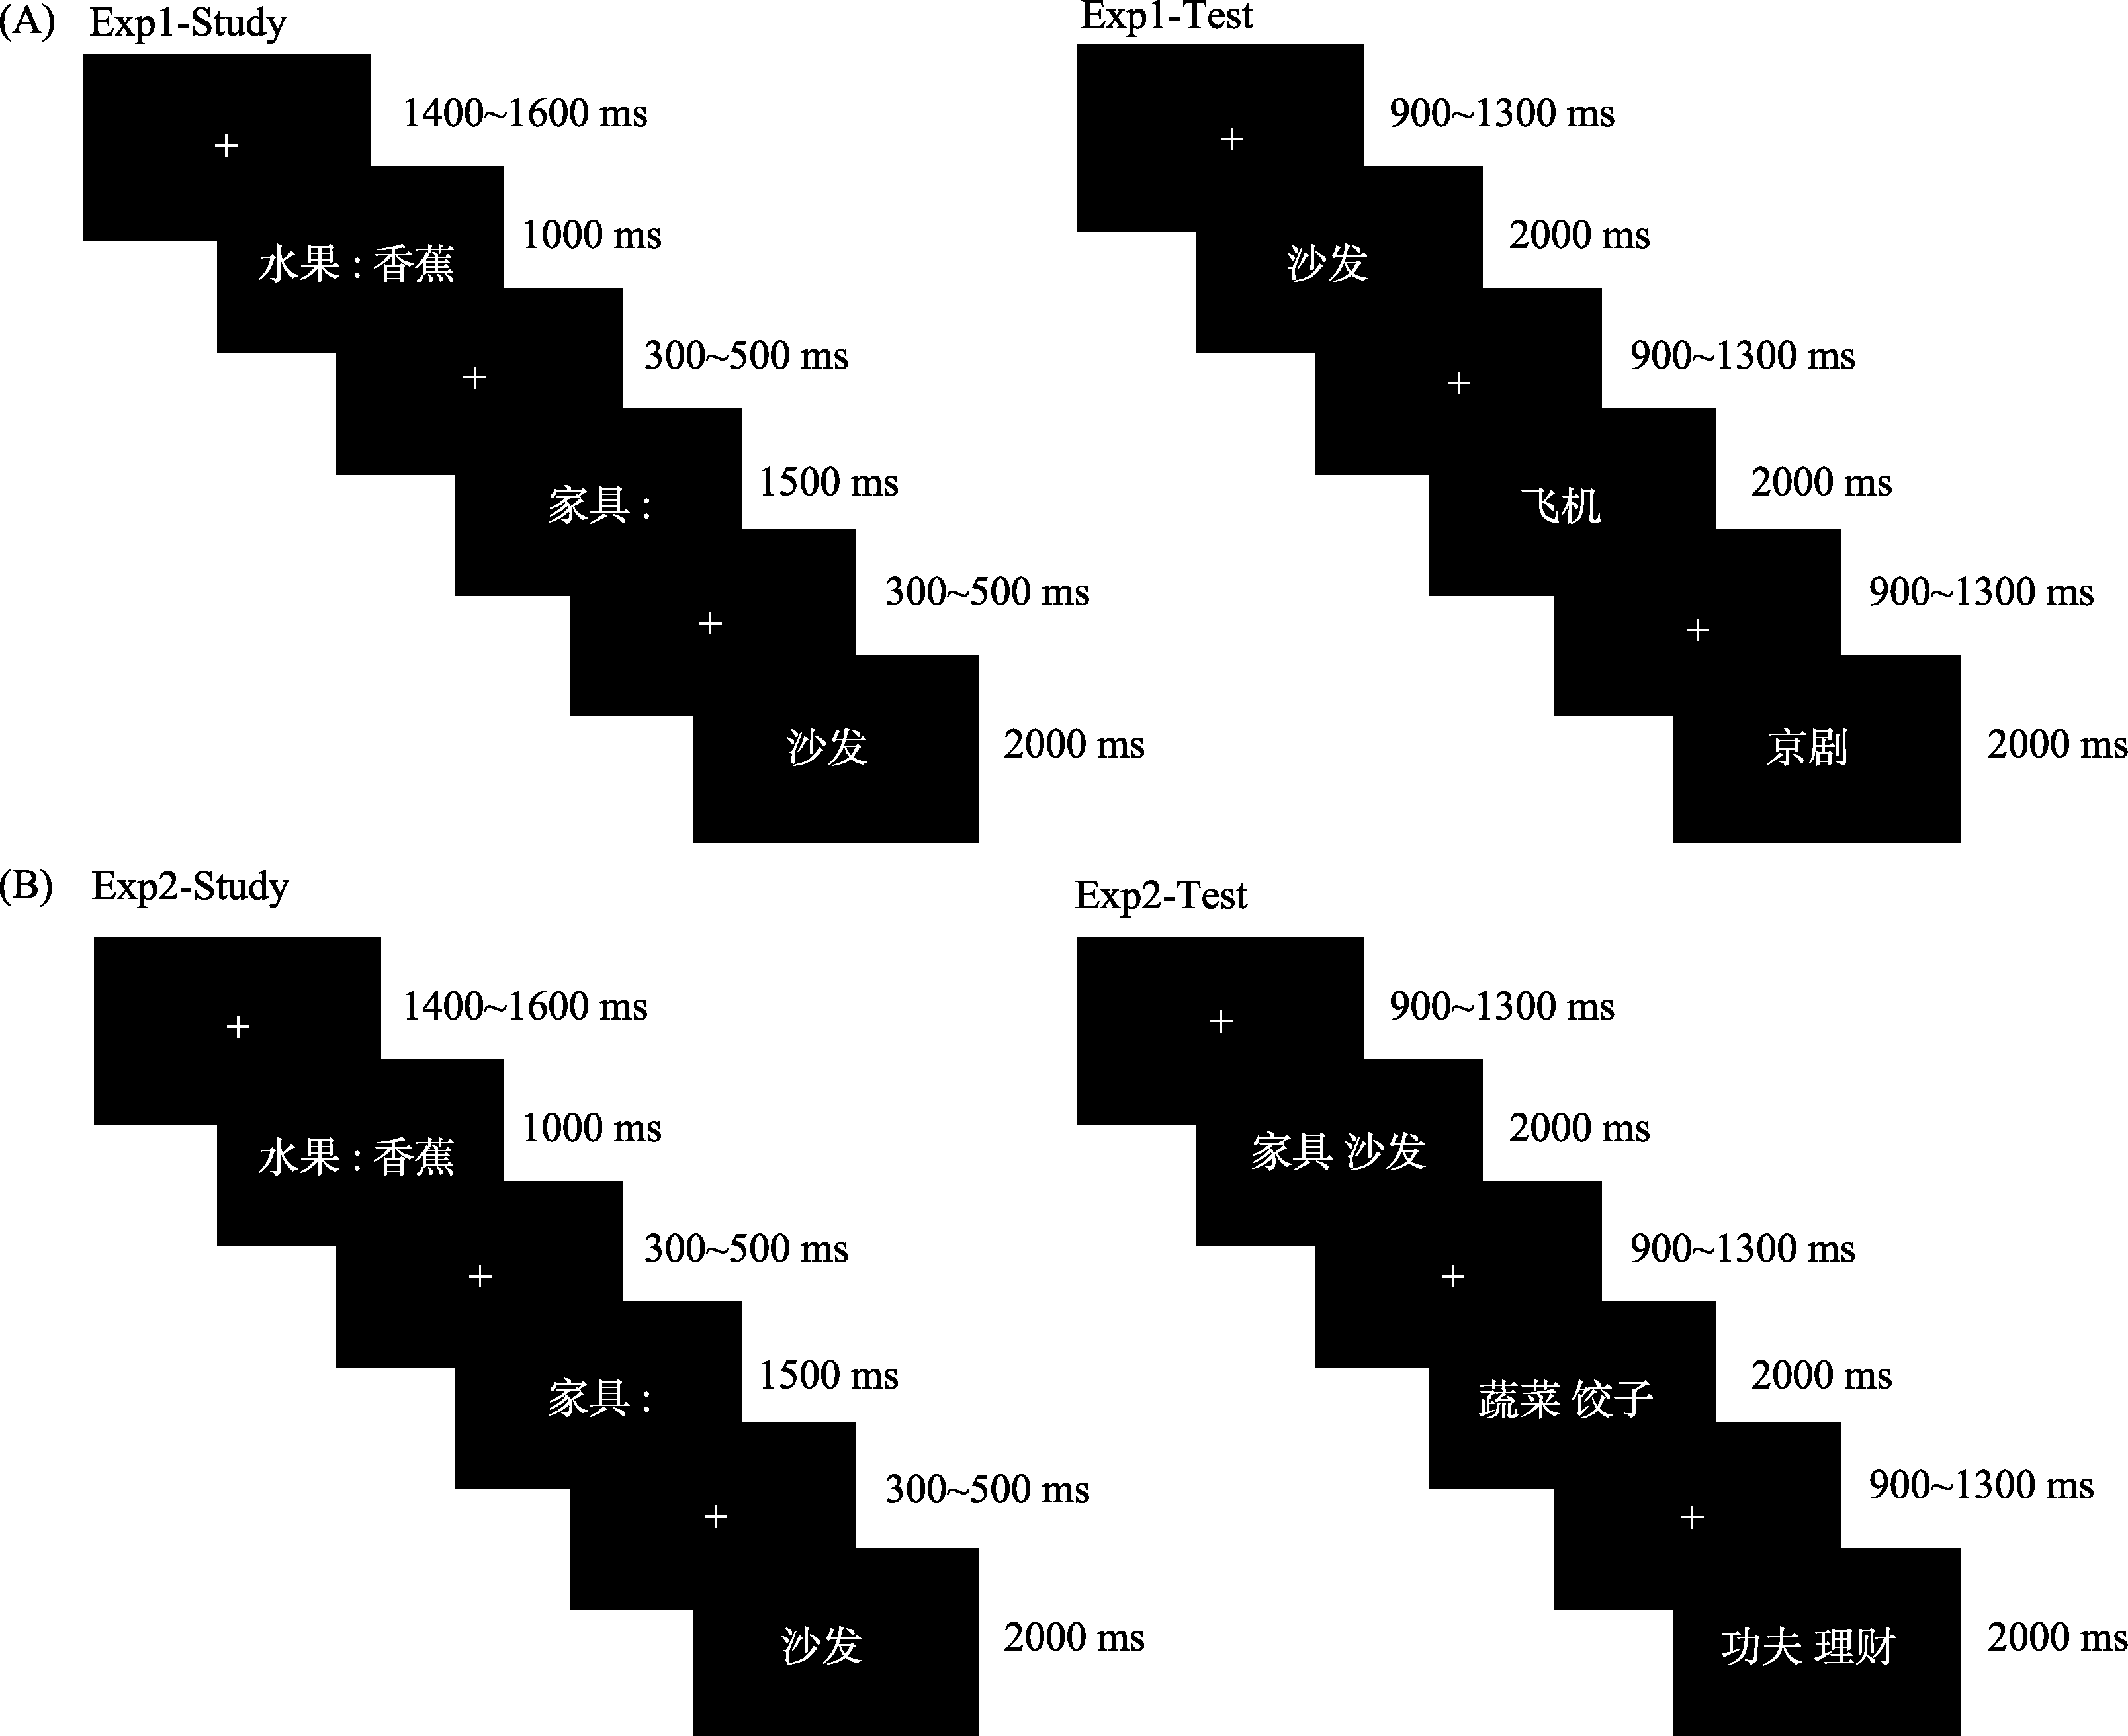
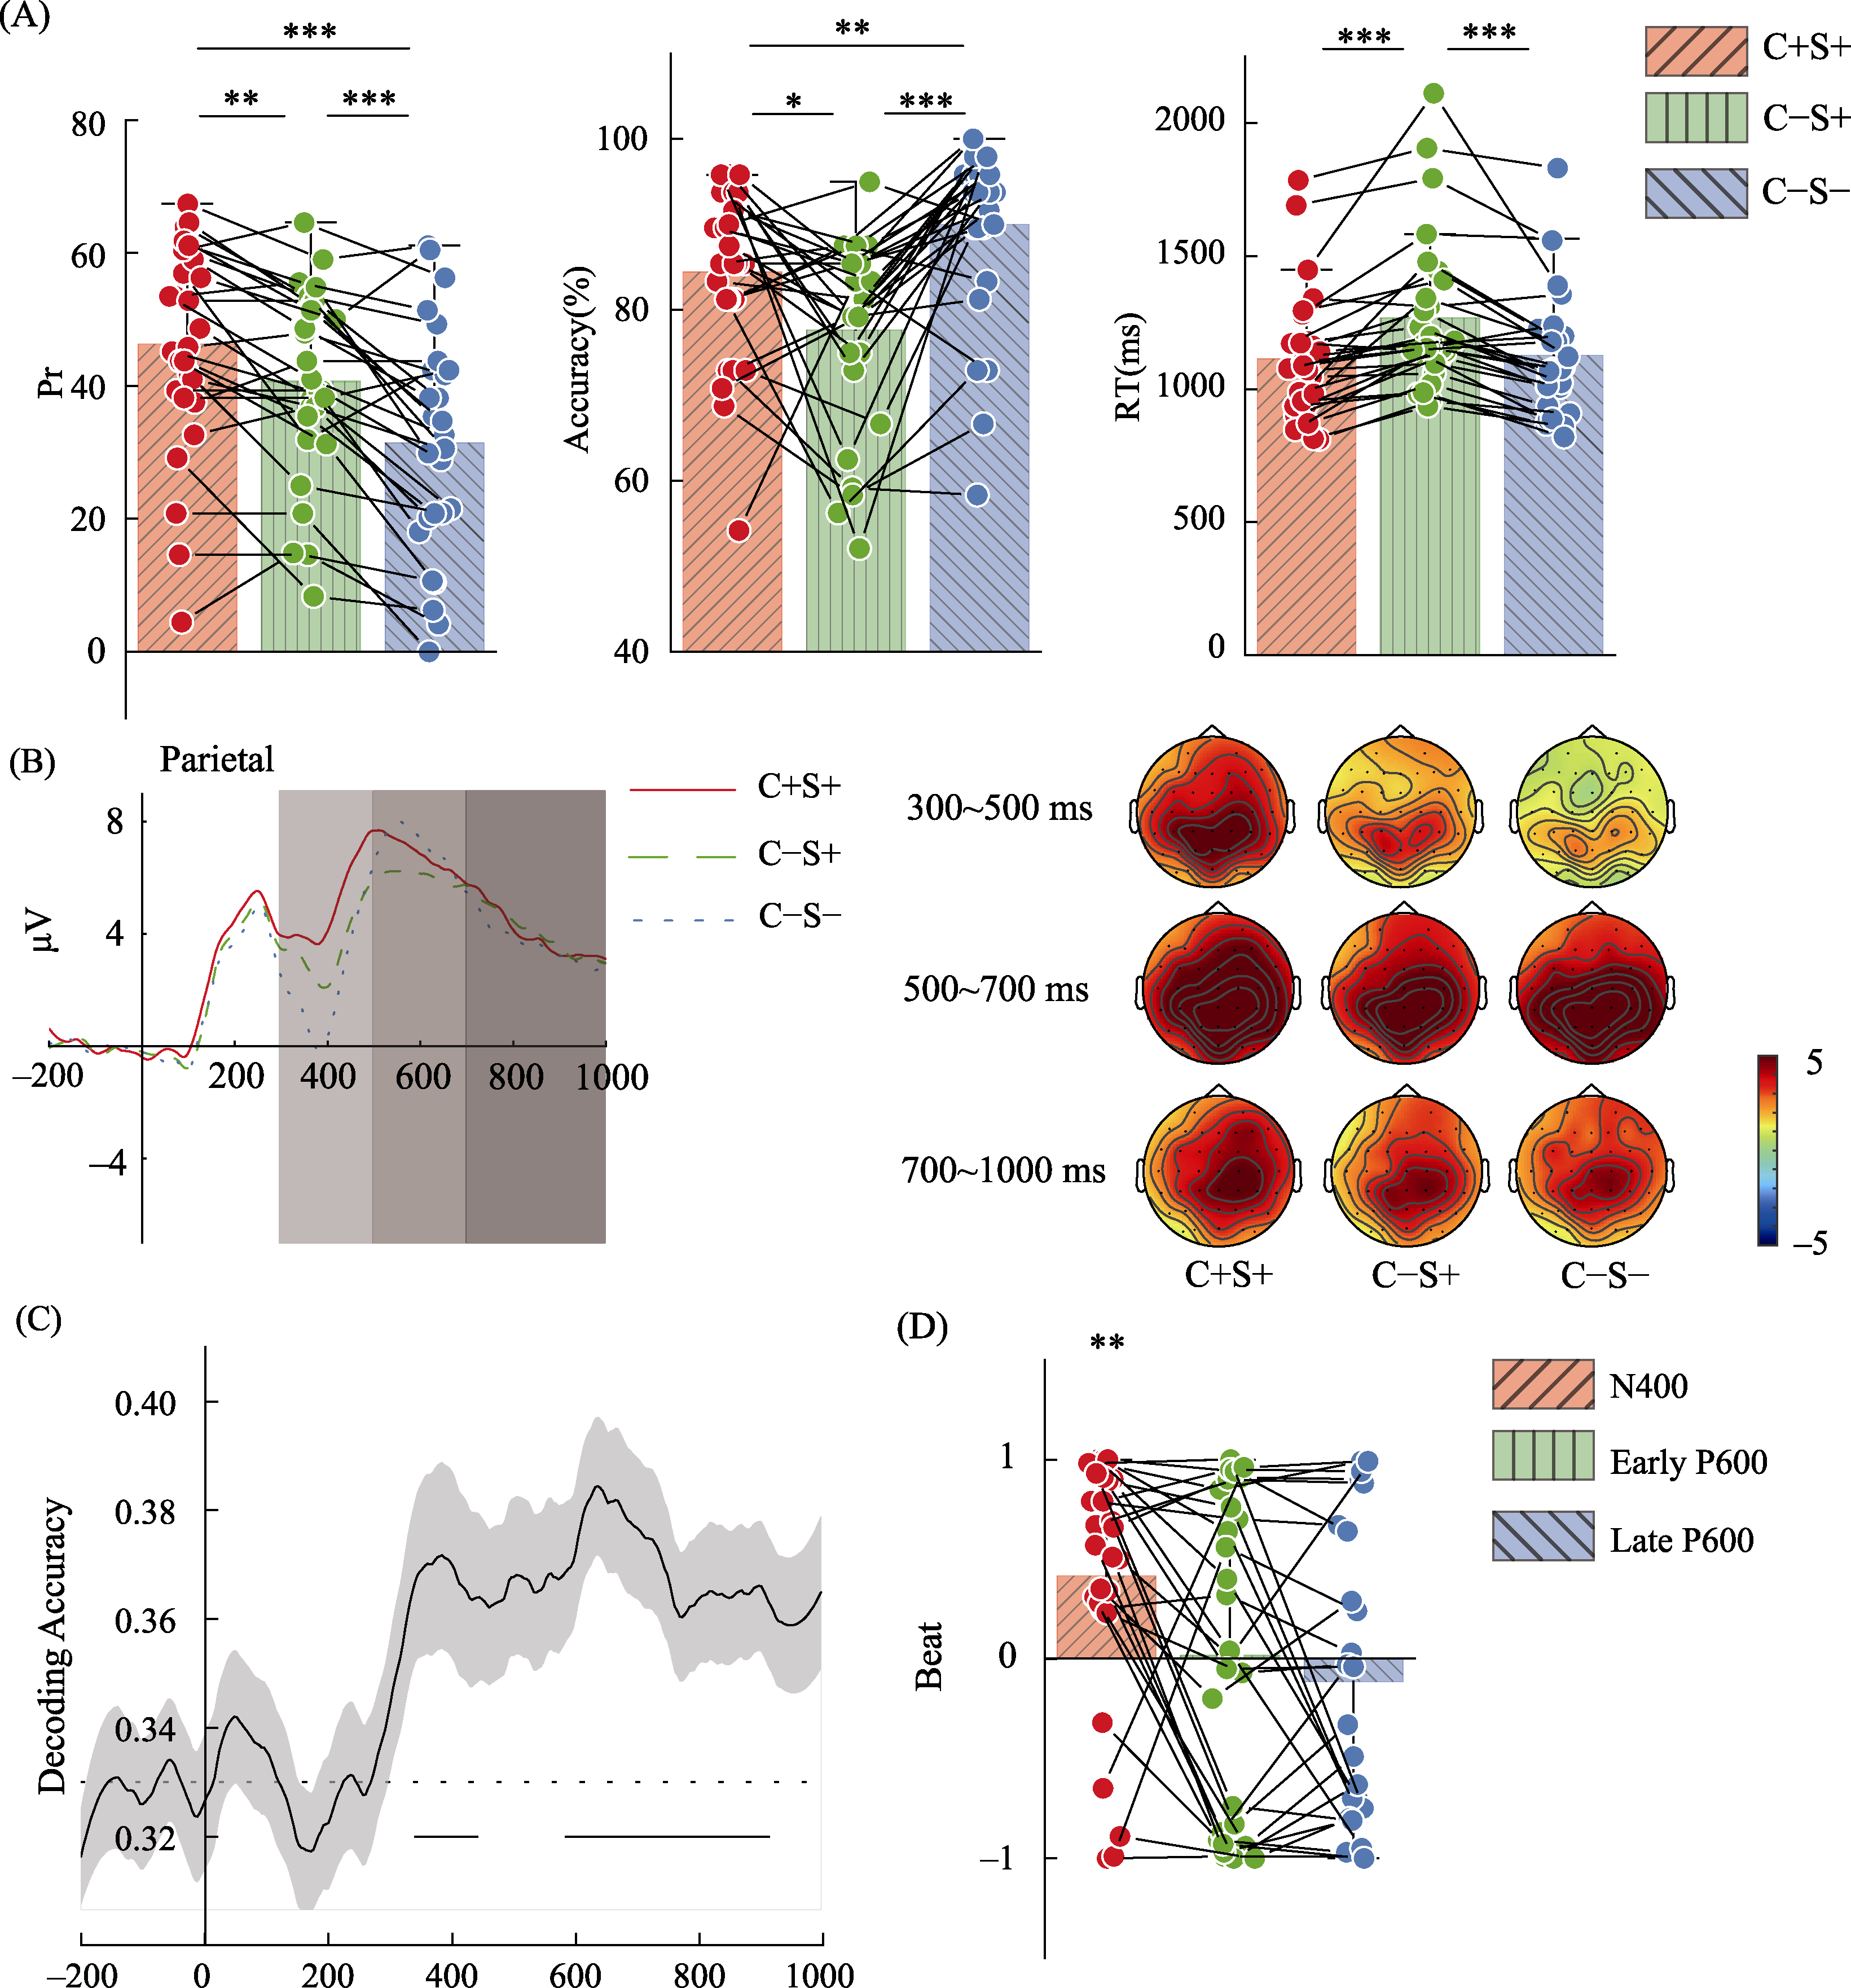
Figure 2. Results of Experiment 1. (A) Behavioral results from experiment 1. Each point shows the data of one participant. *p < 0.05, **p < 0.01, ***p < 0.001. (B) ERP results. The shaded areas indicate the time windows used for statistical analysis (300~500 ms, 500~700 ms, 700~1000 ms). The topography of the corresponding windows is shown on the right side. (C) EEG decoding results. The figure shows the accuracy of LDA in categorizing the three conditions at different time points. The black dashed line indicates the chance level (33.33%), and the horizontal black solid line below indicates the time period when the decoding accuracy was significantly higher than the chance level. (D) Mean regression coefficients for ERP components and Pr, each point represents data from one participant, *p < 0.05, **p < 0.01, ***p < 0.001.
 ), GUO Chunyan1(