ISSN 0439-755X
CN 11-1911/B
CN 11-1911/B
Acta Psychologica Sinica ›› 2022, Vol. 54 ›› Issue (12): 1517-1531.doi: 10.3724/SP.J.1041.2022.01517
• Reports of Empirical Studies • Previous Articles Next Articles
LIU Hong-Zhi3, LI Xingshan1,2, LI Shu1,2,4, RAO Li-Lin1,2( )
)
Received:2022-01-22
Published:2022-12-20
Online:2022-09-23
Contact:
RAO Li-Lin
E-mail:raoll@psych.ac.cn
Supported by:LIU Hong-Zhi, LI Xingshan, LI Shu, RAO Li-Lin. (2022). When expectation-maximization-based theories work or do not work: An eye-tracking study of the discrepancy between everyone and every one. Acta Psychologica Sinica, 54(12), 1517-1531.
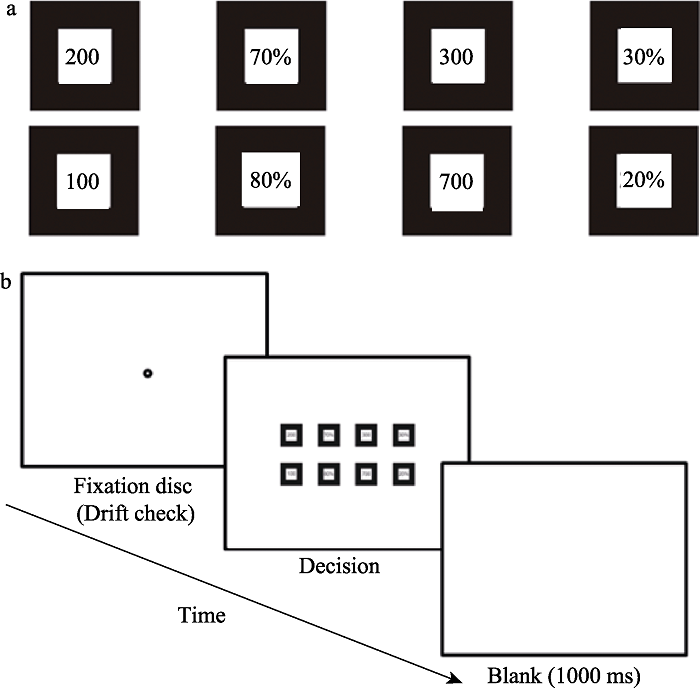
Figure 1. Diagram of stimulation paradigms. (a) Presentation of stimuli. (b) Trial procedure and timing.
| Model | Decision rule |
|---|---|
| Expected value (EV) theory | Calculate the sum of all weighted possible outcomes using the formula Σ pi · xi. Choose the gamble with the highest weighted sum. |
| Expected utility (EU) theory | Calculate the sum of all weighted outcomes using the following formula: Σ pi · u(xi). Choose the gamble with the highest weighted sum. We assumed the utility function u(xi) = log(xi) in this study (Su et al., |
| Cumulative prospect theory (CPT) | Calculate the sum of all weighted outcomes using the following formula: Σ π(pi) · v(xi), π(pi) = piγ/[ piγ + (1 - pi)γ]1/γ, v(xi) = xiα. Choose the gamble with the highest weighted sum. We estimated the values of parameters in individual level. |
| Equate-to-differentiate (ETD) model | Choose the gamble with more attractive gain on the dimension (best or worst payoff) with the greatest intradimensional utility difference. We assumed the utility function u(xi) = log(xi) in this study (Su et al., |
| Maximax heuristic (MH) | Choose the gamble with the highest monetary payoff. |
| Tallying heuristic (TH) | Give a tally mark to the gamble with (a) the higher minimum gain, (b) the higher maximum gain, (c) the lower probability of the minimum gain, and (d) the higher probability of the maximum gain. Select the gamble with the higher number of tally marks. |
Table 1 Decision rules of 6 models tested in predicting choice data
| Model | Decision rule |
|---|---|
| Expected value (EV) theory | Calculate the sum of all weighted possible outcomes using the formula Σ pi · xi. Choose the gamble with the highest weighted sum. |
| Expected utility (EU) theory | Calculate the sum of all weighted outcomes using the following formula: Σ pi · u(xi). Choose the gamble with the highest weighted sum. We assumed the utility function u(xi) = log(xi) in this study (Su et al., |
| Cumulative prospect theory (CPT) | Calculate the sum of all weighted outcomes using the following formula: Σ π(pi) · v(xi), π(pi) = piγ/[ piγ + (1 - pi)γ]1/γ, v(xi) = xiα. Choose the gamble with the highest weighted sum. We estimated the values of parameters in individual level. |
| Equate-to-differentiate (ETD) model | Choose the gamble with more attractive gain on the dimension (best or worst payoff) with the greatest intradimensional utility difference. We assumed the utility function u(xi) = log(xi) in this study (Su et al., |
| Maximax heuristic (MH) | Choose the gamble with the highest monetary payoff. |
| Tallying heuristic (TH) | Give a tally mark to the gamble with (a) the higher minimum gain, (b) the higher maximum gain, (c) the lower probability of the minimum gain, and (d) the higher probability of the maximum gain. Select the gamble with the higher number of tally marks. |
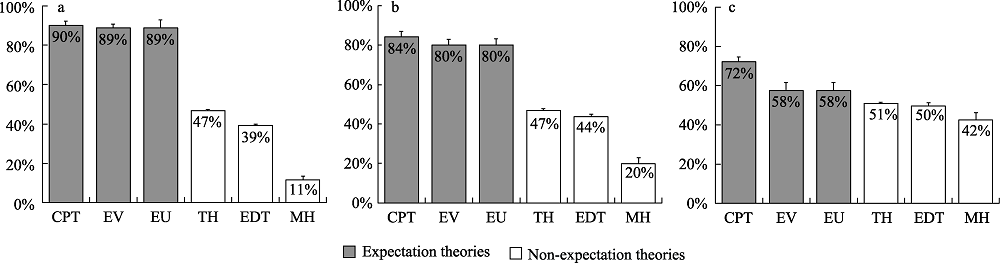
Figure 2. Percentage of choices that were correctly predicted by expectation theories and heuristic/non-expectation theories in (a) the D-everyone task, (b) the D-multiple task, and (3) the D-single task. Error bars represent standard errors of the means.
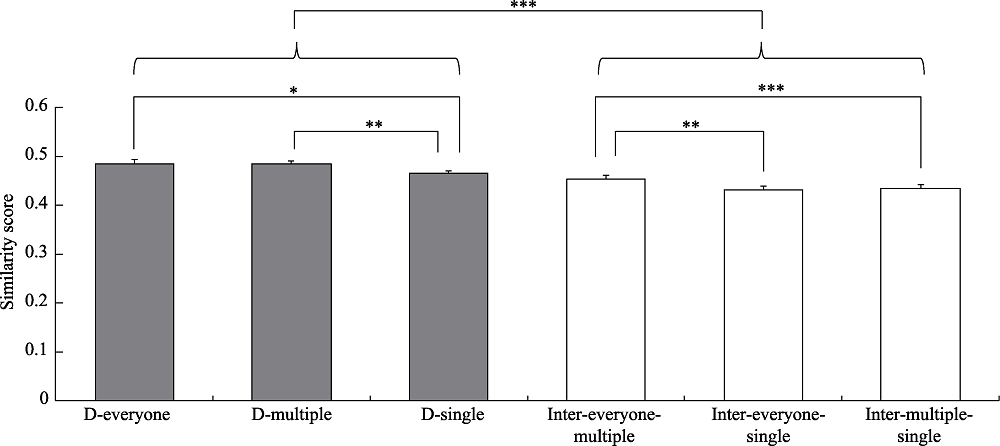
Figure 3. Similarity scores for the intra-task and the inter-task in the D-everyone, D-multiple, and D-single tasks. Error bars represent standard errors of the means. ***p < 0.001,**p < 0.01, *p < 0.05.
| Variable | df | F | p | η2p | Variable | df | F | p | η2p |
|---|---|---|---|---|---|---|---|---|---|
| PTIS | SMI | ||||||||
| Task | 2, 94 | 5.02 | 0.008 | 0.10 | Task | 2, 94 | 8.59 | < 0.001 | 0.16 |
| ED | 2, 94 | 0.19 | 0.827 | 0.00 | ED | 2, 94 | 0.72 | 0.487 | 0.02 |
| OD | 2, 94 | 3.68 | 0.029 | 0.07 | OD | 2, 94 | 0.32 | 0.725 | 0.01 |
| Task × ED | 4, 188 | 1.03 | 0.396 | 0.02 | Task × ED | 4, 188 | 1.60 | 0.177 | 0.03 |
| Task × OD | 4, 188 | 2.96 | 0.021 | 0.06 | Task × OD | 4, 188 | 0.16 | 0.961 | 0.00 |
| ED × OD | 4, 188 | 0.57 | 0.686 | 0.01 | ED × OD | 4, 188 | 6.84 | < 0.001 | 0.13 |
| Task × ED × OD | 8, 376 | 0.93 | 0.488 | 0.02 | Task × ED × OD | 8, 376 | 1.20 | 0.298 | 0.03 |
| MFD | PSTB | ||||||||
| Task | 2, 94 | 10.94 | < 0.001 | 0.19 | Task | 2, 94 | 9.03 | < 0.001 | 0.16 |
| ED | 2, 94 | 22.75 | < 0.001 | 0.33 | ED | 2, 94 | 1.49 | 0.230 | 0.03 |
| OD | 2, 94 | 2.93 | 0.058 | 0.06 | OD | 2, 94 | 5.14 | 0.008 | 0.10 |
| Task × ED | 4, 188 | 5.78 | < 0.001 | 0.11 | Task × ED | 4, 188 | 0.96 | 0.433 | 0.02 |
| Task × OD | 4, 188 | 1.22 | 0.304 | 0.03 | Task × OD | 4, 188 | 0.86 | 0.491 | 0.02 |
| ED × OD | 4, 188 | 3.65 | 0.007 | 0.07 | ED × OD | 4, 188 | 0.33 | 0.860 | 0.01 |
| Task × ED × OD | 8, 376 | 1.79 | 0.079 | 0.04 | Task × ED × OD | 8, 376 | 1.30 | 0.244 | 0.03 |
Table 2 Summary of repeated measures ANOVA on PTIS, MFD, SMI, and PSTB across task, EV difference, and outcome difference
| Variable | df | F | p | η2p | Variable | df | F | p | η2p |
|---|---|---|---|---|---|---|---|---|---|
| PTIS | SMI | ||||||||
| Task | 2, 94 | 5.02 | 0.008 | 0.10 | Task | 2, 94 | 8.59 | < 0.001 | 0.16 |
| ED | 2, 94 | 0.19 | 0.827 | 0.00 | ED | 2, 94 | 0.72 | 0.487 | 0.02 |
| OD | 2, 94 | 3.68 | 0.029 | 0.07 | OD | 2, 94 | 0.32 | 0.725 | 0.01 |
| Task × ED | 4, 188 | 1.03 | 0.396 | 0.02 | Task × ED | 4, 188 | 1.60 | 0.177 | 0.03 |
| Task × OD | 4, 188 | 2.96 | 0.021 | 0.06 | Task × OD | 4, 188 | 0.16 | 0.961 | 0.00 |
| ED × OD | 4, 188 | 0.57 | 0.686 | 0.01 | ED × OD | 4, 188 | 6.84 | < 0.001 | 0.13 |
| Task × ED × OD | 8, 376 | 0.93 | 0.488 | 0.02 | Task × ED × OD | 8, 376 | 1.20 | 0.298 | 0.03 |
| MFD | PSTB | ||||||||
| Task | 2, 94 | 10.94 | < 0.001 | 0.19 | Task | 2, 94 | 9.03 | < 0.001 | 0.16 |
| ED | 2, 94 | 22.75 | < 0.001 | 0.33 | ED | 2, 94 | 1.49 | 0.230 | 0.03 |
| OD | 2, 94 | 2.93 | 0.058 | 0.06 | OD | 2, 94 | 5.14 | 0.008 | 0.10 |
| Task × ED | 4, 188 | 5.78 | < 0.001 | 0.11 | Task × ED | 4, 188 | 0.96 | 0.433 | 0.02 |
| Task × OD | 4, 188 | 1.22 | 0.304 | 0.03 | Task × OD | 4, 188 | 0.86 | 0.491 | 0.02 |
| ED × OD | 4, 188 | 3.65 | 0.007 | 0.07 | ED × OD | 4, 188 | 0.33 | 0.860 | 0.01 |
| Task × ED × OD | 8, 376 | 1.79 | 0.079 | 0.04 | Task × ED × OD | 8, 376 | 1.30 | 0.244 | 0.03 |
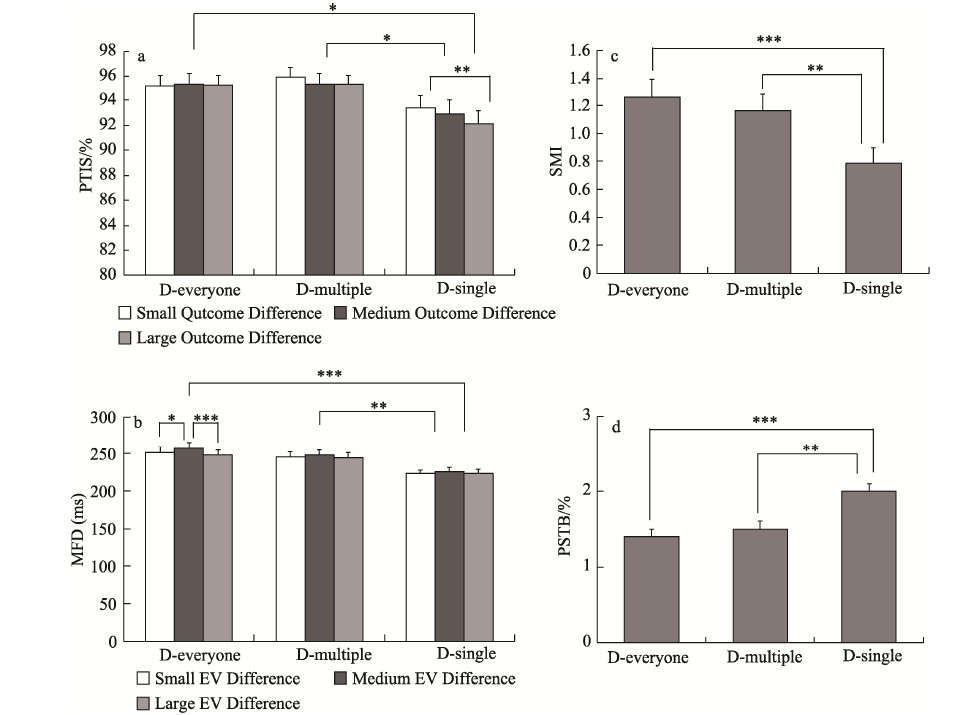
Figure 4. Results of eye-tracking measures. (a) The percentage of total information searched (PTIS). (b) The mean fixation duration (MFD). (c) The alternative-based versus dimension-based search measure index (SMI). (d) The proportion of the saccades between the two best outcomes (PSTB). Error bars represent standard errors of the means. ***p < 0.001, **p < 0.01, *p < 0.05.
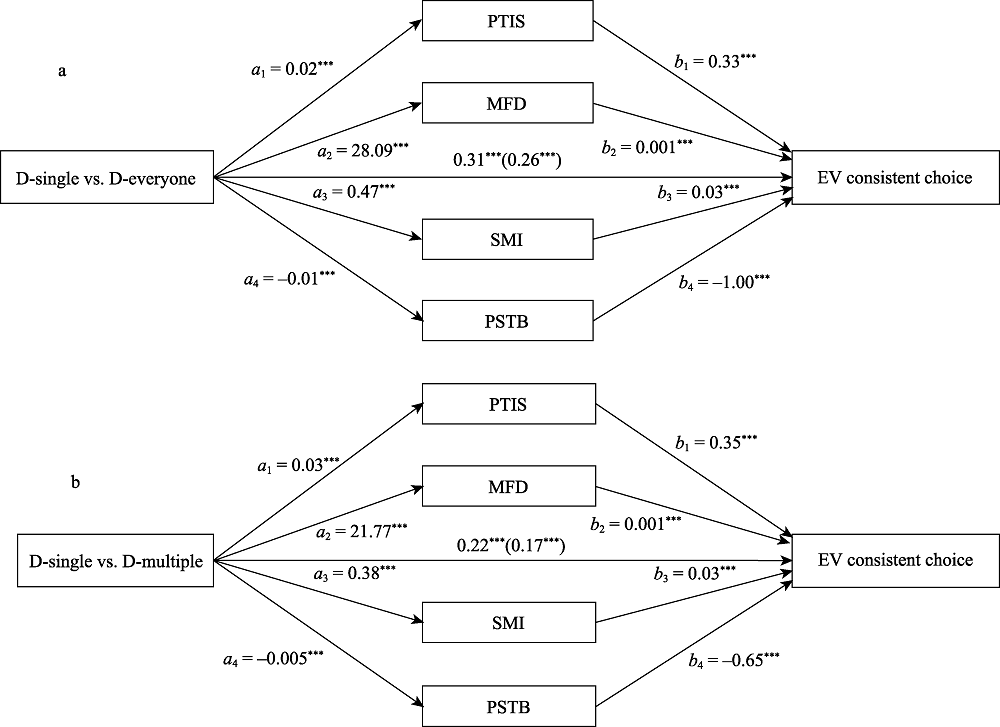
Figure 5. Results of mediation analysis. (a) Mediating effect of eye-tracking measures on the relationship between task (D-single task vs. D-everyone task) and the percentage of the EV-consistent choice. (b) Mediating effect of eye-tracking measures on the relationship between task (D-single task vs. D-multiple task) and EV-consistent choice. ***p < 0.001.
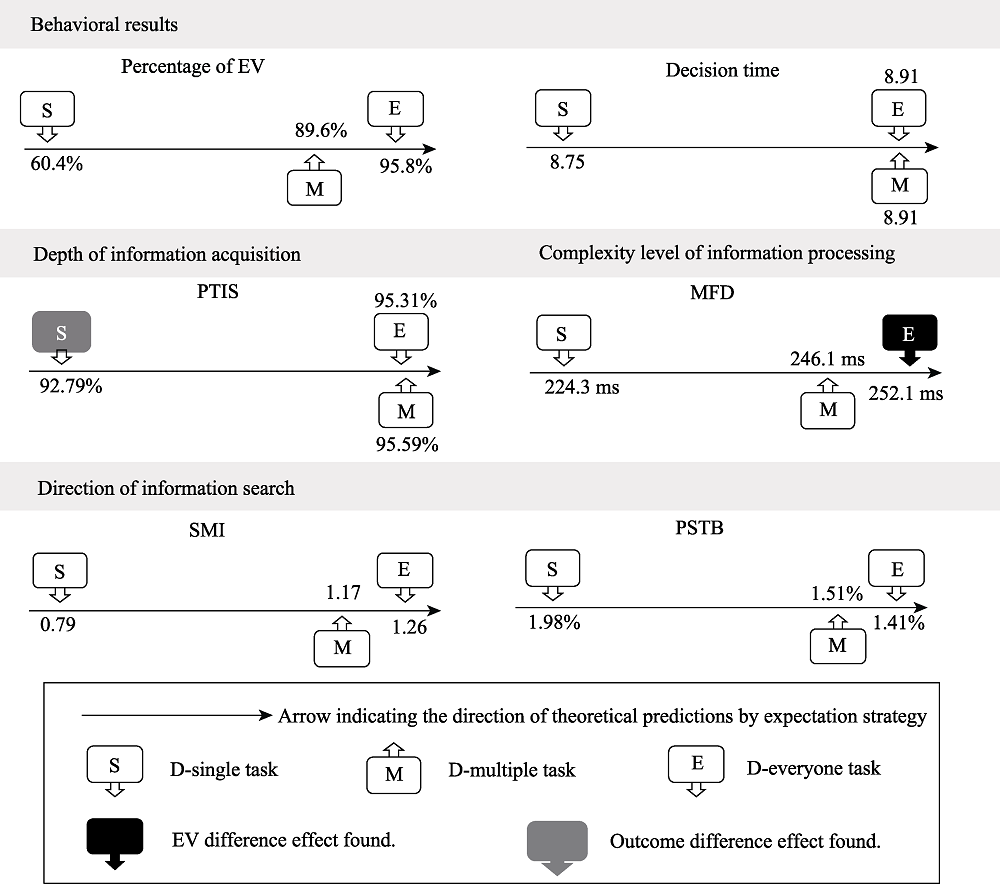
Figure 6. Overview of behavioral and eye movement results.
| [1] |
Ashby, N. J. S., Johnson, J. G., Krajbich, I., & Wedel, M. (2016). Applications and innovations of eye-movement research in judgment and decision making. Journal of Behavioral Decision Making, 29, 96-102.
doi: 10.1002/bdm.1956 URL |
| [2] |
Böckenholt, U., & Hynan, L. S. (1994). Caveats on a process-tracing measure and a remedy. Journal of Behavioral Decision Making, 7(2), 103-117.
doi: 10.1002/bdm.3960070203 URL |
| [3] |
Baron, J. (1986). Tradeoffs among reasons for action. Journal for the Theory of Social Behavior, 16(2), 173-195.
doi: 10.1111/j.1468-5914.1986.tb00074.x URL |
| [4] | Baron, J. (2008). Thinking and deciding (4th ed.). Cambridge, England: Cambridge University Press. |
| [5] |
Bazerman, M. H., Tenbrunsel, A. E., & Wade-Benzoni, K. (1998). Negotiating with yourself and losing: Making decisions with competing internal preferences. Academy of Management Review, 23(2), 225-241.
doi: 10.2307/259372 URL |
| [6] |
Beisswanger, A. H., Stone, E. R., Hupp, J. M., & Allgaier, L. (2003). Risk taking in relationships: Differences in deciding for oneself versus for a friend. Basic and Applied Social Psychology, 25(2), 121-135.
doi: 10.1207/S15324834BASP2502_3 URL |
| [7] | Bernoulli, D. (1738). Specimen theoriae novae de mensura sortis [Exposition of a new theory on the measurement of risk]. Commentarii Academiae Scientiarum Imperialis Petropolitanae, 5, 175-192. |
| [8] | Birnbaum, M. H. (2008). New tests of cumulative prospect theory and the priority heuristic: Probability-outcome tradeoff with branch splitting. Judgment and Decision Making, 3(4), 304-316. |
| [9] |
Bouma, H. (1970). Interaction effects in parafoveal letter recognition. Nature, 226, 177-178.
doi: 10.1038/226177a0 URL |
| [10] |
Brandstätter, E., Gigerenzer, G., & Hertwig, R. (2006). The priority heuristic: Making choices without trade-offs. Psychological Review, 113(2), 409-432.
doi: 10.1037/0033-295X.113.2.409 pmid: 16637767 |
| [11] |
Brandstätter, E., Gigerenzer, G., & Hertwig, R. (2008). Risky choice with heuristics: Reply to Birnbaum (2008), Johnson, Schulte- Mecklenbeck, & Willemsen (2008) and Rieger & Wang (2008). Psychological Review, 115(1), 281-289.
doi: 10.1037/0033-295X.115.1.281 pmid: 18211205 |
| [12] |
Brandstätter, E., & Körner, C. (2014). Attention in risky choice. Acta Psychologica, 152, 166-176.
doi: 10.1016/j.actpsy.2014.08.008 pmid: 25226548 |
| [13] |
Cristino, F., Mathot, S., Theeuwes, J., & Gilchrist, I. D. (2010). ScanMatch: A novel method for comparing fixation sequences. Behavior Research Methods, 42(3), 692-700.
doi: 10.3758/BRM.42.3.692 pmid: 20805591 |
| [14] | DeKay, M. L., Hershey, J. C., Spranca, M. D., Ubel, P. A., & Asch, D. A. (2006). Are medical treatments for individuals and groups like single-play and multiple-play gambles? Judgment and Decision Making, 1(2), 134-145. |
| [15] |
DeKay, M. L., & Kim, T. G. (2005). When things don't add up the role of perceived fungibility in repeated-play decisions. Psychological Science, 16(9), 667-672.
doi: 10.1111/j.1467-9280.2005.01593.x URL |
| [16] | Durrett, R. (2010). Probability: Theory and Examples (4th ed.). New York: Cambridge University Press. |
| [17] |
Edwards, W. (1962). Subjective probabilities inferred from decisions. Psychological Review, 69(2), 109-135.
doi: 10.1037/h0038674 URL |
| [18] |
Faul, F., Erdfelder, E., Lang, A. G., & Buchner, A. (2007). G*Power 3: A flexible statistical power analysis program for the social, behavioral, and biomedical sciences. Behavior Research Methods, 39(2), 175-191.
doi: 10.3758/bf03193146 pmid: 17695343 |
| [19] | Gigerenzer, G. (2004). Fast and frugal heuristics: The tools of bounded rationality. In D. Koehler & N. Harvey (Eds.), Blackwell handbook of judgment and decision making (pp.62-88). Oxford, United Kingdom: Blackwell. |
| [20] |
Hopstaken, J. F., van der Linden, D., Bakker, A. B., & Kompier, M. A. (2015). A multifaceted investigation of the link between mental fatigue and task disengagement. Psychophysiology, 52(3), 305-315.
doi: 10.1111/psyp.12339 pmid: 25263028 |
| [21] |
Hsee, C. K., & Weber, E. U. (1997). A fundamental prediction error: Self-others discrepancies in risk preference. Journal of Experimental Psychology: General, 126(1), 45-53.
doi: 10.1037/0096-3445.126.1.45 URL |
| [22] |
Huang, Y., Shen, S., Yang, S., Kuang, Y., Li, Y., & Li, S. (2021). Asymmetrical property of the subproportionality of weighting function in prospect theory: Is it real and how can it be achieved? Symmetry, 13(10), 1928.
doi: 10.3390/sym13101928 URL |
| [23] | Kahneman, D., Sibony, O., & Sunstein, C. R. (2021). Noise: A Flaw in Human Judgment. Glasgow, Scotland: William Collins Publishers. |
| [24] |
Kahneman, D., & Lovallo, D. (1993). Timid choices and bold forecasts: A cognitive perspective on risk taking. Management Science, 39(1), 17-31.
doi: 10.1287/mnsc.39.1.17 URL |
| [25] |
Kahneman, D., & Tversky, A. (1979). Prospect theory: An analysis of decision under risk. Econometrica: Journal of the Econometric Society, 47(2), 263-292.
doi: 10.2307/1914185 URL |
| [26] |
Klos, A., Weber, E. U., & Weber, M. (2005). Investment decisions and time horizon: Risk perception and risk behavior in repeated gambles. Management Science, 51(12), 1777-1790.
doi: 10.1287/mnsc.1050.0429 URL |
| [27] |
Langer, T., & Weber, M. (2001). Prospect theory, mental accounting, and differences in aggregated and segregated evaluation of lottery portfolios. Management Science, 47(5), 716-733.
doi: 10.1287/mnsc.47.5.716.10483 URL |
| [28] |
Li, S. (2003). The role of expected value illustrated in decision-making under risk: Single-play vs multiple-play. Journal of Risk Research, 6(2), 113-124.
doi: 10.1080/1366987032000078893 URL |
| [29] |
Li, S. (2004). A behavioral choice model when computational ability matters. Applied Intelligence, 20, 147-163.
doi: 10.1023/B:APIN.0000013337.01711.c7 URL |
| [30] | Li, S. (2016). An equate-to-differentiate way of decision-making. Shanghai, China: East China Normal University Press. |
| [31] |
Liu, H. Z., Jiang, C. M., Rao, L. L., & Li, S. (2015). Discounting or priority: Which rule dominates the intertemporal choice process? Acta Psychologica Sinica, 47(4), 522-532.
doi: 10.3724/SP.J.1041.2015.00522 URL |
| [32] | Liu, H. Z., Wei, Z. H., & Li, P. (2021). Influence of the manner of information presentation on risky choice. Frontiers in Psychology, 12, 605206. |
| [33] |
Liu, H. Z., Zhou, Y. B., Wei, Z. H., & Jiang, C. M. (2020). The power of last fixation: Biasing simple choices by gaze-contingent manipulation. Acta Psychologica, 208, 103106.
doi: 10.1016/j.actpsy.2020.103106 URL |
| [34] |
Luce, R. D., & Fishburn, P. C. (1991). Rank-and sign-dependent linear utility models for finite first-order gambles. Journal of Risk and Uncertainty, 4(1), 29-59.
doi: 10.1007/BF00057885 URL |
| [35] |
Mengarelli, F., Moretti, L., Faralla, V., Vindras, P., & Sirigu, A. (2014). Economic decisions for others: An exception to loss aversion law. PLoS One, 9(1), e85042.
doi: 10.1371/journal.pone.0085042 URL |
| [36] |
Montoya, A. K., & Hayes, A. F. (2017). Two-condition within- participant statistical mediation analysis: A path-analytic framework. Psychological Methods, 22(1), 6-27.
doi: 10.1037/met0000086 pmid: 27362267 |
| [37] |
Needleman, S. B., & Christian, C., D. (1970). A general method applicable to the search for similarities in the amino acid sequence of two proteins. Journal of Molecular Biology, 48(3), 443-453.
doi: 10.1016/0022-2836(70)90057-4 pmid: 5420325 |
| [38] |
Noton, D., & Stark, L. (1971). Scanpaths in eye movements during pattern perception. Science, 171, 308-311.
pmid: 5538847 |
| [39] |
Pachur, T., Hertwig, R., Gigerenzer, G., & Brandstätter, E. (2013). Testing process predictions of models of risky choice: A quantitative model comparison approach. Frontiers in Psychology, 4, 646.
doi: 10.3389/fpsyg.2013.00646 pmid: 24151472 |
| [40] |
Payne, J. W., & Braunstein, M. L. (1978). Risky choice: An examination of information acquisition behavior. Memory & Cognition, 6(5), 554-561.
doi: 10.3758/BF03198244 URL |
| [41] |
Polman, E. (2012). Self-other decision making and loss aversion. Organizational Behavior and Human Decision Processes, 119(2), 141-150.
doi: 10.1016/j.obhdp.2012.06.005 URL |
| [42] |
Popovic, N. F., Pachur, T., & Gaissmaier, W. (2019). The gap between medical and monetary choices under risk persists in decisions for others. Journal of Behavioral Decision Making, 32(4), 388-402.
doi: 10.1002/bdm.2121 URL |
| [43] |
Quiggin, J. (1982). A theory of anticipated utility. Journal of Economic Behavior & Organization, 3(4), 323-343.
doi: 10.1016/0167-2681(82)90008-7 URL |
| [44] |
Rao, L. L., Liu, X. N., Li, Q., Zhou, Y., Liang, Z. Y., Sun, H. Y., ... Li, S. (2013). Toward a mental arithmetic process in risky choices. Brain and Cognition, 83(3), 307-314.
doi: 10.1016/j.bandc.2013.09.009 pmid: 24128658 |
| [45] |
Rao, L. L., Zhou, Y., Xu, L., Liang, Z. Y., Jiang, T., & Li, S. (2011). Are risky choices actually guided by a compensatory process? New insights from fMRI. PLoS One, 6(3), e14756.
doi: 10.1371/journal.pone.0014756 URL |
| [46] |
Rayner, K. (2009). Eye movements and attention in reading, scene perception, and visual search. The Quarterly Journal of Experimental Psychology, 62(8), 1457-1506.
doi: 10.1080/17470210902816461 URL |
| [47] |
Savage, L. J. (1951). The theory of statistical decision. Journal of the American Statistical Association, 46(253), 55-67.
doi: 10.1080/01621459.1951.10500768 URL |
| [48] | Savage, L. J. (1954). The foundations of statistics. New York: Wiley. |
| [49] |
Schmidt, U., Starmer, C., & Sugden, R. (2008). Third-generation prospect theory. Journal of Risk and Uncertainty, 36(3), 203-223.
doi: 10.1007/s11166-008-9040-2 URL |
| [50] |
Su, Y., Rao, L. L., Sun, H. Y., Du, X. L., Li, X., & Li, S. (2013). Is making a risky choice based on a weighting and adding process? An eye-tracking investigation. Journal of Experimental Psychology: Learning, Memory and Cognition, 39(6), 1765-1780.
doi: 10.1037/a0032861 URL |
| [51] |
Sui, X. Y., Liu, H. Z., & Rao, L. L. (2020). The timing of gaze- contingent decision prompts influences risky choice. Cognition, 195, 104077.
doi: 10.1016/j.cognition.2019.104077 URL |
| [52] |
Sun, H. Y., Rao, L. L., Zhou, K., & Li, S. (2013). Formulating an emergency plan based on expectation-maximization is one thing, but applying it to a single case is another. Journal of Risk Research, 17(7), 785-814.
doi: 10.1080/13669877.2013.816333 URL |
| [53] | Sun, H. Y., Su, Y., Zhou, K., & Li, S. (2011). From multiple-play to single-play in risky decision making: Quantitative change or qualitative change?. Advances in Psychological Science, 19(10), 1417-1425. |
| [54] |
Tversky, A., & Kahneman, D. (1992). Advances in prospect theory: Cumulative representation of uncertainty. Journal of Risk and Uncertainty, 5(4), 297-323.
doi: 10.1007/BF00122574 URL |
| [55] | van der Stoep, S. W., & Seifert, C. M. (1994). Problem solving, transfer, and thinking. In P. R. Pintrich, D. R. Brown, & C. E. Weinstein (Eds.) Student motivation, cognition, and learning: Essays in honor of Wilbert J. McKeachie (pp.27-49). Hillstale, NJ: Erlbaum. |
| [56] |
Velichkovsky, B. M., Rothert, A., Kopf, M., Dornhöfer, S. M., & Joos, M. (2002). Towards an express-diagnostics for level of processing and hazard perception. Transportation Research Part F: Traffic Psychology and Behaviour, 5(2), 145-156.
doi: 10.1016/S1369-8478(02)00013-X URL |
| [57] | Vinod, H. R. D., & Reagle, D. (2005). Preparing for the worst: Incorporating downside risk in stock market investments. Hoboken, NJ: Wiley. |
| [58] | von Neumann, J., & Morgenstern, O. (1947). Theory of games and economic behavior. Princeton, NJ: Princeton University Press. |
| [59] |
Wei, Z. H., & Li, X. (2015). Decision process tracing: Evidence from eye- movement data. Advances in Psychological Science, 23(12), 2029-2041.
doi: 10.3724/SP.J.1042.2015.02029 URL |
| [60] |
Zhang, Y. Y., Zhou, L., You, X., Li, S., & Liang, Z. Y. (2018). Is intertemporal decision-making based on a temporal discounting process? Evidence from double-dissociation paradigm. Scientia sinica Vitae, 48(5), 592-608.
doi: 10.1360/N052017-00104 URL |
| [61] |
Zhou, L., Zhang, Y. Y., Wang, Z. J., Rao, L. L., Wang, W., Li, S., ... Liang, Z. Y. (2016). A scanpath analysis of the risky decision- making process. Journal of Behavioral Decision Making, 29(2-3), 169-182.
doi: 10.1002/bdm.1908 URL |
| [62] | Zhou, Y. B., Li, Q., & Liu, H. Z. (2021). Visual attention and time preference reversals. Judgment and Decision Making, 16(4), 1010-1038. |
| Viewed | ||||||
|
Full text |
|
|||||
|
Abstract |
|
|||||