

1 引言
心理学研究的目的在于“描述、解释、预测和影响行为” (彭运石, 李璜, 2011; Lippke & Ziegelmann, 2010), 探究变量间的关系是实现该目的必不可少的部分。回归分析作为一类评价变量间关系的方法, 其思想已得到广泛推广, 并且在各种主流统计分析软件中都可实现。回归分析是社会科学领域中最基础、最经典的定量分析方法(谢宇, 2010), 许多常见的统计检验(如, 方差分析)也可以视作是线性回归模型的特例。回归模型的一般公式可以表示为:
该模型包含p个预测变量, 其中${{\beta }_{0}}$为截距项, ${{\beta }_{j}}$表示第j个预测变量的回归系数(j = 1,2…p), ${{y}_{i}}$表示第i个被试在结果变量上的观测值, ${{x}_{ij}}$表示第i个被试在第j个预测变量上的观测值, ${{\varepsilon }_{i}}$为残差项。
回归分析常被用于探索变量间的关系, 同时也可以帮助研究者对结果变量进行预测。在采用回归模型分析数据的心理学研究中, 最小二乘法(Ordinary Least Square, OLS)是最常用的模型系数估计方法(Helwig, 2017)。OLS方法通过最小化结果变量的预测值与观测值之间的误差来估计回归模型中的参数, 可以针对当前样本提供最准确的线性无偏估计(Chartterjee, Hadi, & Price, 2000; Chartterjee & Hadi, 2006; Fomby, Hill, & Johnson, 1984; Maddala, 2002)。
但OLS方法关注于对当前数据集的无偏估计, 容易导致模型发生过拟合现象(Yarkoni & Westfall, 2017), 即基于当前样本得到的回归模型结果在拟合同一总体的其他样本数据或用于预测未来观测数据时表现不佳, 这一问题在预测变量较多, 变量之间存在较高共线性或数据信噪比较低的情况下更为严重(Babyak, 2004; Helwig, 2017; McNeish, 2015)。过拟合的模型中往往会纳入不必要的冗余变量, 并高估了部分预测因素的作用, 削弱了模型的简约性(Babyak, 2004; Cohen et al., 2003; Derksen & Keselman, 1992)。这些问题会对模型结论的推广和预测造成不可忽略的影响。
随着机器学习领域的蓬勃发展, 涌现出了越来越多的统计工具用以弥补传统方法的局限。其中以Lasso (Least absolute shrinkage and selection operator; Tibshirani, 1996)方法为代表的正则化(regularization)方法可以有效优化OLS估计、处理过拟合问题(Candes & Tao, 2007;Tibshirani, 1996; Tibshirani, Saunders, Rosset, Zhu, & Knight, 2005; Zou, 2006; Zou & Hastie, 2005)。正则化方法通过在模型估计中增加惩罚项的方式可以将过小的回归系数压缩到0, 以一定的估计偏差为代价从而获得更高的模型预测准确度和模型概化能力。该方法能够将冗余预测变量的估计系数压缩为0, 在压缩系数的同时起到变量筛选的作用, 可以有效避免由于过拟合导致的模型概化能力不足的问题, 获得更简约且具有较高预测效率的模型, 有助于心理学理论的构建和完善。
Lasso正则化方法自提出后吸引了诸多研究者的关注(Zou, Hastie, & Tibshirani, 2007):由于该方法在变量筛选和模型稳定性上的出色表现, 医学、经济学、神经科学等领域已有许多研究者采用Lasso方法建立模型进行预测(e.g., Fontanarosa & Dai, 2011; Lee et al., 2014; Nguyen, Duong, Venkatesh, & Phung, 2015)。但是在神经科学以外的心理学领域中, 对Lasso方法的运用却非常少(Johnson & Sinharay, 2011; McNeish, 2015; Yarkoni & Westfall, 2017)。其阻碍主要来自于对正则化等机器学习方法可解释性的质疑, 这类方法常常不依赖于传统的假设检验, 更多地采用数据驱动的方式进行探索和预测, 因而被认为是一个“黑匣子”。吴喜之(2019)指出, 事实上回归模型中单个回归系数同样不具备可解释性。例如, 在回归模型的结果报告中, 通常会出现这样的描述:“当保持其它预测变量不变时, 该预测变量每变化一个单位, 因变量变化β个单位”, 但是这个前提条件几乎不可能成立。而除了研究结论的解释之外, 模型的概化能力及预测能力同样值得关注。
在心理学研究中, 以往由于受到计算机计算能力以及传统统计方法的限制, 研究者在验证理论、检验变量间关系时, 主要采用假设检验的方式。随着这类方法的普遍应用, 其局限日益突出, 过拟合问题和可重复性危机也日益受到重视(胡传鹏 等, 2016; Nuzzo, 2014)。随着机器学习领域的蓬勃发展, 新兴的数据科学工具已经在医疗健康等众多领域发挥出了巨大价值, 在心理学领域, 提升研究结论的预测能力将会成为未来重要的发展趋势(Yarkoni & Westfall, 2017)。
本文希望以Lasso方法为例, 从理论出发, 结合实例分析与具体应用现状, 全面地为心理学研究者介绍Lasso回归的原理、实现步骤和优势, 呼吁研究者在样本量较少或变量数目较多时采用更稳健的Lasso回归法来提升研究结论的可推广性。此外, 本文还将介绍Lasso方法的多种扩展形式, 及其在网络分析、潜变量建模中的应用。希望能够为研究者的实际应用提供参考, 促进更多心理学研究者关注此类新兴的数据科学工具, 以数据科学助力心理学的发展。
2 传统方法及其局限
在标准的OLS回归中, 回归模型的参数估计可以通过最小化损失函数得到, 即最小化观察值与预测值之间的垂直平方距离, OLS估计的损失函数公式具体如下(McNeish, 2015):
其中${{L}^{OLS}}$是损失函数, 假定n为观察值个数, p为预测变量个数(包括截距项), X(n×p)和Y(n×1)分别是预测变量矩阵和结果变量向量, $\beta $(p×1)是回归系数向量。
通过最小化${{L}^{OLS}}$, OLS回归能够得到最好的线性无偏估计量$\text{ }\!\!~\!\!\text{ }{{\overset{\scriptscriptstyle\frown}{\beta }}^{OLS}}$(Best Linear Unbiased Estimator, BLUE), 而且OLS估计的计算负担小, 可以满足心理学领域的很多建模情境。但是, 当研究中包含的预测变量数目较多时, OLS估计法存在以下几点局限:
一是过度拟合(Overfit), 即建立的回归模型过于复杂, 其中一些参数的显著性是由于抽样变异性(Sampling Variability)导致的, 使得模型只适用于当前样本, 缺乏概化能力(Generalizability)。
回归模型的预测误差可以被分解为偏差和方差两部分, 其中偏差指预测值和真实值之间的差异, 方差指预测值的离散情况。OLS估计旨在通过控制估计偏差来降低模型的预测误差, 但是参数的样本间方差会因此而增大, 当前的参数估计结果可能仅适用于当前数据集, 且估计结果易受到不同样本的微小波动的影响(如图1a所示, 尽管模型对数据点的拟合较为准确, 偏差较小, 但这样的模型可能并不适用于其它样本), 容易出现过拟合现象。过拟合现象会导致模型在高估回归系数的同时低估其标准误, 容易导致模型中无关联的冗余变量被发现存在显著的预测作用, 模型得到的结果可能仅适用于当前样本而无法推广到总体。当观察值个数n与预测变量个数p的比率越低时(即样本量不足), 参数被错误解读的风险也越大(Babyak, 2004; Derksen & Keselman, 1992)。
图1
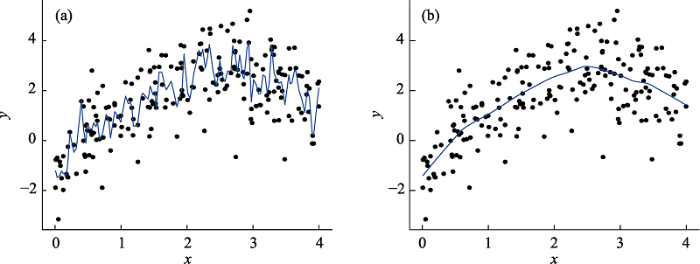
相反地, 如果使用当前数据集获得的参数估计存在着可以接受的偏差, 那么参数的样本间方差会因有偏估计而减小, 这样的估计结果反而具有更强的概化能力(如图1b所示)。因此, 在实际数据分析中我们需要很好地处理这种偏差-方差权衡(Bias-Variance Tradeoff)问题。而传统的OLS估计关注对当前数据集的精确估计, 在预测变量较多时不可避免地容易出现过拟合的估计结果, 进而削弱模型的概化能力。
此外, 当模型存在较多的预测变量时, 我们往往会采用逐步回归(Stepwise Regression)等方法增加或删减变量, 以获得有效的预测变量集。但是该方法违背了回归分析推论的前提假设, 即所有预测变量是作为整体固定存在的(Lockhart et al., 2014), 过度拟合带来的问题在使用逐步回归法进行模型选择时也会更加突出。此时用于统计推断的t检验或F检验不仅无法遵循其适合的零假设分布, 也无法拥有合适的自由度进行分析, 基本的统计检验及其相关的p值将不适用于不断增减变量的模型选择。这种模型选择可能会使回归系数假设检验的一类错误率增大(Wilkinson, 1979)。
3 Lasso方法
3.1 Lasso方法介绍
相较于上文提及的OLS估计, 正则化方法在OLS损失函数的基础上引入了惩罚函数, 以惩罚过于复杂的模型。其具体公式可以表示为:
其中, ${{L}^{Reg}}\left( \beta \right)$是惩罚后的损失函数, ${{L}^{OLS}}\left( \beta \right)$表示标准OLS损失函数, $P\left( \beta \right)$表示惩罚函数, $\text{ }\!\!\lambda\!\!\text{ }\left( \ge 0 \right)$表示调整参数(Tuning Parameter), 用于控制回归系数压缩的程度, 数值越大则惩罚力度越强。当$\text{ }\!\!\lambda\!\!\text{ }=0$时, 损失函数不对模型进行惩罚, ${{L}^{Reg}}\left( \beta \right)$即为OLS损失函数。而不同的惩罚函数$P\left( \beta \right)$则对应于不同的正则化方法。
Lasso方法作为正则化方法的一种, 它以回归系数的绝对值之和作为惩罚函数来压缩回归系数, 即 ${{P}^{\text{Lasso}}}\left( \beta \right)=\text{ }\!\!\lambda\!\!\text{ }\underset{j=1}{\overset{p}{\mathop \sum }}\,\left| {{\beta }_{j}} \right|$, 在参数估计中, 由于绝对值符号难以进行拆解运算, 可以将$\left| {{\beta }_{j}} \right|$转换为$\pm 1*{{\beta }_{j}}$, 其中+1或-1的具体符号与${{\beta }_{j}}$的符号一致。即Lasso损失函数的公式可以表示为(McNeish, 2015):
上述公式中, ${{L}^{\text{Lasso}}}$指Lasso回归模型的损失函数, X(n×p)、Y(n×1)和β(p×1)分别是预测变量矩阵、结果变量向量和回归系数向量, 而W(p×1)则是值为±1 (符号与β向量中对应的数值一致)的向量。
相比其他正则化方法, 如, Ridge正则化采用回归系数的平方和为惩罚函数, 对较小的回归系数估计值压缩力度更小, 难以将冗余预测变量的系数压缩为0, 且对较重要的回归系数更容易进行过度压缩(Hesterberg, Choi, Meier, & Fraley, 2008)。Lasso方法可以直接将冗余预测变量的回归系数压缩到0进而发挥变量选择的作用, 获得精简且更有效率的预测变量集(Tibshirani, 1996), 同时也可以减少对重要回归系数的过度压缩。
Yarkoni和Westfall (2017)指出, 相比于OLS估计法, Lasso方法获得的模型通常能够更好地推广到新的数据集中。在OLS回归模型中, 模型的R2 (即结果变量的被解释率)通常会随着模型的复杂度增加。而Lasso方法不仅仅关注于解释当前的数据集(即得到更高的R2), 也希望能够获得更简洁的模型以更好地推广到总体中。Lasso方法从解释向预测的转变使得研究不仅仅指向于过去(即对当前数据集的解释), 同时也关注于未来(对新数据集的预测能力)。这一特性不仅有助于心理学理论的构建和完善, 同时也可以一定程度上减少可重复性危机的影响。
此外, Lasso方法也避免了在预测变量过多时采用OLS估计带来的过拟合和多重共线性的问题。而理论不完善且预测变量间存在共线性是心理学领域中较为常见的现象。当研究者的理论假设并不明确时, 采用包含多重检验修正的验证性方法(如逐步回归)从理论上来说是错误的(Serang, Jacobucci, Brimhall, & Grimm, 2017), 后纳入的变量在这种情况下常常会因为与之前的变量存在相关而被削弱影响(Frank & Heiser, 2011)。Lasso方法则将预测变量集视为整体, 可以较好地应对这一问题。
由于惩罚项的引入, Lasso方法在估计时所需要的计算量相对更高。Efron, Hastie, Johnstone和Tibshirani (2004)针对这一问题提出的最小角回归(Least Angle Regression, LARS)估计方法目前应用较为广泛。对于应用研究者来说, 随着正则化方法的成熟, 也已经发展出了可以直接进行Lasso回归建模的R软件包, 对此本文将在下文详述。
3.2 Lasso回归实现步骤
Lasso回归建模通常包括参数$\lambda $的选择和p值的计算两部分, 下文将详细介绍其方法原理, 附录部分(网络版)采用实例分析展示了如何在R软件中实现Lasso回归建模, 并详细对比了Lasso回归和OLS回归方法。
3.2.1 参数λ的选择
参数λ的选择决定了回归系数被压缩的程度, 不同的λ可能产生不同的结果。目前有以下两种常用的挑选参数$\lambda $最优值的方法(McNeish, 2015):
第一种方法是机器学习领域的交叉验证(Cross- Validation)方法。具体过程如下:首先, 将数据分成K个大小相同的样本, 通常K可为5、10或N (样本量); 然后选择$\lambda $的某个值, 将前K-1份的数据采用Lasso方法估计模型, 再将模型得到的回归系数用于第K份数据的验证, 检验模型设立是否正确, 并且将上述过程重复K次; 最后, 我们将得到某一λ值下模型的拟合值(如, 线性模型的均方误差值)。交叉验证方法通常会重复上述过程100次, 即选择100个不同的λ值, 再以均方误差大小决定参数λ的取值。一般情况下, 我们会选择均方误差最小时的λ值, 但是有时选择λ的最小值意味着回归系数压缩幅度较小, 可能不能完全解决过拟合的问题。因此, 有研究建议选择大于最小均方误差一个标准误时对应的参数λ值(Waldmann, Mészáros, Gredler, Fuerst, & Sölkner, 2013)。
另一种方法是信息标准(Information Criteria), 其参数λ的选择过程与交叉验证基本相同, 即针对多个不同的λ值, 在每个λ值下, 均采用Lasso方法拟合模型(使用全部数据)并计算得到信息标准的值(如, Akaike Information Criterion, AIC; Bayesian Information Criterion, BIC)。信息标准的具体计算公式分别如下所示:
其中RSS指的是残差平方和, df则指自由度。通常我们会选择产生局部最小或整体最小的信息标准时参数λ的值(McNeish, 2015)。
目前大多研究者主要使用交叉验证方法来决定λ的数值(Obuchi & Kabashima, 2016)。
3.2.2 p值的计算
大多变量选择的方法(如, 逐步回归)得到的自由度或标准误是不正确的, 这些方法在进行显著性检验时考察的不是应当作为整体存在的k个预测变量, 而是经过筛选后的m个预测变量(m≤k, Thompson, 2001)。例如, 对于样本量n为101, k为50的一个回归模型, F检验的自由度1(1在OLS回归分析中对多个回归系数进行单独或联合的显著性检验时可以用到F检验(张厚粲, 徐建平, 2015), F检验的自由度为(dfR, dfE), dfR和dfE分别是回归平方和及残差平方和对应的自由度。对于一个有n个观测值和k个预测变量的回归方程, dfR = k, dfE= n-1-k。)应为(50, 50), 但是如果逐步回归从50个预测变量中选出了5个预测变量, F检验的自由度将变为(5, 95)。而据此计算得到的p值往往是不可靠的(Lockhart et al., 2014)。但是目前还没有较好的方法可以在不重复抽样或分割数据集的情况下处理p值的计算。
在Lasso回归中, 对于没有完全压缩到零的回归系数, 也难以计算其标准误并判断其显著性。鉴于此, Lockhart等人(2014)提出了在不需重复抽样和分割数据的条件下, 计算Lasso估计中p值的方法。该方法与传统的似然比检验相似。在标准的似然比检验中, 我们需要计算全模型和限制模型(全模型中一些自由估计的参数在限制模型中被限制为0)的偏差(偏差 = -2log(似然值)), 再通过卡方检验来比较嵌套模型间差异的显著性(限制模型嵌套于全模型), 进而进行模型选择。类似地, Lockhart等人(2014)证明了结果变量(Y)的观察值和模型预测值(X$\overset{\scriptscriptstyle\frown}{\beta }$)之间的协方差也可发挥类似上述似然比检验中“偏差”的作用, 即在仅缺少某一预测变量的模型中(即限制模型, 该预测变量的回归系数被限制为0), 加入该预测变量后(即全模型, 所有预测变量的回归系数被自由估计), 计算模型协方差的变化值, 再进行显著性检验就可以实现变量选择。这种方法在检验每一个预测变量的显著性时都纳入了其余所有预测变量的影响, 避免了逐步回归中依次纳入变量时先纳入的变量对后纳入变量的影响。也不需要通过分离数据或重复抽样来进行推断性检验, 操作相对简便。
为了演示Lasso回归的实现步骤和报告标准, 附录部分(网络版)采用实证数据详细展示了Lasso回归在R软件中的实现过程。分析采用glmnet软件包(Friedman, Hastie, & Tibshirani, 2010)进行参数λ的选择, 采用covTest软件包(Lockhart et al., 2014)计算参数估计的p值。
4 Lasso回归的应用
Lasso回归的优点主要体现在它能够充当稳定的变量筛选器、建立更具有概化能力和预测能力的模型。在理论相对不够完善的研究中, 研究者更加需要采用这类方法避免对当前样本的过度解释, 探索适用于总体的规律。这种从解释到预测的转变有助于提升这类研究的理论意义和应用价值。
Lasso方法的优良特性使得其在教育学、临床心理学、发展心理学等领域都有着广阔的应用前景。但心理学领域的研究中, 只有少量研究采用了Lasso方法(如, Hartmann, Zeeck, & Barrett, 2010; Scheidt et al., 2012; Schmid, Taylor, Foldi, Berres, & Monsch, 2013)。McNeish(2015)也指出统计方法在心理学中的应用现状与统计学研究进展之间存在着较大的脱节。从统计学研究成果到心理学中的广泛应用往往都需要较长时间, 这导致应用领域不能迅速地从统计学的最新研究中获益。基于此, 下文将列举Lasso方法在临床心理学和神经科学领域的实际应用来展现该方法的具体使用与优势, 希望能够为研究者们使用Lasso方法提供参考。
4.1 Lasso在神经科学中的应用
在神经科学领域, Lasso已被成功应用在全基因组关联研究(Genome Wide Association Study, GWAS)或候选基因研究中筛选基因位点(Single Nucleotide Polymorphisms, SNPs; Ayers & Cordell, 2010; Shi et al., 2011)、检测基因与基因之间的交互作用(D’Angelo, Rao, & Gu, 2009; Li, Das, Fu, Li, & Wu, 2011)、以及根据GWAS结果进行风险预测(Kooperberg, LeBlanc, & Obenchain, 2010)。全基因组关联研究能够发现影响神经和精神疾病的风险基因, 在进行GWAS研究时, 往往会涉及大量的基因位点。此类涉及大量变量的基因研究往往存在研究结果难以重复的问题(Kohannim et al., 2012)。采用Lasso方法, 能够恰当减少SNPs的数量, 筛选出与结果变量稳定相关的基因, 建立可重复的模型。另外, 传统的GWAS分析将每个基因的作用看成是独立的, 忽略了它们之间可能存在连锁不平衡结构(Linkage Disequilibrium, LD), 即部分变异更可能被一起遗传。综上, 在基因分析中采用Lasso方法的优势主要有(Cho, Kim, Oh, Kim, & Park, 2009; Cho et al., 2010; Lin et al., 2009; Malo, Libiger, & Schork, 2008; Shi et al., 2011):(1)能够处理基因组的多维度问题; (2)能够处理由于LD引起的多重共线性问题; (3)能够处理多重比较的问题。
Kohannim等人(2012)为了减少相关基因数量, 筛选出与大脑结构具有可靠相关的基因, 采用Lasso回归来检测哪些基因能够影响颞叶体积(神经退行性疾病的生物标志)。研究收集了729名老年被试的全基因组数据以及相关的协变量数据, 结果变量为被试的颞叶体积测量。通过Lasso回归从备选SNPs中筛选出对结果变量影响最有效的一组SNPs。最终得到了22个显著影响颞叶体积的基因。随后, 为了检验基因结果的可重复性, 他们在另一批独立的健康青年群体身上针对相关性最高的MACROD2基因进行了重复验证。在这批独立的青年群体身上同样发现了MACROD2基因对于大脑结构存在影响, 验证了通过Lasso回归分析得到的基因相关结果的稳健性。
4.2 Lasso在临床心理学中的应用
由于临床样本收集的困难以及研究者们对众多心理疾病的认识不够清晰, 临床研究中往往会考虑较多变量的影响, 导致观测值数量与预测因子数量的比值较小(Demjaha et al., 2017)。另外, 临床评估要求我们建立能够进行稳定推断的模型。此时如果使用传统的逐步回归方法来进行变量筛选, 容易出现过拟合问题。而使用Lasso方法能够获得稳定的参数估计并提高预测准确性(Harrell, 2015), 更加符合临床评估的要求。
基于此, Demjaha等人(2017)调查影响首发性精神病抗治疗性(Treatment Resistance)的因素时, 追踪了323名患有首发性精神病的患者, 采用Lasso多元回归方法分析耐药性与临床及人口学变量之间的相关。Lasso多元回归分析结果显示诊断为精神分裂症、阴性症状、首次发病年龄小、较长时间未接受精神病治疗这几个因素能显著预测被试的精神病抗治疗性。
另外, 在患病早期识别患者是采取有效临床干预与治疗的先决条件, Lasso方法已被成功应用于识别潜在的患者。Schmid等(2013)对29个后来发展为阿尔兹海默症的患者以及相应条件匹配的29个对照正常人进行了为期8年的追踪, 调查了被试的客观行为测量以及神经心理学的功能变化情况。由于研究变量(k = 115)相对于观测值(n = 29)来说数量过大, 采用一般的回归方法易导致严重的过拟合问题。为了获得更具有预测能力的模型, 研究者采用Lasso回归来识别哪些变量能够在早期区分未来将发展成阿尔兹海默症的人群与正常对照人群。最终从115个预测变量中筛选出了11个最具预测力的变量, 能够有效地在早期区分两类人群。
5 Lasso的扩展
5.1 Lasso的扩展形式
在Lasso的基础上, 研究者根据回归分析中自变量的不同特性, 采用不同形式的惩罚函数, 建立和发展出了多种正则化模型, 例如松弛Lasso (Relaxed Lasso; Meinshausen, 2007), 自适应Lasso (Adaptive Lasso; Zou, 2006) , Bayesian Lasso (Park & Casella, 2008), Fused Lasso (Tibshirani et al., 2005)和Group Lasso (Yuan & Lin, 2006)等。下文将介绍几种Lasso扩展形式的原理和对应的R语言软件包。
5.1.1 松弛Lasso
当观测指标数p远大于观测样本量N时, Lasso方法的收敛速度较慢(Fan & Peng, 2004)。由于Lasso方法无法同时在计算复杂度与收敛速度上达到令人满意的折中, Meinshausen (2007)在Lasso的基础上提出了一个两阶段分析方法——松弛Lasso (Relaxed Lasso)。在松弛Lasso的分析中, 模型选择和参数估计被分割成两个独立的过程。该方法首先采用普通的Lasso回归筛选出合适的预测变量, 第二步再对筛选出的变量进行系数估计。此时会通过调整参数Φ改变惩罚力度(${{\lambda }_{2}}=\text{ }\!\!\Phi\!\!\text{ *}\lambda $, $1\Phi \ge 0$, $\lambda ,\ {{\lambda }_{2}}$分别为第一、二步估计中采用的调整参数), 削弱或消除惩罚项的作用来减小变量的系数估计偏差。当Φ = 1时, 系数估计值与普通Lasso方法得到的估计值一致; 当Φ = 0时, 此时系数估计值与OLS方法的估计值相同。松弛Lasso在兼顾计算复杂度的同时拥有比Lasso更快的收敛速度(Meinshausen, 2007)。理论和数值结果已表明, 对于高维数据, 松弛Lasso能够产生更稀疏的模型以及与Lasso相等或更小的预测损失。
对于松弛Lasso的应用, 已有较为完备的软件包可供使用。R语言中的relaxo包(Meinshausen, 2019)是专门用于进行松弛Lasso分析的软件包, 仅需要调用cvrelaxo或relaxo函数即可非常便捷地获得松弛Lasso的解。本文也采用实证数据进行了松弛Lasso回归的演示(第二步中参数Φ被固定为0, 即采用OLS回归法), 并对比了传统的OLS回归估计的结果。发现松弛Lasso回归仅采用两个预测变量就基本达到了OLS回归采用5个变量所获得的预测能力。
5.1.2 自适应Lasso
Lasso方法通过调整参数λ来控制回归系数的压缩程度(Tibshirani, 1996)。当研究者通过交叉验证方法选择并设定λ为某个固定的值时, Lasso方法会对所有变量施加相同程度的惩罚, 尽管这相比于Ridge正则化方法已经一定程度上减少了对重要回归系数的过度压缩, 但仍然不可避免地可能会对重要变量的系数进行压缩, 产生一定的估计偏差(Fan & Li, 2001)。Zou (2006)通过在惩罚项前增加自适应权重对Lasso算法进行了改进, 提出了自适应Lasso方法(Adaptive Lasso)。在自适应Lasso方法中, 任选一个 $\gamma $ > 0, 则权重向量$~\overset{\scriptscriptstyle\frown}{w}$=$\frac{1}{|\overset{\scriptscriptstyle\frown}{\beta }{{|}^{\gamma }}}~$, 此处可以采用OLS方法得到的系数估计值作为初始系数估计值$\overset{\scriptscriptstyle\frown}{\beta }$, 则自适应Lasso中的惩罚项可以表示为:
${{P}^{\text{aLasso}}}\left( \beta \right)=\lambda \underset{j=1}{\overset{p}{\mathop \sum }}\,{{\overset{\scriptscriptstyle\frown}{w}}_{j}}\left| {{\beta }_{j}} \right|$
自适应Lasso中的自适应权重系数依赖于数据, 不同变量的回归系数受到的惩罚程度不同。对于初始系数估计值较大的变量, 其权重系数较小, 从而会受到更小的惩罚。而初始估计值较小的变量对应较大的权重系数与较大的惩罚。因此, 采用自适应Lasso进行变量选择能够使得重要的变量更易进入模型, 而不重要的变量更易被剔除, 在更好地实现变量选择的同时也能够有效减小系数估计的偏差。相比于Lasso方法, 自适应Lasso方法也更适用于观测指标数p和样本量N的比值非常大的情况。目前, R语言中的glmnet (Tibshirani et al, 2019)、msgps (Hirose, 2019)以及parcor (Kraemer & Schaefer, 2019)等软件包均能进行自适应Lasso分析。另外, SAS软件中的Proc GlmSelect也能实现自适应Lasso的分析。
5.1.3 贝叶斯Lasso
在频率学派中, Lasso方法通过在似然函数中增加惩罚项的方式来减少模型参数, 实现正则化。而在贝叶斯方法中, 如果选择了合适的先验分布, 先验分布的对数形式就会扮演惩罚项的角色。例如, Tibshirani (1996)认为在贝叶斯方法下如果对参数θj提供同样的、相互独立的双指数先验
分布$\frac{\text{ }\!\!\lambda\!\!\text{ }}{2}exp\left( -\lambda \left| {{\theta }_{j}} \right| \right)$, 就可以实现Lasso正则化。双指数先验分布与零均值正态分布一样具有单峰性和对称性, 但其峰度比正态分布更大。其中, λ值越大, 概率密度函数越集中在零附近。
此外, 频率学派中能够实现Lasso方法的算法(如, Efron et al., 2004; Friedman et al., 2010; Wu & Lange, 2008)并不能提供有效的标准误估计, 这对于频率学领域中Lasso方法的应用造成了阻碍(Kyung, Gill, Ghosh, & Casella, 2010)。而贝叶斯Lasso可以通过Gibbs采样法提供有效的标准误估计(Kyung et al., 2010)。Park和Casella (2008)以及Hans (2009)提出的贝叶斯Lasso回归模型也能够在估计未知系数的同时估计正则化参数, 避免了使用传统交叉验证方法所需的大量计算负担, 有着非常广阔的应用前景。而应用研究者也已经可以采用R语言中的blasso软件包(Gramacy, 2019)非常方便的进行贝叶斯Lasso回归建模。
5.2 Lasso的扩展应用
在回归模型中, Lasso方法还可以被用于筛选中介变量(Serang et al., 2017); 而在回归模型之外, 正则化方法也逐渐被应用于结构方程模型(Structural Equation Modeling)和心理网络模型(Psychological Network Models; Epskamp, Borsboom, & Fried, 2018)中。
5.2.1 潜变量模型
潜变量模型主要被用于分析问卷测量的数据, 它在模型估计时考虑了测量误差的影响。在潜变量建模领域, 正则化方法已经引起了方法学家的重视, 逐渐被引入到结构方程建模分析中, 如, 采用贝叶斯Ridge正则化或Lasso正则化方法解决传统的验证性因子分析限制过于严格的问题(Muthén & Asparouhov, 2012; Pan, Ip, & Dubé, 2017), 在MIMIC模型(Multiple Indicators and Multiple Causes, MIMIC)中利用正则化方法进行预测变量的筛选(Jacobucci, Brandmaier, & Kievit, 2019)等。
目前最为流行的潜变量分析软件Mplus (Muthén & Muthén, 1998-2019)已经可以采用Ridge正则化方法进行结构方程建模, 其应用也十分普遍(张沥今 等, 2019)。也有专门的R语言软件包“blcfa” (Pan, Zhang & Ip, 2019)可以进行贝叶斯Lasso验证性因子分析, 以及“regsem”软件包(Jacobucci, 2019)可以帮助研究者利用Ridge正则化或Lasso正则化方法进行探索性因子分析、建立MIMIC模型等。遗憾的是, 由于Lasso方法与潜变量模型结合的方法在近两年才得到发展, 目前尚未得到普遍应用。
5.2.2 网络模型
心理网络模型(Psychological Network Models)采用节点(Nodes)代表可观测变量, 边(Edges)代表可观测变量间的联系, 边的权重代表变量间联系的强度。这种模型认为某些心理过程、状态(如, 认知过程, 精神病理症状)是同时发生的, 因此它关注各个可观测变量在网络中的相互作用。心理网络模型可以帮助研究者深入了解可观测变量间的关系, 是潜变量模型的有力补充。近年来, 心理网络模型被广泛应用于人格心理学和临床心理学等研究领域(如, Costantini et al., 2019; Richetin, Preti, Costantini, & De Panfilis, 2017)。
由于该模型考察的变量和参数数目较多, 为了避免过拟合问题、降低一类错误率, 研究者在采用网络分析时通常都会结合Lasso方法进行变量筛选。自适应Lasso和图Lasso(Graphical Lasso)等方法都可以帮助研究者获得稀疏的、具有更强概化能力的网络模型, 如:Marcus, Preszler和Zeigler-Hill (2017)使用自适应Lasso方法建立了黑暗人格(Dark Personality)网络模型; Costantini等人(2015a)基于自适应Lasso网络模型发展了责任感变量的内隐测量工具; Di Pierro, Costantini, Benzi, Madeddu和Preti (2018)则使用图Lasso方法建立自恋特质的精神病理学网络模型。这类网络模型可以通过qgraph (网络分析软件包; Epskamp, Cramer, Waldorp, Schmittmann, & Borsboom, 2012)和glasso软件包(图Lasso软件包; Friedman, Hastie, & Tibshirani, 2019)实现; 为了方便应用研究者使用这类方法, Costantini等人(2015b, 2019)详细阐述了自适应Lasso网络模型及图Lasso网络分析模型的原理及其在R软件中的实现方法。
6 讨论
6.1 应用建议
在心理学研究中, 研究者们常常主要关注于对变量间关系的解释, 但是Yarkoni和Westfall (2017)指出这种视角导致大量的心理学研究虽然探究了关系复杂的心理机制, 但是这些模型却很难准确地预测未来的行为。随着可重复性问题日益受到重视, 如何利用统计方法、规范研究流程来提供可重复性危机的解决方案也逐渐成为心理学领域的热点问题(Giordano & Waller, 2019; 胡传鹏 等, 2016; Spellman, 2015)。过度关注对当前数据集的解释带来的过拟合现象也是造成可重复性危机的关键问题, 针对该问题, 研究者已经提出了一系列应对措施。例如, 根据检验力和效应量在实验前计算样本量, 将p值临界值修改为0.005的同时提高样本量以降低二类错误率(Benjamin et al., 2018)。但有些研究(如, 临床研究)难以收集到足够的样本量, 且在理论不够完善的情况下变量数目较多也是非常常见的现象, 而过拟合问题在这种情况下会更为严重(Babyak, 2004; McNeish, 2015)。
因此, 有研究者指出新的统计分析工具(如, 正则化方法、贝叶斯方法)有望避免假设检验的局限, 降低可重复性危机(胡传鹏等, 2016; Benjamin et al., 2018)。也有越来越多的研究者指出机器学习领域的工具有希望帮助心理学成为一门更有预见性的科学, 且从解释向预测的转变或许可以帮助研究者更好地理解行为及其背后的机制(Rosenberg, Casey, & Holmes, 2018; Serang et al., 2017)。
以Lasso为代表的正则化模型在机器学习领域发挥着越来越重要的作用, 目前也已经广泛应用于生物医学等领域, 在心理学领域中正则化稀疏模型也可以帮助研究者进行变量筛选, 解决模型中的过拟合问题, 控制一类错误率等(刘建伟, 崔立鹏, 刘泽宇, 罗雄麟, 2015; 许树红, 王慧, 孙红卫, 王彤, 2017)。在小样本及变量数目较多的情况下, Lasso方法都有着更优良的表现, 也越来越多地被应用于心理学领域, 在临床心理学和神经科学之外, Lasso回归在教育心理学、人格心理学等领域中也可以发挥其价值。因此, 本文希望通过对Lasso回归方法原理和应用的介绍, 展现正则化模型的价值, 进而促进机器学习领域的工具在心理学领域发挥更大的作用。同时, 我们也呼吁应用研究者在变量数目较多或样本量不足的时候采用Lasso方法进行建模分析。
6.2 Lasso方法的局限和展望
阻碍Lasso回归应用的主要问题是其难以获得标准误估计值。这一方面会影响p值的计算, 对此Lockhart等人(2014)提出的方法及对应的R软件包可以有效地弥补这一问题, 但我们同时也希望研究者在应用这类机器学习方法时能够跳出显著性检验思维, 更多地关注模型整体的预测能力。另一方面, 无法获得标准误也会影响效应量和置信区间的计算, 但Lasso方法的扩展形式贝叶斯Lasso可以有效地进行标准误、可信区间(Credible Interval)的估计, 弥补了这一问题。随着贝叶斯统计的流行(van de Schoot, Winter, Ryan, Zondervan-Zwijnenburg, & Depaoli, 2017), 这种贝叶斯Lasso方法未来也有望得到更深入的发展和应用。
此外, 主流的许多统计软件都无法实现Lasso回归方法(如, SPSS, Mplus), 这极大地阻碍了Lasso方法的应用。在R软件中能够实现Lasso方法的软件包虽然多, 却也各有各的局限。Rstudio的首席科学家、ggplot2软件包的作者Hadley Wickham在采访(邱怡轩, 2019)中也提到, 他在课上会建议学生尝试一些更为稳健的回归方法, 如Lasso类的统计方法。但他指出目前有大概13个关于Lasso方法的R包, 但是每一个都不够完善, 如, 不能处理缺失值、分类变量等等, 因此他计划将整合这些软件包以制作一个更高效的分析工具。相信随着正则化模型及其配套分析工具的成熟, 应用研究者也可以更便捷地采用正则化方法进行建模分析。
最后, Lasso方法在回归模型之外的应用才刚刚起步, 而Lasso方法的优良特性也使得其在处理复杂模型(如, 潜交互模型、密集追踪模型等)时更具潜力。希望随着Lasso方法的发展, 方法学家也能够在各个领域充分发挥Lasso方法的价值。未来研究也需要进一步对比Lasso方法与其它正则化方法并探索其分别适用的建模场景, 为应用研究提供建议。
附录1:Lasso回归实例演示
为了验证传统OLS估计法容易出现过拟合的问题, 展示Lasso回归的步骤和报告标准, 促进Lasso回归的应用, 本文将采用实例演示详细展示Lasso回归的分析流程, 并对比传统估计方法。同时, 实例分析还将纳入Relaxed Lasso方法。分析采用R软件, 具体代码详见附录2。
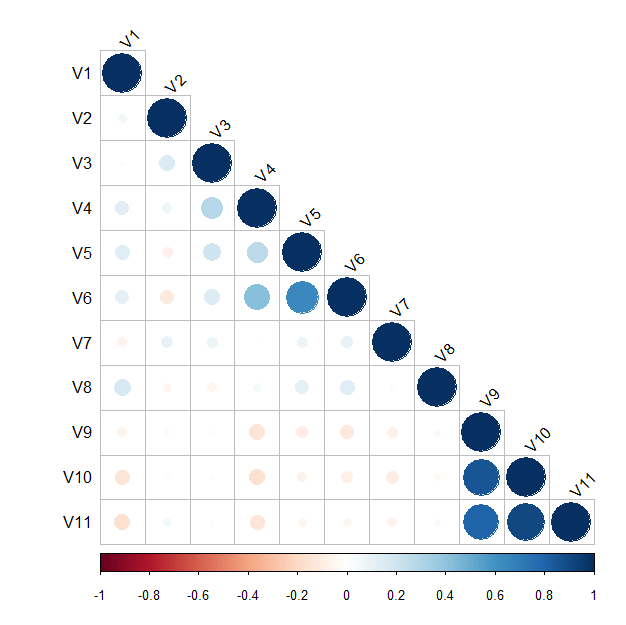
数据来源于395名葡萄牙中学生( Cortez & Silva, 2008), 数据中包含了11个连续变量:(1) 年龄(age), (2) 家庭关系质量(famrel), (3) 放学后空闲时间(freetime), (4) 和朋友出去玩的频率(goout), (5) 工作日饮酒频率(dalc), (6) 周末饮酒频率(walc), (7) 自评健康状况(health), (8) 缺课次数(absences), (9) 学生第一次数学测验成绩(G1), (10) 中期测验成绩(G2)和(11) 期末测验成绩(G3)。其中期末测验成绩为因变量, 本研究将探究能够有效预测数学期末测验成绩的因素。相关分析结果显示, 学生第一次数学测验成绩、中期测验成绩与期末测验成绩之间存在较强的正相关。
图1
在Lasso回归中, 首先采用10重交叉验证方法选择合适的惩罚项λ。这一方法可以通过R软件中的glmnet包(Friedman, Hastie, & Tibshirani, 2010)实现。值得注意的是, 为了保证每次交叉验证分析得到的λ结果一致, 需要采用set.seed()函数设定随机数种子, 否则每次分析的结果会存在微小差异。
结果显示最小化均方误差(Mean Square Error, MSE)的λ为0.043, λ + 1se为0.776。图2呈现了随着log(lambda)的增加MSE值的变化。当λ 对复杂模型的惩罚力度增大时, MSE同样会增大, 而惩罚项的增大最终会导致所有系数压缩到0, 此时MSE值最大。
图2
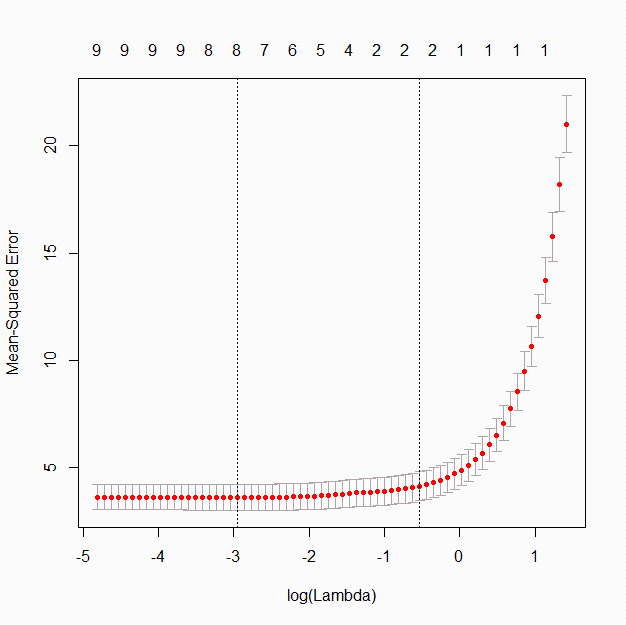
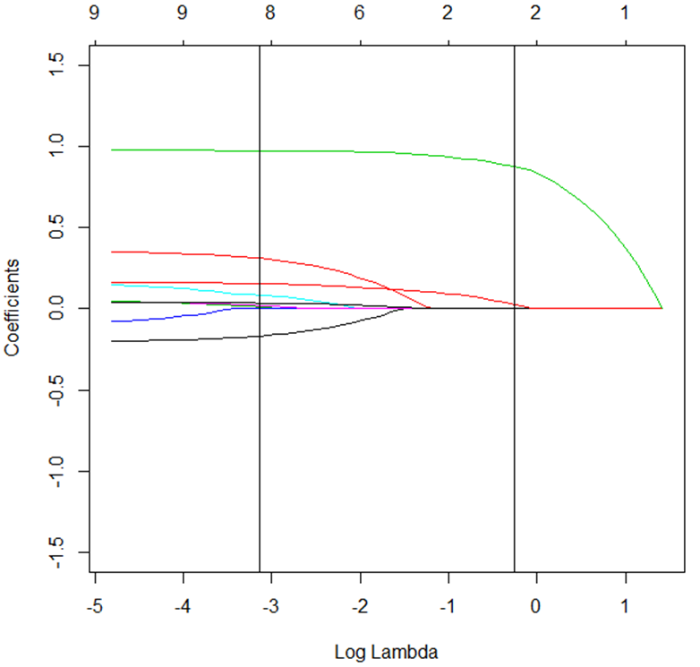
图3呈现了随着log(lambda) 的增加, 标准化回归系数被压缩的情况, 可以看到的是, 随着惩罚力度的增大, 标准化系数最终全部会被压缩到0。而在λ值为0.776处, 有两个系数不为0。根据输出结果, G1(学生第一次数学测验成绩)和G2(学生中期数学测验成绩)两个预测因素被保留下来。
图3
此外, Lasso回归中可以通过covTest软件包(Lockhart et al., 2014)计算参数估计的p值, 进一步计算p值发现, 同样只有G1和G2变量通过了显著性检验(表1)。
表1 Lasso、OLS、Relaxed Lasso回归结果
| 系数估计值(p值) | |||
|---|---|---|---|
| 预测变量 | OLS | Lasso | Relaxed Lasso |
| age | -0.206(0.009)** | -(0.072) | - |
| famrel | 0.36(0.001)** | -(0.699) | - |
| freetime | 0.058(0.57) | -(0.913) | - |
| gout | -0.014(0.891) | -(0.981) | - |
| dalc | -0.108(0.448) | -(0.646) | - |
| walc | 0.17(0.105) | -(0.294) | - |
| health | 0.046(0.509) | -(0.899) | - |
| absences | 0.042(0.001)** | -(0.089) | - |
| G1 | 0.164(0.003)** | 0.057(0.005)** | 0.153(0.007)** |
| G2 | 0.977(<0.001)*** | 0.903(<0.001)*** | 0.987(<0.001)*** |
| R2 | 0.835 | - | 0.822 |
| adjusted R2 | 0.831 | - | 0.821 |
| Mean Square Error | 3.446 | - | 3.723 |
注:**代表p小于0.01, ***代表p小于0.001。
而在OLS估计中, 共发现了年龄、家庭关系质量、缺课次数, 第一次测验成绩和期中成绩五个变量可以显著预测期末数学成绩(表1)。但是结果显示缺课次数正向预测期末数学成绩, 即学生缺勤次数越多, 期末成绩越高(b = 0.042, p = 0.001), 这显然和常识相悖。而相关分析也显示缺课次数和期末成绩间未发现显著相关(r = 0.034, p = 0.497)。而OLS回归分析得到的显著结果可能是由于样本量和观察指标数的比率较低(n / p = 3.95), 模型发生了过拟合现象, 即模型在最小化结果变量的预测值和观测值的差异时, 错误地学习到了不存在的规律。此外, 和Lasso回归相比, OLS额外发现的另外两个显著的预测变量和期末成绩的相关值较弱(图1)。其中年龄和期末数学成绩显著负相关(r = -0.162, p = 0.001), 而家庭关系质量和期末数学成绩未发现显著相关(r = 0.051, p = 0.309)。
进一步进行Relaxed Lasso分析, 即采用Lasso回归选择出的G1和G2变量与期末数学成绩建立OLS回归模型。结果发现与传统的OLS估计相比, Relaxed Lasso回归的R2、校正后R2及均方误差)均相差不大。即Relaxed Lasso回归仅采用两个预测变量就基本达到了OLS回归采用5个变量所获得的预测能力。
从上述分析中可以看出, OLS回归所选择的预测变量可能是不可靠且冗余的。一方面在本研究中OLS回归所选择的预测变量和因变量间相关很弱, 另一方面, 增加的三个预测变量并不能很好地提升对因变量的解释力, R2和校正后R2的值都和仅采用两个预测变量的回归模型相接近。此外, Relaxed Lasso方法也避免了Lasso方法在压缩不重要的系数的同时对非零系数(G1, G2)的压缩。
值得注意的是, Lasso回归并不总是会获得更简洁的预测变量集, 它的目的是采用较少的预测变量获得较高的预测能力。这尤其体现在样本量较少时, OLS回归所使用的假设检验为了控制一类错误率, 通常会获得较高的标准误估计, 检验力较低, 而Lasso回归在此时则更易于获得更高的检验力和预测能力。
附录2:Lasso回归实例代码
| student <- read.table("mat_2.txt",sep="\t",header=FALSE) IV<-(student[,1:10]) IV1=scale(IV,FALSE,FALSE) ## 不对自变量进行标准化处理 ## 十重交叉验证 install.packages(‘glmnet’) library(glmnet) set.seed(1222) ## 设定随机数种子, 保证每次运行十重交叉验证的结果一样 Lambda=cv.glmnet(IV1,student[,11]) ## lasso回归结果 coef(Lambda, s=Lambda\$lambda.1se) ## 绘图 plot(Lambda) ## 横坐标为lambda, 纵坐标为均方误差MSE savePlot(filename = "lambda", type ="png", device = dev.cur(), restoreConsole = TRUE) RegCoef=glmnet(IV1,student[,11],family = "gaussian",alpha = 1) plot(RegCoef, xvar="lambda",ylim=c(-1.5,1.5), lwd=1.8 ) ## 横坐标为lambda, 纵坐标为系数估计值 abline(v=log(Lambda\$lambda.1se)) abline(v=log(Lambda\$lambda.min)) savePlot(filename = "loglambda", type ="png", device = dev.cur(), restoreConsole = TRUE) ## 采用covTest包计算p值 library('devtools') install_github('cran/covTest') ## coveTest 软件包目前无法从CRAN上下载, 因此采用devtools软件包从github上下载 library(covTest) IV<-student[,1:10] df=nrow(IV)-1 IV2=scale(IV,TRUE,TRUE)/sqrt(df) ## 标准化自变量 LarsCoef=lars(IV2,student[,11]) covTest(LarsCoef,IV2,student[,11]) ## 计算p值 |
参考文献
心理学研究中的可重复性问题: 从危机到契机
DOI:10.3724/SP.J.1042.2016.01504
URL
[本文引用: 3]

可重复性问题是当前科学界面临的共同问题。最近, 心理学研究领域的可重复性问题也受到广泛关注, 引起了研究者的积极讨论与探索。通过对2008年发表的100项研究结果进行大规模重复实验, 研究者发现, 心理学研究的成功重复率约为39%, 但该研究仍然存在着巨大的争议, 不同的研究者对其结果的解读不尽相同。针对可重复性问题, 研究者通过数据模拟、元分析以及调查等多种方法来分析和探索其原因, 这些研究表明, 可重复性问题本质上可能是发表的研究假阳性过高, 可疑研究操作是假阳性过高的直接原因, 而出版偏见和过度依赖虚无假设检验则是更加深层的原因。面对可重复性问题, 研究者从统计方法和研究实践两个方面提出了相应的解决方案, 这些方法与实践正在成为心理学研究的新标准。然而, 要解决可重复性问题, 还需要心理学研究领域的多方参与, 尤其是在政策上鼓励公开、透明和开放的研究取向, 避免出版偏见。心理学研究者为解决可重复性问题做出的努力, 不仅会加强心理学研究的可靠性, 也为其他学科解决可重复问题提供了借鉴, 推动科学界可重复问题的解决。
统计之都访谈第 9 期:Hadley Wickham
SNP selection in genome-wide and candidate gene studies via penalized logistic regression
DOI:10.1002/gepi.20543
URL
PMID:21104890
[本文引用: 1]
Penalized regression methods offer an attractive alternative to single marker testing in genetic association analysis. Penalized regression methods shrink down to zero the coefficient of markers that have little apparent effect on the trait of interest, resulting in a parsimonious subset of what we hope are true pertinent predictors. Here we explore the performance of penalization in selecting SNPs as predictors in genetic association studies. The strength of the penalty can be chosen either to select a good predictive model (via methods such as computationally expensive cross validation), through maximum likelihood-based model selection criterion (such as the BIC), or to select a model that controls for type I error, as done here. We have investigated the performance of several penalized logistic regression approaches, simulating data under a variety of disease locus effect size and linkage disequilibrium patterns. We compared several penalties, including the elastic net, ridge, Lasso, MCP and the normal-exponential-gamma shrinkage prior implemented in the hyperlasso software, to standard single locus analysis and simple forward stepwise regression. We examined how markers enter the model as penalties and P-value thresholds are varied, and report the sensitivity and specificity of each of the methods. Results show that penalized methods outperform single marker analysis, with the main difference being that penalized methods allow the simultaneous inclusion of a number of markers, and generally do not allow correlated variables to enter the model, producing a sparse model in which most of the identified explanatory markers are accounted for.
What you see may not be what you get: A brief, nontechnical introduction to overfitting in regression-type models
DOI:10.1097/01.psy.0000127692.23278.a9
URL
PMID:15184705
[本文引用: 4]
OBJECTIVE: Statistical models, such as linear or logistic regression or survival analysis, are frequently used as a means to answer scientific questions in psychosomatic research. Many who use these techniques, however, apparently fail to appreciate fully the problem of overfitting, ie, capitalizing on the idiosyncrasies of the sample at hand. Overfitted models will fail to replicate in future samples, thus creating considerable uncertainty about the scientific merit of the finding. The present article is a nontechnical discussion of the concept of overfitting and is intended to be accessible to readers with varying levels of statistical expertise. The notion of overfitting is presented in terms of asking too much from the available data. Given a certain number of observations in a data set, there is an upper limit to the complexity of the model that can be derived with any acceptable degree of uncertainty. Complexity arises as a function of the number of degrees of freedom expended (the number of predictors including complex terms such as interactions and nonlinear terms) against the same data set during any stage of the data analysis. Theoretical and empirical evidence--with a special focus on the results of computer simulation studies--is presented to demonstrate the practical consequences of overfitting with respect to scientific inference. Three common practices--automated variable selection, pretesting of candidate predictors, and dichotomization of continuous variables--are shown to pose a considerable risk for spurious findings in models. The dilemma between overfitting and exploring candidate confounders is also discussed. Alternative means of guarding against overfitting are discussed, including variable aggregation and the fixing of coefficients a priori. Techniques that account and correct for complexity, including shrinkage and penalization, also are introduced.
Redefine statistical significance
DOI:10.1038/s41562-017-0189-z URL PMID:30980045 [本文引用: 2]
The dantzig selector: Statistical estimation when p is much larger than n
DOI:10.1214/009053606000001523 URL [本文引用: 1]
Regression by Example: 4th Edition
Regression by Example: 3rd Edition
Elastic-net regularization approaches for genome wide association studies of rheumatoid arthritis
Joint identification of multiple genetic variants via elastic net variable selection in a genome-wide association analysis
Applied multiple regression/correlation analysis for the behavioral sciences (3rd ed.)
Using Data Mining to Predict Secondary School Student Performance
State of the aRt personality research: A tutorial on network analysis of personality data in R
DOI:10.1016/j.jrp.2014.07.003 URL [本文引用: 1]
Development of indirect measures of conscientiousness: Combining a facets approach and network analysis
DOI:10.1002/per.v29.5 URL [本文引用: 1]
Stability and variability of personality networks. A tutorial on recent developments in network psychometrics
DOI:10.1016/j.paid.2017.06.011 URL [本文引用: 2]
Combining least absolute shrinkage and selection operator (LASSO) and principal-components analysis for detection of gene-gene interactions in genome-wide association studies
Grandiose and entitled, but still fragile: A network analysis of pathological narcissistic traits
DOI:10.1016/j.paid.2018.04.003 URL [本文引用: 1]
Antipsychotic treatment resistance in first-episode psychosis: Prevalence, subtypes and predictors
DOI:10.1017/S0033291716002075 URL [本文引用: 2]
Backward, forward and stepwise automated subset selection algorithms: Frequency of obtaining authentic and noise variables
DOI:10.1111/bmsp.1992.45.issue-2 URL [本文引用: 2]
Least angle regression
DOI:10.1214/009053604000000067 URL [本文引用: 2]
Estimating psychological networks and their accuracy: A tutorial paper
DOI:10.3758/s13428-017-0862-1
URL
PMID:28342071
[本文引用: 1]
The usage of psychological networks that conceptualize behavior as a complex interplay of psychological and other components has gained increasing popularity in various research fields. While prior publications have tackled the topics of estimating and interpreting such networks, little work has been conducted to check how accurate (i.e., prone to sampling variation) networks are estimated, and how stable (i.e., interpretation remains similar with less observations) inferences from the network structure (such as centrality indices) are. In this tutorial paper, we aim to introduce the reader to this field and tackle the problem of accuracy under sampling variation. We first introduce the current state-of-the-art of network estimation. Second, we provide a rationale why researchers should investigate the accuracy of psychological networks. Third, we describe how bootstrap routines can be used to (A) assess the accuracy of estimated network connections, (B) investigate the stability of centrality indices, and (C) test whether network connections and centrality estimates for different variables differ from each other. We introduce two novel statistical methods: for (B) the correlation stability coefficient, and for (C) the bootstrapped difference test for edge-weights and centrality indices. We conducted and present simulation studies to assess the performance of both methods. Finally, we developed the free R-package bootnet that allows for estimating psychological networks in a generalized framework in addition to the proposed bootstrap methods. We showcase bootnet in a tutorial, accompanied by R syntax, in which we analyze a dataset of 359 women with posttraumatic stress disorder available online.
qgraph: Network visualization of relationships in psychometric data
Variable selection via nonconcave penalized likelihood and its oracle properties
DOI:10.1198/016214501753382273 URL [本文引用: 1]
Nonconcave penalized likelihood with a diverging number of parameters
DOI:10.1214/009053604000000256 URL [本文引用: 1]
Advanced Econometric Methods
Using lasso regression to detect predictive aggregate effects in genetic studies
Feature selection in feature network models: Finding predictive subsets of features with the positive lasso
Regularization paths for generalized linear models via coordinate descent
We develop fast algorithms for estimation of generalized linear models with convex penalties. The models include linear regression, two-class logistic regression, and multinomial regression problems while the penalties include l(1) (the lasso), l(2) (ridge regression) and mixtures of the two (the elastic net). The algorithms use cyclical coordinate descent, computed along a regularization path. The methods can handle large problems and can also deal efficiently with sparse features. In comparative timings we find that the new algorithms are considerably faster than competing methods.
Bayesian Lasso/NG, Horseshoe, and Ridge Regression
Retrieved August 30, 2019, from https://www.rdocumentation.org/packages/monomvn/versions/1.9-10/topics/blasso
A neglected aspect of the reproducibility crisis: Factor analytic monte carlo studies
DOI:10.1080/00273171.2019.1697864 URL [本文引用: 1]
Bayesian Lasso regression
DOI:10.1093/biomet/asp047 URL [本文引用: 1]
Regression modeling strategies: with applications to linear models, logistic and ordinal regression, and survival analysis, 2nd
Interpersonal problems in eating disorders
Adding bias to reduce variance in psychological results: A tutorial on penalized regression
DOI:10.20982/tqmp.13.1.p001 URL [本文引用: 2]
Least angle and $\ell $ 1 penalized regression: A review
DOI:10.1214/08-SS035 URL [本文引用: 1]
regsem: regularized structural equation models. R package version 1.3.9.
Retrieved June 01, 2019, from https://cran.r-project.org/web/packages/regsem/index.html
A practical guide to variable selection in structural equation models with regularized MIMIC models
DOI:10.1177/2515245919826527
URL
PMID:31463424
[本文引用: 1]
Methodological innovations have allowed researchers to consider increasingly sophisticated statistical models that are better in line with the complexities of real world behavioral data. However, despite these powerful new analytic approaches, sample sizes may not always be sufficiently large to deal with the increase in model complexity. This poses a difficult modeling scenario that entails large models with a comparably limited number of observations given the number of parameters. We here describe a particular strategy to overcoming this challenge, called regularization. Regularization, a method to penalize model complexity during estimation, has proven a viable option for estimating parameters in this small n, large p setting, but has so far mostly been used in linear regression models. Here we show how to integrate regularization within structural equation models, a popular analytic approach in psychology. We first describe the rationale behind regularization in regression contexts, and how it can be extended to regularized structural equation modeling (Jacobucci, Grimm, & McArdle, 2016). Our approach is evaluated through the use of a simulation study, showing that regularized SEM outperforms traditional SEM estimation methods in situations with a large number of predictors and small sample size. We illustrate the power of this approach in two empirical examples: modeling the neural determinants of visual short term memory, as well as identifying demographic correlates of stress, anxiety and depression. We illustrate the performance of the method and discuss practical aspects of modeling empirical data, and provide a step-by-step online tutorial.
Remarks from the new editors
DOI:10.3102/1076998610387267 URL [本文引用: 1]
Discovery and replication of gene influences on brain structure using lasso regression
DOI:10.3389/fnins.2012.00001
URL
PMID:22294978
[本文引用: 2]
In decision from experience, the source of probability information affects how probability is distorted in the decision task. Understanding how and why probability is distorted is a key issue in understanding the peculiar character of experience-based decision. We consider how probability information is used not just in decision-making but also in a wide variety of cognitive, perceptual, and motor tasks. Very similar patterns of distortion of probability/frequency information have been found in visual frequency estimation, frequency estimation based on memory, signal detection theory, and in the use of probability information in decision-making under risk and uncertainty. We show that distortion of probability in all cases is well captured as linear transformations of the log odds of frequency and/or probability, a model with a slope parameter, and an intercept parameter. We then consider how task and experience influence these two parameters and the resulting distortion of probability. We review how the probability distortions change in systematic ways with task and report three experiments on frequency distortion where the distortions change systematically in the same task. We found that the slope of frequency distortions decreases with the sample size, which is echoed by findings in decision from experience. We review previous models of the representation of uncertainty and find that none can account for the empirical findings.
Risk prediction using genome-wide association studies
DOI:10.1002/gepi.20509
URL
PMID:20842684
[本文引用: 1]
Over the last few years, many new genetic associations have been identified by genome-wide association studies (GWAS). There are potentially many uses of these identified variants: a better understanding of disease etiology, personalized medicine, new leads for studying underlying biology, and risk prediction. Recently, there has been some skepticism regarding the prospects of risk prediction using GWAS, primarily motivated by the fact that individual effect sizes of variants associated with the phenotype are mostly small. However, there have also been arguments that many disease-associated variants have not yet been identified; hence, prospects for risk prediction may improve if more variants are included. From a risk prediction perspective, it is reasonable to average a larger number of predictors, of which some may have (limited) predictive power, and some actually may be noise. The idea being that when added together, the combined small signals results in a signal that is stronger than the noise from the unrelated predictors. We examine various aspects of the construction of models for the estimation of disease probability. We compare different methods to construct such models, to examine how implementation of cross-validation may influence results, and to examine which single nucleotide polymorphisms (SNPs) are most useful for prediction. We carry out our investigation on GWAS of the Welcome Trust Case Control Consortium. For Crohn's disease, we confirm our results on another GWAS. Our results suggest that utilizing a larger number of SNPs than those which reach genome-wide significance, for example using the lasso, improves the construction of risk prediction models.
parcor: Regularized estimation of partial correlation matrices
Retrieved September 04, from https://www.rdocumentation.org/packages/parcor/versions/0.2-6
Penalized regression, standard errors, and Bayesian lassos
DOI:10.1214/10-BA607 URL [本文引用: 2]
Using multivariate regression model with Least Absolute Shrinkage and Selection Operator (LASSO) to predict the incidence of xerostomia after intensity-modulated radiotherapy for head and neck cancer
DOI:10.1371/journal.pone.0089700
URL
PMID:24586971
[本文引用: 1]
PURPOSE: The aim of this study was to develop a multivariate logistic regression model with least absolute shrinkage and selection operator (LASSO) to make valid predictions about the incidence of moderate-to-severe patient-rated xerostomia among head and neck cancer (HNC) patients treated with IMRT. METHODS AND MATERIALS: Quality of life questionnaire datasets from 206 patients with HNC were analyzed. The European Organization for Research and Treatment of Cancer QLQ-H&N35 and QLQ-C30 questionnaires were used as the endpoint evaluation. The primary endpoint (grade 3(+) xerostomia) was defined as moderate-to-severe xerostomia at 3 (XER3m) and 12 months (XER12m) after the completion of IMRT. Normal tissue complication probability (NTCP) models were developed. The optimal and suboptimal numbers of prognostic factors for a multivariate logistic regression model were determined using the LASSO with bootstrapping technique. Statistical analysis was performed using the scaled Brier score, Nagelkerke R(2), chi-squared test, Omnibus, Hosmer-Lemeshow test, and the AUC. RESULTS: Eight prognostic factors were selected by LASSO for the 3-month time point: Dmean-c, Dmean-i, age, financial status, T stage, AJCC stage, smoking, and education. Nine prognostic factors were selected for the 12-month time point: Dmean-i, education, Dmean-c, smoking, T stage, baseline xerostomia, alcohol abuse, family history, and node classification. In the selection of the suboptimal number of prognostic factors by LASSO, three suboptimal prognostic factors were fine-tuned by Hosmer-Lemeshow test and AUC, i.e., Dmean-c, Dmean-i, and age for the 3-month time point. Five suboptimal prognostic factors were also selected for the 12-month time point, i.e., Dmean-i, education, Dmean-c, smoking, and T stage. The overall performance for both time points of the NTCP model in terms of scaled Brier score, Omnibus, and Nagelkerke R(2) was satisfactory and corresponded well with the expected values. CONCLUSIONS: Multivariate NTCP models with LASSO can be used to predict patient-rated xerostomia after IMRT.
The Bayesian lasso for genome-wide association studies
DOI:10.1093/bioinformatics/btq688
URL
[本文引用: 1]
Method: We propose a two-stage procedure for multi-SNP modeling and analysis in GWASs, by first producing a 'preconditioned' response variable using a supervised principle component analysis and then formulating Bayesian lasso to select a subset of significant SNPs. The Bayesian lasso is implemented with a hierarchical model, in which scale mixtures of normal are used as prior distributions for the genetic effects and exponential priors are considered for their variances, and then solved by using the Markov chain Monte Carlo (MCMC) algorithm. Our approach obviates the choice of the lasso parameter by imposing a diffuse hyperprior on it and estimating it along with other parameters and is particularly powerful for selecting the most relevant SNPs for GWASs, where the number of predictors exceeds the number of observations.Results: The new approach was examined through a simulation study. By using the approach to analyze a real dataset from the Framingham Heart Study, we detected several significant genes that are associated with body mass index (BMI). Our findings support the previous results about BMI-related SNPs and, meanwhile, gain new insights into the genetic control of this trait.]]>
Simultaneous genome-wide association studies of anti-cyclic citrullinated peptide in rheumatoid arthritis using penalized orthogonal-components regression
Theory-based health behavior change: Developing, testing, and applying theories for evidence-based interventions
DOI:10.1111/apps.2008.57.issue-4 URL [本文引用: 1]
A significance test for the lasso
DOI:10.1214/13-AOS1175
URL
PMID:25574062
[本文引用: 7]
In the sparse linear regression setting, we consider testing the significance of the predictor variable that enters the current lasso model, in the sequence of models visited along the lasso solution path. We propose a simple test statistic based on lasso fitted values, called the covariance test statistic, and show that when the true model is linear, this statistic has an Exp(1) asymptotic distribution under the null hypothesis (the null being that all truly active variables are contained in the current lasso model). Our proof of this result for the special case of the first predictor to enter the model (i.e., testing for a single significant predictor variable against the global null) requires only weak assumptions on the predictor matrix X. On the other hand, our proof for a general step in the lasso path places further technical assumptions on X and the generative model, but still allows for the important high-dimensional case p > n, and does not necessarily require that the current lasso model achieves perfect recovery of the truly active variables. Of course, for testing the significance of an additional variable between two nested linear models, one typically uses the chi-squared test, comparing the drop in residual sum of squares (RSS) to a [Formula: see text] distribution. But when this additional variable is not fixed, and has been chosen adaptively or greedily, this test is no longer appropriate: adaptivity makes the drop in RSS stochastically much larger than [Formula: see text] under the null hypothesis. Our analysis explicitly accounts for adaptivity, as it must, since the lasso builds an adaptive sequence of linear models as the tuning parameter lambda decreases. In this analysis, shrinkage plays a key role: though additional variables are chosen adaptively, the coefficients of lasso active variables are shrunken due to the [Formula: see text] penalty. Therefore, the test statistic (which is based on lasso fitted values) is in a sense balanced by these two opposing properties-adaptivity and shrinkage-and its null distribution is tractable and asymptotically Exp(1).
Introduction to Econometrics: 3rd Edition
Accommodating linkage disequilibrium in genetic-association analyses via ridge regression
DOI:10.1016/j.ajhg.2007.10.012
URL
PMID:18252218
[本文引用: 1]
Large-scale genetic-association studies that take advantage of an extremely dense set of genetic markers have begun to produce very compelling statistical associations between multiple makers exhibiting strong linkage disequilibrium (LD) in a single genomic region and a phenotype of interest. However, the ultimate biological or
A network of dark personality traits: What lies at the heart of darkness?
DOI:10.1016/j.jrp.2017.11.003 URL [本文引用: 1]
Using Lasso for predictor selection and to assuage overfitting: A method long overlooked in behavioral sciences
DOI:10.1080/00273171.2015.1036965
URL
PMID:26610247
[本文引用: 8]
Ordinary least squares and stepwise selection are widespread in behavioral science research; however, these methods are well known to encounter overfitting problems such that R(2) and regression coefficients may be inflated while standard errors and p values may be deflated, ultimately reducing both the parsimony of the model and the generalizability of conclusions. More optimal methods for selecting predictors and estimating regression coefficients such as regularization methods (e.g., Lasso) have existed for decades, are widely implemented in other disciplines, and are available in mainstream software, yet, these methods are essentially invisible in the behavioral science literature while the use of sub optimal methods continues to proliferate. This paper discusses potential issues with standard statistical models, provides an introduction to regularization with specific details on both Lasso and its related predecessor ridge regression, provides an example analysis and code for running a Lasso analysis in R and SAS, and discusses limitations and related methods.
Relaxed lasso
DOI:10.1016/j.csda.2006.12.019 URL [本文引用: 3]
Relaxed Lasso
Retrieved June 01, 2019, from https://www.rdocumentation.org/packages/relaxo/versions/0.1-2
Bayesian structural equation modeling: A more flexible representation of substantive theory
DOI:10.1037/a0026802
URL
PMID:22962886
[本文引用: 1]
This article proposes a new approach to factor analysis and structural equation modeling using Bayesian analysis. The new approach replaces parameter specifications of exact zeros with approximate zeros based on informative, small-variance priors. It is argued that this produces an analysis that better reflects substantive theories. The proposed Bayesian approach is particularly beneficial in applications where parameters are added to a conventional model such that a nonidentified model is obtained if maximum-likelihood estimation is applied. This approach is useful for measurement aspects of latent variable modeling, such as with confirmatory factor analysis, and the measurement part of structural equation modeling. Two application areas are studied, cross-loadings and residual correlations in confirmatory factor analysis. An example using a full structural equation model is also presented, showing an efficient way to find model misspecification. The approach encompasses 3 elements: model testing using posterior predictive checking, model estimation, and model modification. Monte Carlo simulations and real data are analyzed using Mplus. The real-data analyses use data from Holzinger and Swineford's (1939) classic mental abilities study, Big Five personality factor data from a British survey, and science achievement data from the National Educational Longitudinal Study of 1988.
Mplus User’s Guide. Eighth Edition
Autism blogs: Expressed emotion, language styles and concerns in personal and community settings
DOI:10.1109/TAFFC.2015.2400912 URL [本文引用: 1]
Scientific method: Statistical errors
Cross validation in lasso and its acceleration
An alternative to post hoc model modification in confirmatory factor analysis: The Bayesian lasso
DOI:10.1037/met0000112
URL
PMID:29265848
[本文引用: 1]
As a commonly used tool for operationalizing measurement models, confirmatory factor analysis (CFA) requires strong assumptions that can lead to a poor fit of the model to real data. The post hoc modification model approach attempts to improve CFA fit through the use of modification indexes for identifying significant correlated residual error terms. We analyzed a 28-item emotion measure collected for n = 175 participants. The post hoc modification approach indicated that 90 item-pair errors were significantly correlated, which demonstrated the challenge in using a modification index, as the error terms must be individually modified as a sequence. Additionally, the post hoc modification approach cannot guarantee a positive definite covariance matrix for the error terms. We propose a method that enables the entire inverse residual covariance matrix to be modeled as a sparse positive definite matrix that contains only a few off-diagonal elements bounded away from zero. This method circumvents the problem of having to handle correlated residual terms sequentially. By assigning a Lasso prior to the inverse covariance matrix, this Bayesian method achieves model parsimony as well as an identifiable model. Both simulated and real data sets were analyzed to evaluate the validity, robustness, and practical usefulness of the proposed procedure. (PsycINFO Database Record
blcfa: Bayesian Lasso Confirmatory Factor Analysis
Retrieved August 30, 2019, from https://github.com/zhanglj37/blcfa
The bayesian lasso
DOI:10.1198/016214508000000337 URL [本文引用: 2]
Estimation of parameters in a linear model
DOI:10.1214/aos/1176343639 URL [本文引用: 1]
The centrality of affective instability and identity in Borderline Personality Disorder: Evidence from network analysis
Prediction complements explanation in understanding the developing brain
DOI:10.1038/s41467-017-02088-w
URL
PMID:29317637
[本文引用: 1]
Many studies have shown how pigments and internal nanostructures generate color in nature. External surface structures can also influence appearance, such as by causing multiple scattering of light (structural absorption) to produce a velvety, super black appearance. Here we show that feathers from five species of birds of paradise (Aves: Paradisaeidae) structurally absorb incident light to produce extremely low-reflectance, super black plumages. Directional reflectance of these feathers (0.05-0.31%) approaches that of man-made ultra-absorbent materials. SEM, nano-CT, and ray-tracing simulations show that super black feathers have titled arrays of highly modified barbules, which cause more multiple scattering, resulting in more structural absorption, than normal black feathers. Super black feathers have an extreme directional reflectance bias and appear darkest when viewed from the distal direction. We hypothesize that structurally absorbing, super black plumage evolved through sensory bias to enhance the perceived brilliance of adjacent color patches during courtship display.
Are individual differences of attachment predicting bereavement outcome after perinatal loss? A prospective cohort study
DOI:10.1016/j.jpsychores.2012.08.017
URL
PMID:23062812
[本文引用: 1]
OBJECTIVE: The purpose of this study was to examine the influence of attachment, social support and the quality of the current partnership on the outcome of bereavement after perinatal loss. METHODS: In a prospective cohort design 33 women after perinatal loss were approached on admission to hospital and reassessed four weeks, four months and nine months later. The initial assessment included the Adult Attachment Interview and self-report questionnaires for social support and quality of the current partnership. Bereavement outcome was assessed using measures of grief (MTS), depression and anxiety (HADS), psychological distress (BSI), somatisation (BSI-SOM) and symptoms of PTSD (PDS). RESULTS: All measures of outcome showed a significant improvement over time. Standardized effect sizes between the initial assessment and nine month follow-up ranged between .36 for anxiety (HADS) and 1.02 for grief (MTS). Social support, quality of the partnership and secure attachment correlated inversely, and insecure preoccupied attachment correlated positively with the outcome measures. Preoccupied attachment was included as a predictor in two multivariate statistical models of non-linear regression analysis, one with somatisation (adjusted R2=.698, P=.016), the other with posttraumatic stress symptoms at nine month follow-up (adjusted R2=.416, P=.002) as target variable. Initial assessment scores of psychological distress predicted the course of the respective measure during follow-up (adjusted R2=.432, P=.014). CONCLUSION: Attachment, social support and the quality of the current partnership have an impact on the course of bereavement after perinatal loss. Secondary prevention after the event may focus on these factors in order to offer specific counselling and support.
Neuropsychological signs of Alzheimer’s disease 8 years prior to diagnosis
Exploratory mediation analysis via regularization
DOI:10.1080/10705511.2017.1311775 URL [本文引用: 3]
Mining gold dust under the genome wide significance level: A two-stage approach to analysis of GWAS
A short (personal) future history of revolution 2.0
Significance, effect sizes, stepwise methods, and other issues: Strong arguments move the field
DOI:10.1080/00220970109599499 URL [本文引用: 1]
Regression shrinkage and selection via the lasso
glmnet: Lasso and Elastic-Net Regularized Generalized Linear Models
Retrieved May 18, 2019, from https://www.rdocumentation.org/packages/glmnet/versions/2.0-18
Sparsity and smoothness via the fused lasso
A systematic review of Bayesian articles in psychology: The last 25 years
Corrigendum: evaluation of the lasso and the elastic net in genome-wide association studies
Tests of significance in stepwise regression
DOI:10.1037/0033-2909.86.1.168 URL [本文引用: 1]
Coordinate descent algorithms for lasso penalized regression
DOI:10.1214/07-AOAS147 URL [本文引用: 1]
Choosing prediction over explanation in psychology: Lessons from machine learning
Model selection and estimation in regression with grouped variables
DOI:10.1111/rssb.2006.68.issue-1 URL [本文引用: 1]
The adaptive lasso and its oracle properties
DOI:10.1198/016214506000000735 URL [本文引用: 3]
Regularization and variable selection via the elastic net
On the “degrees of freedom” of the Lasso
DOI:10.1214/009053607000000127 URL [本文引用: 1]
