

ISSN 0439-755X
CN 11-1911/B
CN 11-1911/B
Acta Psychologica Sinica ›› 2026, Vol. 58 ›› Issue (10): 2153-2166.doi: 10.3724/SP.J.1041.2026.2153
• Reports of Empirical Studies • Previous Articles
LI Guangming( )
)
Received:2025-06-16
Published:2026-10-25
Online:2026-08-04
Contact:
LI Guangming
E-mail:Lgm2004100@m.scnu.edu.cn
Supported by:LI Guangming. (2026). Comparing the accuracy of three sampling algorithms of MCMC method for estimating variance components in generalizability theory. Acta Psychologica Sinica, 58(10), 2153-2166.
| Prior information | ${\sigma }^{2}(p)$ | ${\sigma }^{2}(i)$ | ${\sigma }^{2}(pi)$ |
|---|---|---|---|
| MCMC inf | IGamma(2, 4) | IGamma(2, 16) | IGamma(2, 64) |
| MCMC non | IGamma(0.001, 0.001) | IGamma(0.001, 0.001) | IGamma(0.001, 0.001) |
| MCMC emp | IGamma(2, 5.95) | IGamma(2, 24.07) | IGamma(2, 95.97) |
Table 1 Three types of prior information for one-faceted crossed design p×i
| Prior information | ${\sigma }^{2}(p)$ | ${\sigma }^{2}(i)$ | ${\sigma }^{2}(pi)$ |
|---|---|---|---|
| MCMC inf | IGamma(2, 4) | IGamma(2, 16) | IGamma(2, 64) |
| MCMC non | IGamma(0.001, 0.001) | IGamma(0.001, 0.001) | IGamma(0.001, 0.001) |
| MCMC emp | IGamma(2, 5.95) | IGamma(2, 24.07) | IGamma(2, 95.97) |
| Prior information | Sampling algorithm | Estimated value | ${\sigma }^{2}(p)$ | ${\sigma }^{2}(i)$ | ${\sigma }^{2}(pi)$ |
|---|---|---|---|---|---|
| MCMC inf | M-H | VC | 3.797/3.815/3.743 | 15.664/15.727/15.868 | 64.059/64.121/64.167 |
| Bias | -0.203/-0.185/-0.257 | -0.336/-0.273/-0.132 | 0.059/0.121/0.167 | ||
| RMSE | 0.938/0.980/1.029 | 4.679/4.966/4.937 | 2.072/2.167/2.270 | ||
| Gibbs | VC | 3.844/3.754/3.801 | 15.873/15.971/15.741 | 64.110/64.197/64.033 | |
| Bias | -0.156/-0.246/-0.199 | -0.127/-0.029/-0.259 | 0.110/0.197/0.033 | ||
| RMSE | 1.025/0.989/1.053 | 4.929/5.082/4.725 | 2.106/2.123/2.264 | ||
| HMC | VC | 3.625/3.694/3.683 | 15.156/15.112/15.199 | 64.124/64.095/64.173 | |
| Bias | -0.375/-0.306/-0.317 | -0.844/-0.888/-0.801 | 0.124/0.095/0.173 | ||
| RMSE | 0.991/1.021/1.083 | 4.735/4.741/4.719 | 2.160/2.196/2.250 | ||
| MCMC non | M-H | VC | 4.015/4.014/4.003 | 17.664/17.683/17.835 | 63.966/64.156/64.175 |
| Bias | 0.015/0.014/0.003 | 1.664/1.683/1.835 | -0.034/0.156/0.175 | ||
| RMSE | 1.068//1.068/1.086 | 6.023/6.219/6.321 | 2.047/2.162/2.189 | ||
| Gibbs | VC | 4.065/4.048/3.957 | 17.787/17.678/18.031 | 64.063/64.138/64.114 | |
| Bias | 0.065/0.048/-0.043 | 1.787/1.678/2.031 | 0.063/0.138/0.114 | ||
| RMSE | 1.086/1.079/1.138 | 6.261/6.086/6.501 | 2.037/2.175/2.272 | ||
| HMC | VC | 3.897/3.813/3.763 | 16.390/16.909/16.758 | 64.111/64.074/64.190 | |
| Bias | -0.103/-0.187/-0.237 | 0.390/0.909/0.758 | 0.111/0.074/0.190 | ||
| RMSE | 1.132/1.157/1.215 | 5.585/5.914/5.754 | 2.170/2.157/2.214 | ||
| MCMC emp | M-H | VC | 3.980/3.931/3.963 | 16.639/16.760/16.814 | 64.048/64.155/64.022 |
| Bias | -0.020/-0.069/-0.037 | 0.639/0.760/0.814 | 0.048/0.155/0.022 | ||
| RMSE | 0.964/0.908/0.943 | 4.747/4.851/4.921 | 2.016/2.162/2.185 | ||
| Gibbs | VC | 3.990/3.900/3.898 | 16.449/16.836/16.611 | 64.096/64.056/64.195 | |
| Bias | -0.010/-0.100/-0.102 | 0.449/0.836/0.611 | 0.096/0.056/0.195 | ||
| RMSE | 0.951/0.943/0.965 | 4.612/4.917/4.822 | 2.064/2.177/2.236 | ||
| HMC | VC | 3.836/3.818/3.853 | 16.053/15.814/16.032 | 64.111/64.111/64.182 | |
| Bias | -0.164/-0.182/-0.147 | 0.053/-0.186/0.032 | 0.111/0.111/0.182 | ||
| RMSE | 0.951/0.977/0.997 | 4.843/4.587/4.591 | 2.034/2.114/2.152 |
Table 2 Estimation results of variance components for p×i design (with missing data ratios: 0%/5%/10%)
| Prior information | Sampling algorithm | Estimated value | ${\sigma }^{2}(p)$ | ${\sigma }^{2}(i)$ | ${\sigma }^{2}(pi)$ |
|---|---|---|---|---|---|
| MCMC inf | M-H | VC | 3.797/3.815/3.743 | 15.664/15.727/15.868 | 64.059/64.121/64.167 |
| Bias | -0.203/-0.185/-0.257 | -0.336/-0.273/-0.132 | 0.059/0.121/0.167 | ||
| RMSE | 0.938/0.980/1.029 | 4.679/4.966/4.937 | 2.072/2.167/2.270 | ||
| Gibbs | VC | 3.844/3.754/3.801 | 15.873/15.971/15.741 | 64.110/64.197/64.033 | |
| Bias | -0.156/-0.246/-0.199 | -0.127/-0.029/-0.259 | 0.110/0.197/0.033 | ||
| RMSE | 1.025/0.989/1.053 | 4.929/5.082/4.725 | 2.106/2.123/2.264 | ||
| HMC | VC | 3.625/3.694/3.683 | 15.156/15.112/15.199 | 64.124/64.095/64.173 | |
| Bias | -0.375/-0.306/-0.317 | -0.844/-0.888/-0.801 | 0.124/0.095/0.173 | ||
| RMSE | 0.991/1.021/1.083 | 4.735/4.741/4.719 | 2.160/2.196/2.250 | ||
| MCMC non | M-H | VC | 4.015/4.014/4.003 | 17.664/17.683/17.835 | 63.966/64.156/64.175 |
| Bias | 0.015/0.014/0.003 | 1.664/1.683/1.835 | -0.034/0.156/0.175 | ||
| RMSE | 1.068//1.068/1.086 | 6.023/6.219/6.321 | 2.047/2.162/2.189 | ||
| Gibbs | VC | 4.065/4.048/3.957 | 17.787/17.678/18.031 | 64.063/64.138/64.114 | |
| Bias | 0.065/0.048/-0.043 | 1.787/1.678/2.031 | 0.063/0.138/0.114 | ||
| RMSE | 1.086/1.079/1.138 | 6.261/6.086/6.501 | 2.037/2.175/2.272 | ||
| HMC | VC | 3.897/3.813/3.763 | 16.390/16.909/16.758 | 64.111/64.074/64.190 | |
| Bias | -0.103/-0.187/-0.237 | 0.390/0.909/0.758 | 0.111/0.074/0.190 | ||
| RMSE | 1.132/1.157/1.215 | 5.585/5.914/5.754 | 2.170/2.157/2.214 | ||
| MCMC emp | M-H | VC | 3.980/3.931/3.963 | 16.639/16.760/16.814 | 64.048/64.155/64.022 |
| Bias | -0.020/-0.069/-0.037 | 0.639/0.760/0.814 | 0.048/0.155/0.022 | ||
| RMSE | 0.964/0.908/0.943 | 4.747/4.851/4.921 | 2.016/2.162/2.185 | ||
| Gibbs | VC | 3.990/3.900/3.898 | 16.449/16.836/16.611 | 64.096/64.056/64.195 | |
| Bias | -0.010/-0.100/-0.102 | 0.449/0.836/0.611 | 0.096/0.056/0.195 | ||
| RMSE | 0.951/0.943/0.965 | 4.612/4.917/4.822 | 2.064/2.177/2.236 | ||
| HMC | VC | 3.836/3.818/3.853 | 16.053/15.814/16.032 | 64.111/64.111/64.182 | |
| Bias | -0.164/-0.182/-0.147 | 0.053/-0.186/0.032 | 0.111/0.111/0.182 | ||
| RMSE | 0.951/0.977/0.997 | 4.843/4.587/4.591 | 2.034/2.114/2.152 |
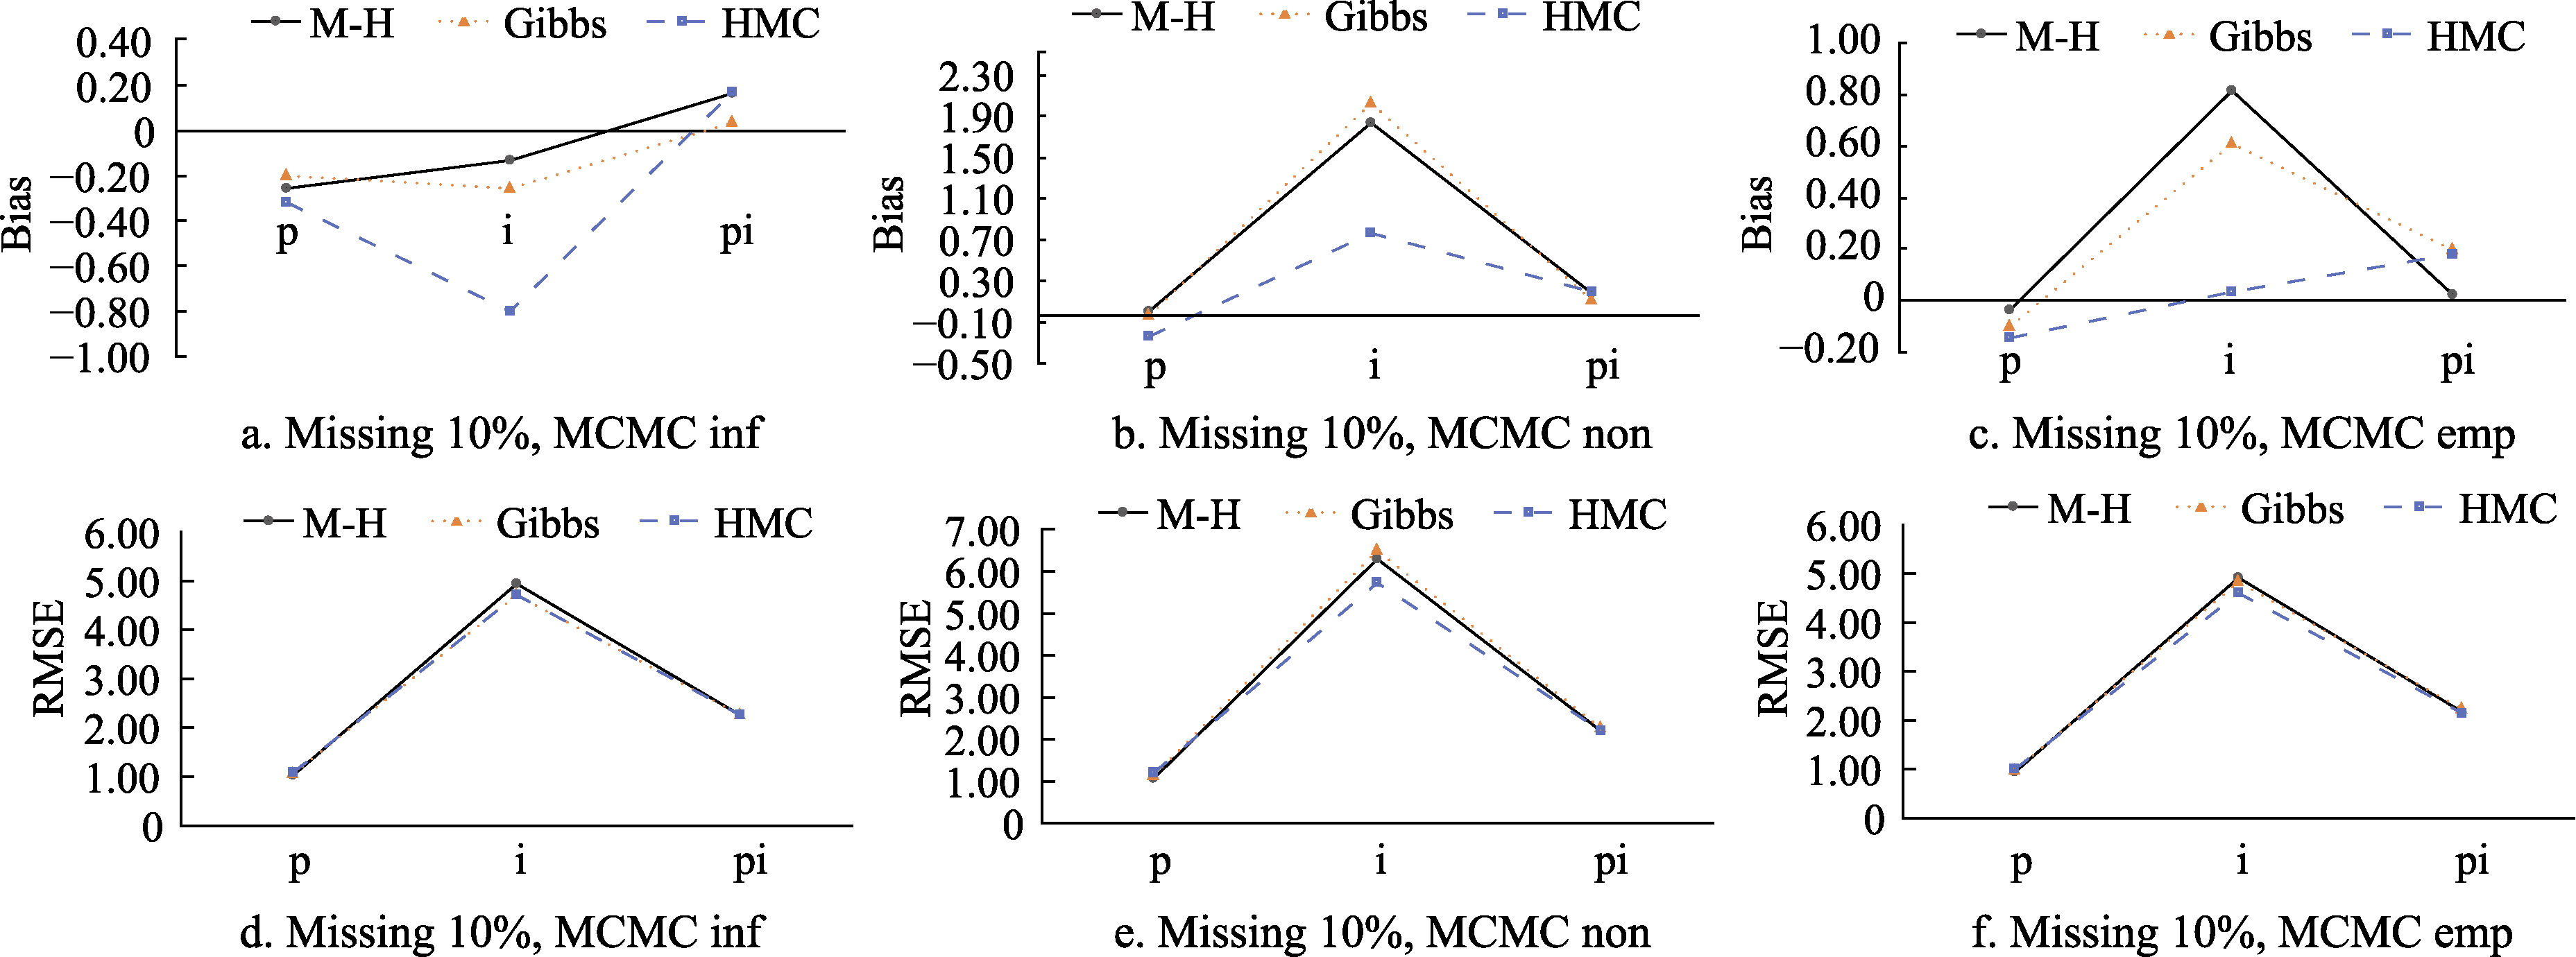
Figure 1. Bias and RMSE of variance components for p×i design (with 10% missing data ratio).
| Variance components | MCMC inf | MCMC non | MCMC emp |
|---|---|---|---|
| ${\sigma }^{2}(p)$ | IGamma(2, 16) | IGamma(0.001, 0.001) | IGamma(2, 23.76) |
| ${\sigma }^{2}(i)$ | IGamma(2, 4) | IGamma(0.001, 0.001) | IGamma(2, 6.03) |
| ${\sigma }^{2}(h)$ | IGamma(2, 1) | IGamma(0.001, 0.001) | IGamma(2, 1.53) |
| ${\sigma }^{2}(pi)$ | IGamma(2, 64) | IGamma(0.001, 0.001) | IGamma(2, 95.93) |
| ${\sigma }^{2}(ph)$ | IGamma(2, 2) | IGamma(0.001, 0.001) | IGamma(2, 3.02) |
| ${\sigma }^{2}(ih)$ | IGamma(2, 3) | IGamma(0.001, 0.001) | IGamma(2, 4.52) |
| ${\sigma }^{2}(pih)$ | IGamma(2, 144) | IGamma(0.001, 0.001) | IGamma(2, 216.14) |
Table 3 Three types of prior information for two-faceted crossed design p×i×h
| Variance components | MCMC inf | MCMC non | MCMC emp |
|---|---|---|---|
| ${\sigma }^{2}(p)$ | IGamma(2, 16) | IGamma(0.001, 0.001) | IGamma(2, 23.76) |
| ${\sigma }^{2}(i)$ | IGamma(2, 4) | IGamma(0.001, 0.001) | IGamma(2, 6.03) |
| ${\sigma }^{2}(h)$ | IGamma(2, 1) | IGamma(0.001, 0.001) | IGamma(2, 1.53) |
| ${\sigma }^{2}(pi)$ | IGamma(2, 64) | IGamma(0.001, 0.001) | IGamma(2, 95.93) |
| ${\sigma }^{2}(ph)$ | IGamma(2, 2) | IGamma(0.001, 0.001) | IGamma(2, 3.02) |
| ${\sigma }^{2}(ih)$ | IGamma(2, 3) | IGamma(0.001, 0.001) | IGamma(2, 4.52) |
| ${\sigma }^{2}(pih)$ | IGamma(2, 144) | IGamma(0.001, 0.001) | IGamma(2, 216.14) |
| Prior information | Sampling algorithm | Estimated value | ${\sigma }^{2}(p)$ | ${\sigma }^{2}(i)$ | ${\sigma }^{2}(h)$ | ${\sigma }^{2}(pi)$ | ${\sigma }^{2}(ph)$ | ${\sigma }^{2}(ih)$ | ${\sigma }^{2}(pih)$ |
|---|---|---|---|---|---|---|---|---|---|
| MCMC inf | M-H | VC | 15.502 | 3.635 | 0.998 | 63.292 | 1.641 | 2.980 | 145.044 |
| Bias | -0.498 | -0.365 | -0.002 | -0.708 | -0.359 | -0.020 | 1.044 | ||
| RMSE | 3.214 | 1.566 | 0.419 | 5.126 | 0.804 | 1.142 | 4.801 | ||
| Gibbs | VC | 15.598 | 3.785 | 0.969 | 63.422 | 1.733 | 3.032 | 144.715 | |
| Bias | -0.402 | -0.215 | -0.031 | -0.578 | -0.267 | 0.032 | 0.715 | ||
| RMSE | 3.420 | 1.599 | 0.377 | 4.992 | 0.777 | 1.159 | 4.752 | ||
| HMC | VC | 15.391 | 3.357 | 0.718 | 63.386 | 1.487 | 2.784 | 144.717 | |
| Bias | -0.609 | -0.643 | -0.282 | -0.614 | -0.513 | -0.216 | 0.717 | ||
| RMSE | 3.219 | 1.644 | 0.446 | 5.160 | 0.852 | 1.177 | 4.600 | ||
| MCMC non | M-H | VC | 16.648 | 3.811 | 56.566 | 63.578 | 1.613 | 3.778 | 144.613 |
| Bias | 0.648 | -0.189 | 55.566 | -0.422 | -0.387 | 0.778 | 0.613 | ||
| RMSE | 3.648 | 2.757 | 64.149 | 5.043 | 1.355 | 2.027 | 4.594 | ||
| Gibbs | VC | 16.506 | 3.656 | 159.590 | 63.320 | 1.464 | 3.867 | 144.886 | |
| Bias | 0.506 | -0.344 | 158.590 | -0.680 | -0.536 | 0.867 | 0.886 | ||
| RMSE | 3.627 | 2.733 | 593.552 | 5.001 | 1.338 | 2.164 | 4.773 | ||
| HMC | VC | 16.426 | 1.923 | 2.083 | 62.768 | 0.601 | 4.750 | 146.259 | |
| Bias | 0.426 | -2.077 | 1.083 | -1.232 | -1.399 | 1.750 | 2.259 | ||
| RMSE | 3.489 | 3.251 | 5.550 | 5.733 | 1.767 | 3.134 | 5.772 | ||
| MCMC emp | M-H | VC | 15.865 | 4.212 | 1.412 | 63.631 | 1.977 | 3.124 | 144.620 |
| Bias | -0.135 | 0.212 | 0.412 | -0.369 | -0.023 | 0.124 | 0.620 | ||
| RMSE | 3.136 | 1.494 | 0.631 | 4.828 | 0.745 | 1.042 | 4.685 | ||
| Gibbs | VC | 15.919 | 4.115 | 1.376 | 63.497 | 2.025 | 3.116 | 144.574 | |
| Bias | -0.081 | 0.115 | 0.376 | -0.503 | 0.025 | 0.116 | 0.574 | ||
| RMSE | 3.183 | 1.511 | 0.583 | 4.850 | 0.716 | 1.031 | 4.547 | ||
| HMC | VC | 15.663 | 3.817 | 1.012 | 63.511 | 1.823 | 2.946 | 144.696 | |
| Bias | -0.337 | -0.183 | 0.012 | -0.489 | -0.177 | -0.054 | 0.696 | ||
| RMSE | 3.207 | 1.383 | 0.320 | 5.098 | 0.688 | 1.002 | 4.683 |
Table 4 Estimation results of variance components for p×i×h design (with 0% missing data ratio)
| Prior information | Sampling algorithm | Estimated value | ${\sigma }^{2}(p)$ | ${\sigma }^{2}(i)$ | ${\sigma }^{2}(h)$ | ${\sigma }^{2}(pi)$ | ${\sigma }^{2}(ph)$ | ${\sigma }^{2}(ih)$ | ${\sigma }^{2}(pih)$ |
|---|---|---|---|---|---|---|---|---|---|
| MCMC inf | M-H | VC | 15.502 | 3.635 | 0.998 | 63.292 | 1.641 | 2.980 | 145.044 |
| Bias | -0.498 | -0.365 | -0.002 | -0.708 | -0.359 | -0.020 | 1.044 | ||
| RMSE | 3.214 | 1.566 | 0.419 | 5.126 | 0.804 | 1.142 | 4.801 | ||
| Gibbs | VC | 15.598 | 3.785 | 0.969 | 63.422 | 1.733 | 3.032 | 144.715 | |
| Bias | -0.402 | -0.215 | -0.031 | -0.578 | -0.267 | 0.032 | 0.715 | ||
| RMSE | 3.420 | 1.599 | 0.377 | 4.992 | 0.777 | 1.159 | 4.752 | ||
| HMC | VC | 15.391 | 3.357 | 0.718 | 63.386 | 1.487 | 2.784 | 144.717 | |
| Bias | -0.609 | -0.643 | -0.282 | -0.614 | -0.513 | -0.216 | 0.717 | ||
| RMSE | 3.219 | 1.644 | 0.446 | 5.160 | 0.852 | 1.177 | 4.600 | ||
| MCMC non | M-H | VC | 16.648 | 3.811 | 56.566 | 63.578 | 1.613 | 3.778 | 144.613 |
| Bias | 0.648 | -0.189 | 55.566 | -0.422 | -0.387 | 0.778 | 0.613 | ||
| RMSE | 3.648 | 2.757 | 64.149 | 5.043 | 1.355 | 2.027 | 4.594 | ||
| Gibbs | VC | 16.506 | 3.656 | 159.590 | 63.320 | 1.464 | 3.867 | 144.886 | |
| Bias | 0.506 | -0.344 | 158.590 | -0.680 | -0.536 | 0.867 | 0.886 | ||
| RMSE | 3.627 | 2.733 | 593.552 | 5.001 | 1.338 | 2.164 | 4.773 | ||
| HMC | VC | 16.426 | 1.923 | 2.083 | 62.768 | 0.601 | 4.750 | 146.259 | |
| Bias | 0.426 | -2.077 | 1.083 | -1.232 | -1.399 | 1.750 | 2.259 | ||
| RMSE | 3.489 | 3.251 | 5.550 | 5.733 | 1.767 | 3.134 | 5.772 | ||
| MCMC emp | M-H | VC | 15.865 | 4.212 | 1.412 | 63.631 | 1.977 | 3.124 | 144.620 |
| Bias | -0.135 | 0.212 | 0.412 | -0.369 | -0.023 | 0.124 | 0.620 | ||
| RMSE | 3.136 | 1.494 | 0.631 | 4.828 | 0.745 | 1.042 | 4.685 | ||
| Gibbs | VC | 15.919 | 4.115 | 1.376 | 63.497 | 2.025 | 3.116 | 144.574 | |
| Bias | -0.081 | 0.115 | 0.376 | -0.503 | 0.025 | 0.116 | 0.574 | ||
| RMSE | 3.183 | 1.511 | 0.583 | 4.850 | 0.716 | 1.031 | 4.547 | ||
| HMC | VC | 15.663 | 3.817 | 1.012 | 63.511 | 1.823 | 2.946 | 144.696 | |
| Bias | -0.337 | -0.183 | 0.012 | -0.489 | -0.177 | -0.054 | 0.696 | ||
| RMSE | 3.207 | 1.383 | 0.320 | 5.098 | 0.688 | 1.002 | 4.683 |
| Prior information | Sampling algorithm | Estimated value | ${\sigma }^{2}(p)$ | ${\sigma }^{2}(i)$ | ${\sigma }^{2}(h)$ | ${\sigma }^{2}(pi)$ | ${\sigma }^{2}(ph)$ | ${\sigma }^{2}(ih)$ | ${\sigma }^{2}(pih)$ |
|---|---|---|---|---|---|---|---|---|---|
| MCMC inf | M-H | VC | 15.722 | 3.767 | 0.949 | 63.682 | 1.664 | 2.871 | 144.847 |
| Bias | -0.278 | -0.233 | -0.051 | -0.318 | -0.336 | -0.129 | 0.847 | ||
| RMSE | 3.210 | 1.629 | 0.425 | 5.351 | 0.770 | 1.126 | 5.046 | ||
| Gibbs | VC | 15.855 | 3.642 | 0.988 | 63.427 | 1.756 | 2.869 | 144.797 | |
| Bias | -0.145 | -0.358 | -0.012 | -0.573 | -0.244 | -0.131 | 0.797 | ||
| RMSE | 3.427 | 1.571 | 0.462 | 5.270 | 0.784 | 1.123 | 4.853 | ||
| HMC | VC | 15.285 | 3.389 | 0.729 | 63.232 | 1.519 | 2.791 | 144.992 | |
| Bias | -0.715 | -0.611 | -0.271 | -0.768 | -0.481 | -0.209 | 0.992 | ||
| RMSE | 3.423 | 1.582 | 0.445 | 5.159 | 0.819 | 1.130 | 4.942 | ||
| MCMC non | M-H | VC | 16.639 | 3.554 | 91.233 | 63.441 | 1.350 | 3.815 | 145.196 |
| Bias | 0.639 | -0.446 | 90.233 | -0.559 | -0.650 | 0.815 | 1.196 | ||
| RMSE | 3.558 | 2.630 | 213.273 | 5.287 | 1.353 | 2.104 | 5.082 | ||
| Gibbs | VC | 16.495 | 3.392 | 62.578 | 63.518 | 1.453 | 3.934 | 145.250 | |
| Bias | 0.495 | -0.608 | 61.578 | -0.482 | -0.547 | 0.934 | 1.250 | ||
| RMSE | 3.601 | 2.710 | 265.197 | 5.258 | 1.427 | 2.130 | 5.108 | ||
| HMC | VC | 16.476 | 2.099 | 2.016 | 62.650 | 0.614 | 4.707 | 146.432 | |
| Bias | 0.476 | -1.901 | 1.016 | -1.350 | -1.386 | 1.707 | 2.432 | ||
| RMSE | 3.672 | 3.243 | 6.316 | 6.733 | 1.782 | 3.204 | 6.582 | ||
| MCMC emp | M-H | VC | 15.777 | 4.215 | 1.312 | 63.886 | 1.996 | 3.033 | 144.508 |
| Bias | -0.223 | 0.215 | 0.312 | -0.114 | -0.004 | 0.033 | 0.508 | ||
| RMSE | 3.299 | 1.557 | 0.531 | 5.277 | 0.743 | 1.023 | 5.091 | ||
| Gibbs | VC | 15.901 | 4.127 | 1.337 | 63.873 | 2.059 | 3.143 | 144.427 | |
| Bias | -0.099 | 0.127 | 0.337 | -0.127 | 0.059 | 0.143 | 0.427 | ||
| RMSE | 3.183 | 1.418 | 0.517 | 5.105 | 0.754 | 1.086 | 4.905 | ||
| HMC | VC | 15.648 | 3.811 | 1.010 | 63.684 | 1.825 | 2.949 | 144.390 | |
| Bias | -0.352 | -0.189 | 0.010 | -0.316 | -0.175 | -0.051 | 0.390 | ||
| RMSE | 3.245 | 1.423 | 0.328 | 5.403 | 0.718 | 1.051 | 4.972 |
Table 5 Estimation results of variance components for p×i×h design (with 5% missing data ratio)
| Prior information | Sampling algorithm | Estimated value | ${\sigma }^{2}(p)$ | ${\sigma }^{2}(i)$ | ${\sigma }^{2}(h)$ | ${\sigma }^{2}(pi)$ | ${\sigma }^{2}(ph)$ | ${\sigma }^{2}(ih)$ | ${\sigma }^{2}(pih)$ |
|---|---|---|---|---|---|---|---|---|---|
| MCMC inf | M-H | VC | 15.722 | 3.767 | 0.949 | 63.682 | 1.664 | 2.871 | 144.847 |
| Bias | -0.278 | -0.233 | -0.051 | -0.318 | -0.336 | -0.129 | 0.847 | ||
| RMSE | 3.210 | 1.629 | 0.425 | 5.351 | 0.770 | 1.126 | 5.046 | ||
| Gibbs | VC | 15.855 | 3.642 | 0.988 | 63.427 | 1.756 | 2.869 | 144.797 | |
| Bias | -0.145 | -0.358 | -0.012 | -0.573 | -0.244 | -0.131 | 0.797 | ||
| RMSE | 3.427 | 1.571 | 0.462 | 5.270 | 0.784 | 1.123 | 4.853 | ||
| HMC | VC | 15.285 | 3.389 | 0.729 | 63.232 | 1.519 | 2.791 | 144.992 | |
| Bias | -0.715 | -0.611 | -0.271 | -0.768 | -0.481 | -0.209 | 0.992 | ||
| RMSE | 3.423 | 1.582 | 0.445 | 5.159 | 0.819 | 1.130 | 4.942 | ||
| MCMC non | M-H | VC | 16.639 | 3.554 | 91.233 | 63.441 | 1.350 | 3.815 | 145.196 |
| Bias | 0.639 | -0.446 | 90.233 | -0.559 | -0.650 | 0.815 | 1.196 | ||
| RMSE | 3.558 | 2.630 | 213.273 | 5.287 | 1.353 | 2.104 | 5.082 | ||
| Gibbs | VC | 16.495 | 3.392 | 62.578 | 63.518 | 1.453 | 3.934 | 145.250 | |
| Bias | 0.495 | -0.608 | 61.578 | -0.482 | -0.547 | 0.934 | 1.250 | ||
| RMSE | 3.601 | 2.710 | 265.197 | 5.258 | 1.427 | 2.130 | 5.108 | ||
| HMC | VC | 16.476 | 2.099 | 2.016 | 62.650 | 0.614 | 4.707 | 146.432 | |
| Bias | 0.476 | -1.901 | 1.016 | -1.350 | -1.386 | 1.707 | 2.432 | ||
| RMSE | 3.672 | 3.243 | 6.316 | 6.733 | 1.782 | 3.204 | 6.582 | ||
| MCMC emp | M-H | VC | 15.777 | 4.215 | 1.312 | 63.886 | 1.996 | 3.033 | 144.508 |
| Bias | -0.223 | 0.215 | 0.312 | -0.114 | -0.004 | 0.033 | 0.508 | ||
| RMSE | 3.299 | 1.557 | 0.531 | 5.277 | 0.743 | 1.023 | 5.091 | ||
| Gibbs | VC | 15.901 | 4.127 | 1.337 | 63.873 | 2.059 | 3.143 | 144.427 | |
| Bias | -0.099 | 0.127 | 0.337 | -0.127 | 0.059 | 0.143 | 0.427 | ||
| RMSE | 3.183 | 1.418 | 0.517 | 5.105 | 0.754 | 1.086 | 4.905 | ||
| HMC | VC | 15.648 | 3.811 | 1.010 | 63.684 | 1.825 | 2.949 | 144.390 | |
| Bias | -0.352 | -0.189 | 0.010 | -0.316 | -0.175 | -0.051 | 0.390 | ||
| RMSE | 3.245 | 1.423 | 0.328 | 5.403 | 0.718 | 1.051 | 4.972 |
| Prior information | Sampling algorithm | Estimated value | ${\sigma }^{2}(p)$ | ${\sigma }^{2}(i)$ | ${\sigma }^{2}(h)$ | ${\sigma }^{2}(pi)$ | ${\sigma }^{2}(ph)$ | ${\sigma }^{2}(ih)$ | ${\sigma }^{2}(pih)$ |
|---|---|---|---|---|---|---|---|---|---|
| MCMC inf | M-H | VC | 15.883 | 3.801 | 0.985 | 63.209 | 1.686 | 2.899 | 144.971 |
| Bias | -0.117 | -0.199 | -0.015 | -0.791 | -0.314 | -0.101 | 0.971 | ||
| RMSE | 3.421 | 1.667 | 0.458 | 5.427 | 0.808 | 1.131 | 5.252 | ||
| Gibbs | VC | 15.551 | 3.792 | 0.983 | 63.123 | 1.813 | 2.860 | 144.900 | |
| Bias | -0.449 | -0.208 | -0.017 | -0.877 | -0.187 | -0.140 | 0.900 | ||
| RMSE | 3.281 | 1.643 | 0.453 | 5.393 | 0.860 | 1.142 | 5.148 | ||
| HMC | VC | 15.428 | 3.297 | 0.719 | 63.256 | 1.478 | 2.691 | 145.132 | |
| Bias | -0.572 | -0.703 | -0.281 | -0.744 | -0.522 | -0.309 | 1.132 | ||
| RMSE | 3.383 | 1.619 | 0.423 | 5.488 | 0.822 | 1.109 | 5.286 | ||
| MCMC non | M-H | VC | 16.583 | 3.509 | 49.424 | 63.045 | 1.304 | 3.955 | 145.767 |
| Bias | 0.583 | -0.491 | 48.424 | -0.955 | -0.696 | 0.955 | 1.767 | ||
| RMSE | 3.632 | 2.705 | 94.872 | 5.647 | 1.425 | 2.297 | 5.450 | ||
| Gibbs | VC | 16.515 | 3.563 | 61.315 | 63.673 | 1.405 | 3.855 | 145.220 | |
| Bias | 0.515 | -0.437 | 60.315 | -0.327 | -0.595 | 0.855 | 1.220 | ||
| RMSE | 3.465 | 2.769 | 199.282 | 5.415 | 1.428 | 2.219 | 5.323 | ||
| HMC | VC | 16.520 | 2.113 | 2.070 | 62.654 | 0.568 | 4.713 | 146.663 | |
| Bias | 0.520 | -1.887 | 1.070 | -1.346 | -1.432 | 1.713 | 2.663 | ||
| RMSE | 3.698 | 3.280 | 5.760 | 6.691 | 1.786 | 3.321 | 6.786 | ||
| MCMC emp | M-H | VC | 15.830 | 4.230 | 1.330 | 63.785 | 2.020 | 3.053 | 144.306 |
| Bias | -0.170 | 0.230 | 0.330 | -0.215 | 0.020 | 0.053 | 0.306 | ||
| RMSE | 3.278 | 1.480 | 0.537 | 5.390 | 0.771 | 1.077 | 5.059 | ||
| Gibbs | VC | 15.798 | 4.128 | 1.355 | 63.533 | 2.061 | 3.075 | 144.474 | |
| Bias | -0.202 | 0.128 | 0.355 | -0.467 | 0.061 | 0.075 | 0.474 | ||
| RMSE | 3.368 | 1.502 | 0.553 | 5.525 | 0.756 | 1.086 | 5.203 | ||
| HMC | VC | 15.572 | 3.815 | 0.995 | 63.379 | 1.831 | 2.908 | 144.690 | |
| Bias | -0.428 | -0.185 | -0.005 | -0.621 | -0.169 | -0.092 | 0.690 | ||
| RMSE | 3.292 | 1.444 | 0.283 | 5.616 | 0.677 | 1.040 | 4.816 |
Table 6 Estimation results of variance components for p×i×h design (with 10% missing data ratio)
| Prior information | Sampling algorithm | Estimated value | ${\sigma }^{2}(p)$ | ${\sigma }^{2}(i)$ | ${\sigma }^{2}(h)$ | ${\sigma }^{2}(pi)$ | ${\sigma }^{2}(ph)$ | ${\sigma }^{2}(ih)$ | ${\sigma }^{2}(pih)$ |
|---|---|---|---|---|---|---|---|---|---|
| MCMC inf | M-H | VC | 15.883 | 3.801 | 0.985 | 63.209 | 1.686 | 2.899 | 144.971 |
| Bias | -0.117 | -0.199 | -0.015 | -0.791 | -0.314 | -0.101 | 0.971 | ||
| RMSE | 3.421 | 1.667 | 0.458 | 5.427 | 0.808 | 1.131 | 5.252 | ||
| Gibbs | VC | 15.551 | 3.792 | 0.983 | 63.123 | 1.813 | 2.860 | 144.900 | |
| Bias | -0.449 | -0.208 | -0.017 | -0.877 | -0.187 | -0.140 | 0.900 | ||
| RMSE | 3.281 | 1.643 | 0.453 | 5.393 | 0.860 | 1.142 | 5.148 | ||
| HMC | VC | 15.428 | 3.297 | 0.719 | 63.256 | 1.478 | 2.691 | 145.132 | |
| Bias | -0.572 | -0.703 | -0.281 | -0.744 | -0.522 | -0.309 | 1.132 | ||
| RMSE | 3.383 | 1.619 | 0.423 | 5.488 | 0.822 | 1.109 | 5.286 | ||
| MCMC non | M-H | VC | 16.583 | 3.509 | 49.424 | 63.045 | 1.304 | 3.955 | 145.767 |
| Bias | 0.583 | -0.491 | 48.424 | -0.955 | -0.696 | 0.955 | 1.767 | ||
| RMSE | 3.632 | 2.705 | 94.872 | 5.647 | 1.425 | 2.297 | 5.450 | ||
| Gibbs | VC | 16.515 | 3.563 | 61.315 | 63.673 | 1.405 | 3.855 | 145.220 | |
| Bias | 0.515 | -0.437 | 60.315 | -0.327 | -0.595 | 0.855 | 1.220 | ||
| RMSE | 3.465 | 2.769 | 199.282 | 5.415 | 1.428 | 2.219 | 5.323 | ||
| HMC | VC | 16.520 | 2.113 | 2.070 | 62.654 | 0.568 | 4.713 | 146.663 | |
| Bias | 0.520 | -1.887 | 1.070 | -1.346 | -1.432 | 1.713 | 2.663 | ||
| RMSE | 3.698 | 3.280 | 5.760 | 6.691 | 1.786 | 3.321 | 6.786 | ||
| MCMC emp | M-H | VC | 15.830 | 4.230 | 1.330 | 63.785 | 2.020 | 3.053 | 144.306 |
| Bias | -0.170 | 0.230 | 0.330 | -0.215 | 0.020 | 0.053 | 0.306 | ||
| RMSE | 3.278 | 1.480 | 0.537 | 5.390 | 0.771 | 1.077 | 5.059 | ||
| Gibbs | VC | 15.798 | 4.128 | 1.355 | 63.533 | 2.061 | 3.075 | 144.474 | |
| Bias | -0.202 | 0.128 | 0.355 | -0.467 | 0.061 | 0.075 | 0.474 | ||
| RMSE | 3.368 | 1.502 | 0.553 | 5.525 | 0.756 | 1.086 | 5.203 | ||
| HMC | VC | 15.572 | 3.815 | 0.995 | 63.379 | 1.831 | 2.908 | 144.690 | |
| Bias | -0.428 | -0.185 | -0.005 | -0.621 | -0.169 | -0.092 | 0.690 | ||
| RMSE | 3.292 | 1.444 | 0.283 | 5.616 | 0.677 | 1.040 | 4.816 |
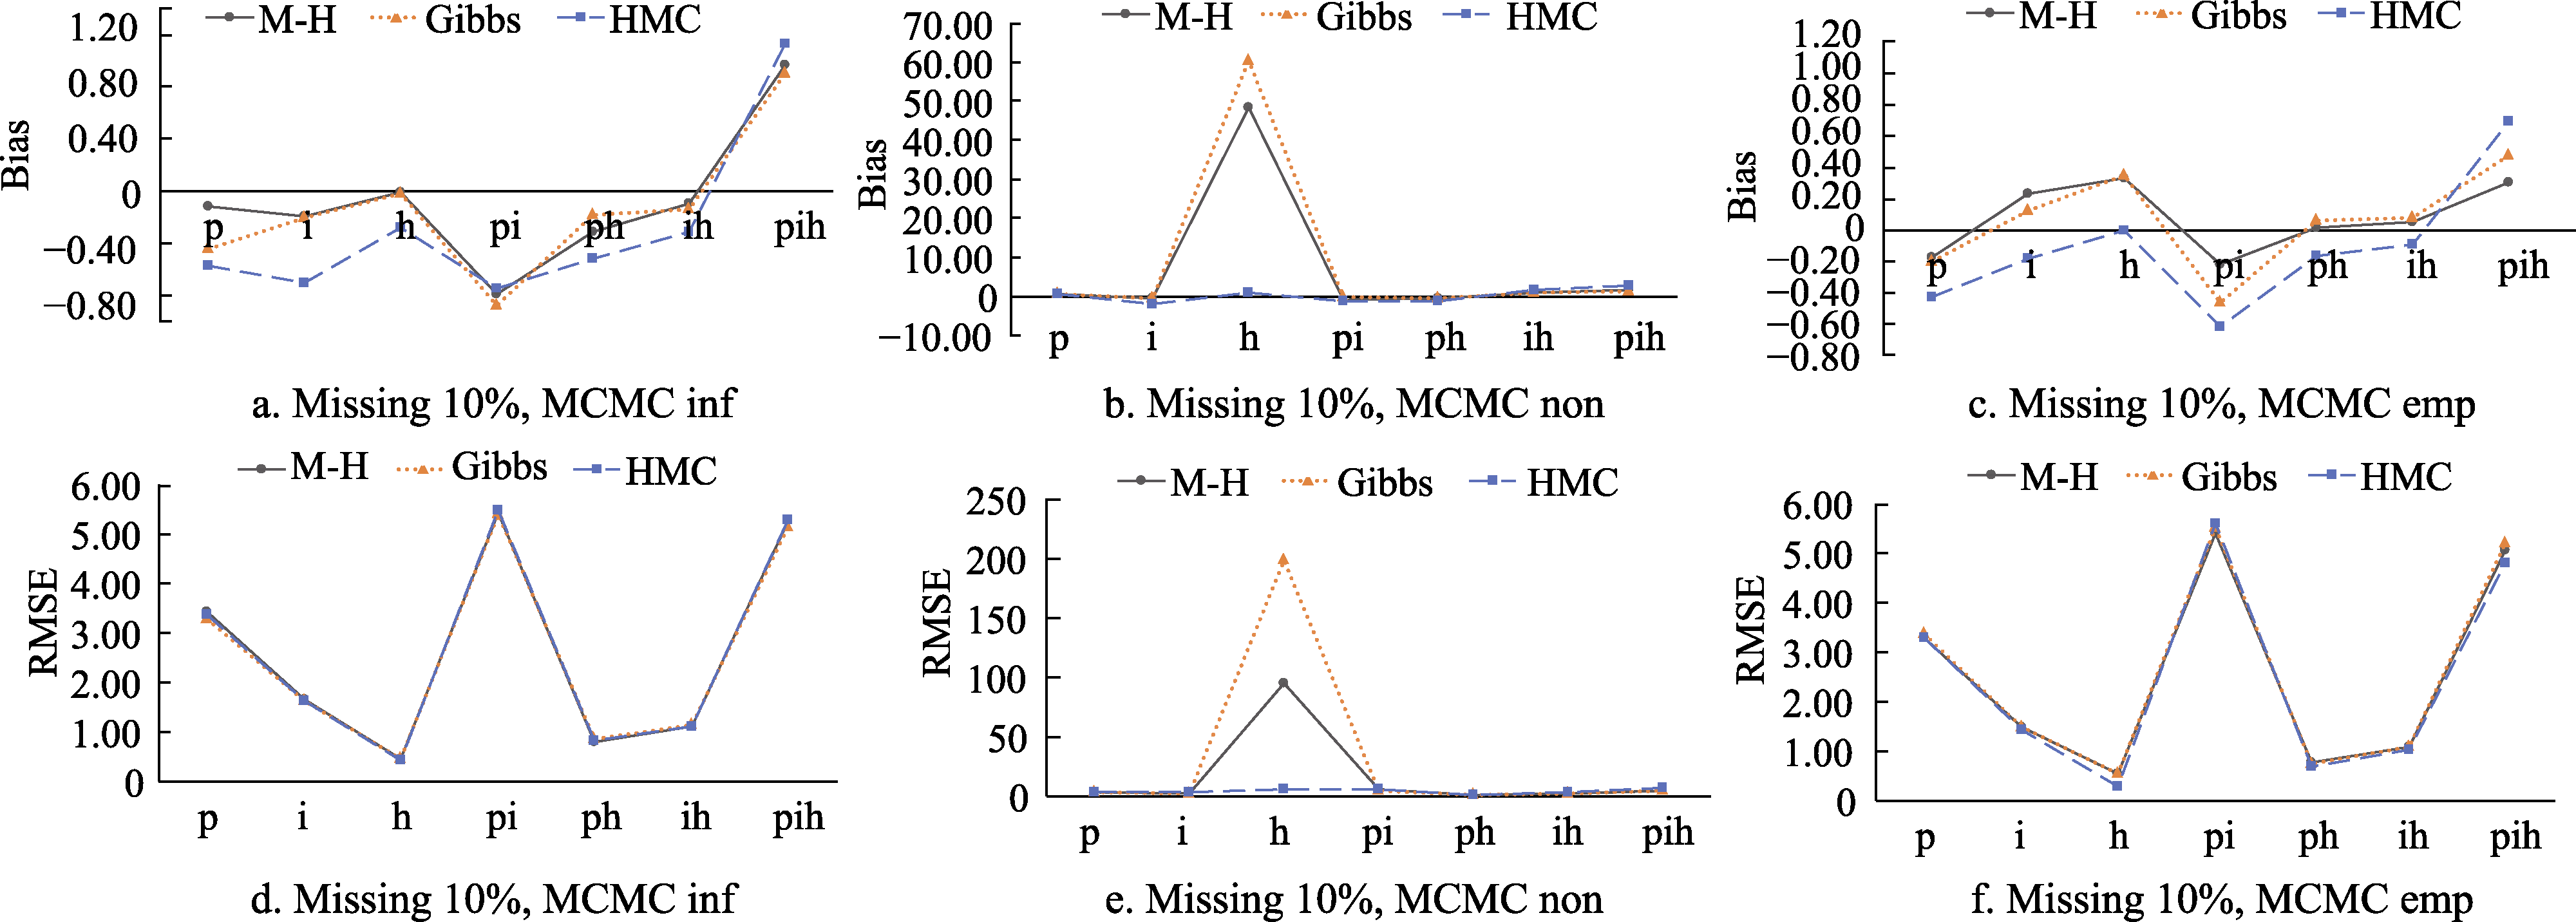
Figure 2. Bias and RMSE of variance components for p×i×h design (with 10% missing data ratio).
| Missing ratio | Estimated value | h = 3 | h = 4 | h = 5 | h = 6 |
|---|---|---|---|---|---|
| Missing 0% | VC | 3.782 | 2.200 | 1.965 | 1.505 |
| Bias | 2.782 | 1.200 | 0.965 | 0.505 | |
| RMSE | 6.219 | 2.598 | 1.987 | 1.343 | |
| Missing 5% | VC | 8.153 | 2.916 | 1.789 | 1.466 |
| Bias | 7.153 | 1.916 | 0.789 | 0.466 | |
| RMSE | 12.026 | 3.397 | 1.925 | 1.268 | |
| Missing 10% | VC | 6.809 | 2.817 | 1.782 | 1.533 |
| Bias | 5.809 | 1.817 | 0.782 | 0.533 | |
| RMSE | 9.538 | 3.310 | 1.817 | 1.400 |
Table 7 Estimation results of M-H algorithm for ${\sigma }^{2}(h)$
| Missing ratio | Estimated value | h = 3 | h = 4 | h = 5 | h = 6 |
|---|---|---|---|---|---|
| Missing 0% | VC | 3.782 | 2.200 | 1.965 | 1.505 |
| Bias | 2.782 | 1.200 | 0.965 | 0.505 | |
| RMSE | 6.219 | 2.598 | 1.987 | 1.343 | |
| Missing 5% | VC | 8.153 | 2.916 | 1.789 | 1.466 |
| Bias | 7.153 | 1.916 | 0.789 | 0.466 | |
| RMSE | 12.026 | 3.397 | 1.925 | 1.268 | |
| Missing 10% | VC | 6.809 | 2.817 | 1.782 | 1.533 |
| Bias | 5.809 | 1.817 | 0.782 | 0.533 | |
| RMSE | 9.538 | 3.310 | 1.817 | 1.400 |
| Missing ratio | Estimated value | h = 3 | h = 4 | h = 5 | h = 6 |
|---|---|---|---|---|---|
| Missing 0% | VC | 8.136 | 2.965 | 1.853 | 1.637 |
| Bias | 7.136 | 1.965 | 0.853 | 0.637 | |
| RMSE | 11.989 | 3.821 | 1.952 | 1.512 | |
| Missing 5% | VC | 5.676 | 2.769 | 1.868 | 1.666 |
| Bias | 4.676 | 1.769 | 0.868 | 0.666 | |
| RMSE | 7.781 | 3.332 | 1.888 | 1.543 | |
| Missing 10% | VC | 6.195 | 2.526 | 1.916 | 1.533 |
| Bias | 5.195 | 1.526 | 0.916 | 0.533 | |
| RMSE | 9.044 | 2.940 | 1.958 | 1.405 |
Table 8 Estimation results of Gibbs sampling for ${\sigma }^{2}(h)$
| Missing ratio | Estimated value | h = 3 | h = 4 | h = 5 | h = 6 |
|---|---|---|---|---|---|
| Missing 0% | VC | 8.136 | 2.965 | 1.853 | 1.637 |
| Bias | 7.136 | 1.965 | 0.853 | 0.637 | |
| RMSE | 11.989 | 3.821 | 1.952 | 1.512 | |
| Missing 5% | VC | 5.676 | 2.769 | 1.868 | 1.666 |
| Bias | 4.676 | 1.769 | 0.868 | 0.666 | |
| RMSE | 7.781 | 3.332 | 1.888 | 1.543 | |
| Missing 10% | VC | 6.195 | 2.526 | 1.916 | 1.533 |
| Bias | 5.195 | 1.526 | 0.916 | 0.533 | |
| RMSE | 9.044 | 2.940 | 1.958 | 1.405 |
| Prior information | Sampling algorithm | Estimated value | ${\sigma }^{2}(p)$ | ${\sigma }^{2}(i)$ | ${\sigma }^{2}(pi)$ |
|---|---|---|---|---|---|
| MCMC non | M-H | VC | 4.005 | 17.800 | 65.102 |
| Bias | 0.005 | 1.800 | 1.102 | ||
| RMSE | 1.091 | 6.306 | 2.189 | ||
| Gibbs | VC | 3.999 | 17.089 | 64.199 | |
| Bias | -0.001 | 1.089 | 0.199 | ||
| RMSE | 1.189 | 2.501 | 2.236 | ||
| HMC | VC | 3.999 | 16.704 | 64.177 | |
| Bias | -0.001 | 0.704 | 0.177 | ||
| RMSE | 1.255 | 2.788 | 2.202 |
Table 9 Estimation results of variance components for p×i design (with 9.9% missing data ratio)
| Prior information | Sampling algorithm | Estimated value | ${\sigma }^{2}(p)$ | ${\sigma }^{2}(i)$ | ${\sigma }^{2}(pi)$ |
|---|---|---|---|---|---|
| MCMC non | M-H | VC | 4.005 | 17.800 | 65.102 |
| Bias | 0.005 | 1.800 | 1.102 | ||
| RMSE | 1.091 | 6.306 | 2.189 | ||
| Gibbs | VC | 3.999 | 17.089 | 64.199 | |
| Bias | -0.001 | 1.089 | 0.199 | ||
| RMSE | 1.189 | 2.501 | 2.236 | ||
| HMC | VC | 3.999 | 16.704 | 64.177 | |
| Bias | -0.001 | 0.704 | 0.177 | ||
| RMSE | 1.255 | 2.788 | 2.202 |
| Prior information | Sampling algorithm | Estimated value | ${\sigma }^{2}(p)$ | ${\sigma }^{2}(i)$ | ${\sigma }^{2}(h)$ | ${\sigma }^{2}(pi)$ | ${\sigma }^{2}(ph)$ | ${\sigma }^{2}(ih)$ | ${\sigma }^{2}(pih)$ |
|---|---|---|---|---|---|---|---|---|---|
| MCMC non | M-H | VC | 16.983 | 3.559 | 49.404 | 63.245 | 1.388 | 3.988 | 145.700 |
| Bias | 0.983 | -0.441 | 48.404 | -0.755 | -0.612 | 0.988 | 1.700 | ||
| RMSE | 3.639 | 2.745 | 92.002 | 5.007 | 1.400 | 2.207 | 5.459 | ||
| Gibbs | VC | 16.515 | 3.563 | 61.309 | 63.673 | 1.405 | 3.889 | 145.288 | |
| Bias | 0.515 | -0.437 | 60.309 | -0.327 | -0.595 | 0.889 | 1.288 | ||
| RMSE | 3.465 | 2.769 | 190.202 | 5.415 | 1.428 | 2.208 | 5.309 | ||
| HMC | VC | 16.529 | 2.119 | 2.071 | 62.600 | 0.587 | 3.753 | 146.612 | |
| Bias | 0.529 | -1.881 | 1.071 | -1.400 | -1.413 | 0.753 | 2.612 | ||
| RMSE | 3.690 | 3.289 | 5.761 | 6.608 | 1.789 | 3.308 | 6.7822 |
Table 10 Estimation results of variance components for p×i×h design (with 9.9% missing data ratio)
| Prior information | Sampling algorithm | Estimated value | ${\sigma }^{2}(p)$ | ${\sigma }^{2}(i)$ | ${\sigma }^{2}(h)$ | ${\sigma }^{2}(pi)$ | ${\sigma }^{2}(ph)$ | ${\sigma }^{2}(ih)$ | ${\sigma }^{2}(pih)$ |
|---|---|---|---|---|---|---|---|---|---|
| MCMC non | M-H | VC | 16.983 | 3.559 | 49.404 | 63.245 | 1.388 | 3.988 | 145.700 |
| Bias | 0.983 | -0.441 | 48.404 | -0.755 | -0.612 | 0.988 | 1.700 | ||
| RMSE | 3.639 | 2.745 | 92.002 | 5.007 | 1.400 | 2.207 | 5.459 | ||
| Gibbs | VC | 16.515 | 3.563 | 61.309 | 63.673 | 1.405 | 3.889 | 145.288 | |
| Bias | 0.515 | -0.437 | 60.309 | -0.327 | -0.595 | 0.889 | 1.288 | ||
| RMSE | 3.465 | 2.769 | 190.202 | 5.415 | 1.428 | 2.208 | 5.309 | ||
| HMC | VC | 16.529 | 2.119 | 2.071 | 62.600 | 0.587 | 3.753 | 146.612 | |
| Bias | 0.529 | -1.881 | 1.071 | -1.400 | -1.413 | 0.753 | 2.612 | ||
| RMSE | 3.690 | 3.289 | 5.761 | 6.608 | 1.789 | 3.308 | 6.7822 |
| [1] | Brennan, R. L. (2001). Generalizability theory. New York: Springer- Verlag. |
| [2] |
Brennan, R. L., Kim, S. Y., & Lee, W. C. (2022). Extended multivariate generalizability theory with complex design structures. Educational and Psychological Measurement, 82(4) 617-642.
doi: 10.1177/00131644211049746 pmid: 35754617 |
| [3] | Bourabee, N., & Sanzserna, J. M. (2017). Randomized Hamiltonian Monte Carlo. Annals of Applied Probability, 27(4), 2159-2194. |
| [4] |
Chaudhuri, S., Mondal, D., & Yin, T. (2017). Hamiltonian Monte Carlo sampling in Bayesian empirical likelihood computation. Journal of the Royal Statistical Society Series B-Statistical Methodology, 79(1), 293-320.
doi: 10.1111/rssb.12164 URL |
| [5] |
Chen, D., Hebert, M., & Wilson, J. (2022). Examining human and automated ratings of elementary students’ writing quality: A multivariate generalizability theory application. American Educational Research Journal, 59(6), 1122-1156.
doi: 10.3102/00028312221106773 URL |
| [6] |
Enders, C. K., Fairchild, A. J., & MacKinnon, D. P. (2013). A Bayesian approach for estimating mediation effects with missing data. Multivariate Behavioral Research, 48(3), 340-369.
doi: 10.1080/00273171.2013.784862 pmid: 24039298 |
| [7] | Hoffman, M. D., & Gelman, A. (2014). The No-U-turn sampler: Adaptively setting path lengths in Hamiltonian Monte Carlo. Journal of Machine Learning Research, 15(1), 1593-1623. |
| [8] | Huang, C. (2017). Bayesian statistics and its implementation in R. Beijing: Tsinghua University Press. |
| [9] |
Jackson, D. J. R., Michaelides, G., Dewberry, C., & Kim, Y. J. (2016). Everything that you have ever been told about assessment center ratings is confounded. Journal of Applied Psychology, 101(7), 976-994.
doi: 10.1037/apl0000102 pmid: 26963079 |
| [10] |
Jiang, Z., & Skorupski, W. (2018). A Bayesian approach to estimating variance components within a multivariate generalizability theory framework. Behavior research methods, 50, 2193-2214.
doi: 10.3758/s13428-017-0986-3 pmid: 29235072 |
| [11] | Li, G. (2016). Influence factors of estimating of variance components and their variability for generalizability study in generalizability Theory. Psychological Exploration, 36(5), 458-463. |
| [12] | Li, G. (2023). How many students and items are optimal for teaching level evaluation of college teachers? Evidence from generalizability theory and Lagrange multiplier. Sustainability, 15(1), 2. |
| [13] |
Li, G., & Qin, Y. (2022). A new method for estimating the optimal sample size in generalizability theory based on evolutionary algorithm: Comparisons with three traditional methods. Acta Psychologica Sinica, 54(10), 1262-1276.
doi: 10.3724/SP.J.1041.2022.01262 |
| [14] | Li, G., Wang, X., & Pan, Y. (2022). Comparing of different methods for estimating variance components and their variabilities in generalizability theory based on two-facet designs. Statistics and Decision, 38(3), 50-54. |
| [15] |
Li, G., & Wu, Y. (2023). Application of the Bookmark method: Setting standard for the ninth-grade mathematics achievement test in China. Current Psychology, 42, 28941-28952.
doi: 10.1007/s12144-022-03992-1 |
| [16] |
Liao, R. J. T. (2023). The use of generalizability theory in investigating the score dependability of classroom-based L2 reading assessment. Language Testing, 40(1), 86-106.
doi: 10.1177/02655322211070840 URL |
| [17] | Liu, J., & Xia, Q. (2016). Bayesian statistical method based on MCMC algorithm. Beijing: Science Press. |
| [18] |
Lopilato, A. C., Carter, N., & Wang, M. (2015). Updating generalizability theory in management research: Bayesian estimation of variance components. Journal of Management, 41(2), 692-717.
doi: 10.1177/0149206314554215 URL |
| [19] | Mao, X., Shin, D., & Brennan, R. (2005). Estimating the variability of the estimated variance components and related statistics using the MCMC procedure: An exploratory study. Paper presented at the Annual Meeting of the National Council on Measurement in Education, Montreal, Canada. |
| [20] | Medvedev, O. N., & Siegert, R. J. (2022). Generalizability theory. In O. N. Medvedev, C. U. Krägeloh, R. J. Siegert, & N. N. Singh (Eds.), Handbook of assessment in mindfulness research (pp. 1-12). Cham: Springer International Publishing. |
| [21] |
Medvedeva, A., Galli, G., Petrovskaya, A., & Medvedev, O. N. (2022). A novel application of generalizability theory to evaluate the reliability of the recognition memory test. Current Psychology, 42(20), 17020-17032.
doi: 10.1007/s12144-022-02886-6 |
| [22] |
Monnahan, C. C., Thorson, J. T., & Branch, T. A. (2017). Faster estimation of Bayesian models in ecology using Hamiltonian Monte Carlo. Methods in Ecology and Evolution, 8(3), 339-348.
doi: 10.1111/mee3.2017.8.issue-3 URL |
| [23] | Moore, J. L. (2010). Estimating standard errors of estimated variance components in generalizability theory using bootstrap procedures. (Doctor of Philosophy Doctor), University of Iowa. |
| [24] | Neal, R. M. (2010). MCMC using Hamiltonian dynamics. London: Chapman and Hall. |
| [25] | Nugroho, D. B., & Morimoto, T. (2015). Estimation of realized stochastic volatility models using Hamiltonian Monte Carlo-Based methods. Computational Statistics, 30(2), 491-516. |
| [26] | Pakman, A., & Paninski, L. (2014). Exact Hamiltonian Monte Carlo for truncated multivariate Gaussians. Journal of Computational & Graphical Statistics, 23(2), 518-542. |
| [27] |
Tong, Y., & Brennan, R. L. (2007). Bootstrap estimates of standard errors in generalizability theory. Educational and Psychological Measurement, 67(5), 804-817.
doi: 10.1177/0013164407301533 URL |
| [28] |
Van Hooijdonk, M., Mainhard, T., Kroesbergen, E. H., & van Tartwijk, J. (2022). Examining the assessment of creativity with generalizability theory: An analysis of creative problem solving assessment tasks. Thinking Skills and Creativity, 43, 100994.
doi: 10.1016/j.tsc.2021.100994 URL |
| [29] |
Vispoel, W. P., Hong, H., Lee, H., & Jorgensen, T. D. (2023). Analyzing complete generalizability theory designs using structural equation models. Applied Measurement in Education, 36(4), 372-393.
doi: 10.1080/08957347.2023.2274573 URL |
| [30] | Wang, X., Li, G., Zhang, M., Jiang, X., Liang, Z., & Chu, X. (2016). A generalizability analysis of teaching level evaluation for college teachers. Journal of Psychological Science, 39(1), 90-96. |
| [31] | Yang, Z., & Chang, L. (2003). Generalizability theory and its applications. Beijing, China: Educational Science Publishing House. |
| [32] |
Zhang, C., Shahbaba, B., & Zhao, H. (2017). Hamiltonian Monte Carlo acceleration using surrogate functions with random bases. Statistics and Computing, 27(6), 1473-1490.
doi: 10.1007/s11222-016-9699-1 pmid: 28983154 |
| [33] |
Zhao, X., Ren, Z., & Chen, A. (2018). Analysis and comparative study on the quality of mathematics, arts, and science test papers in the college entrance examination based on multivariate generalizability theory. Mathematics Bulletin, 57(1), 25-30
doi: 10.4153/CMB-2012-009-9 URL |
| [34] | Zheng, X., Liu, Y., & Li, G. (2025). Using multivariate generalizability theory to test construct validity of the in-basket test and optimize evaluation plan. Journal of Jiangxi Normal University (Natural Science Edition), 49(6), 623-634. |
| [35] |
Zung, W. W. K. (1965). A self-rating depression scale. Archives of General Psychiatry, 12(1), 63-70.
doi: 10.1001/archpsyc.1965.01720310065008 URL |
| Viewed | ||||||
|
Full text |
|
|||||
|
Abstract |
|
|||||
