

ISSN 0439-755X
CN 11-1911/B
CN 11-1911/B
Acta Psychologica Sinica ›› 2025, Vol. 57 ›› Issue (3): 415-427.doi: 10.3724/SP.J.1041.2025.0415
• Original article • Previous Articles Next Articles
DONG Wanghao1,2,3, ZHANG Jie1,2,3, MENG Sujie1,2,3, JIA Min1,2,3, WANG Weijun1,2,3( )
Published:2025-03-25
Online:2025-01-24
Contact:
WANG Weijun, E-mail: DONG Wanghao, ZHANG Jie, MENG Sujie, JIA Min, WANG Weijun. (2025). The topological structure of adolescents’ internet adaptation: A longitudinal tracking study. Acta Psychologica Sinica, 57(3), 415-427.
Add to citation manager EndNote|Ris|BibTeX
URL: https://journal.psych.ac.cn/acps/EN/10.3724/SP.J.1041.2025.0415
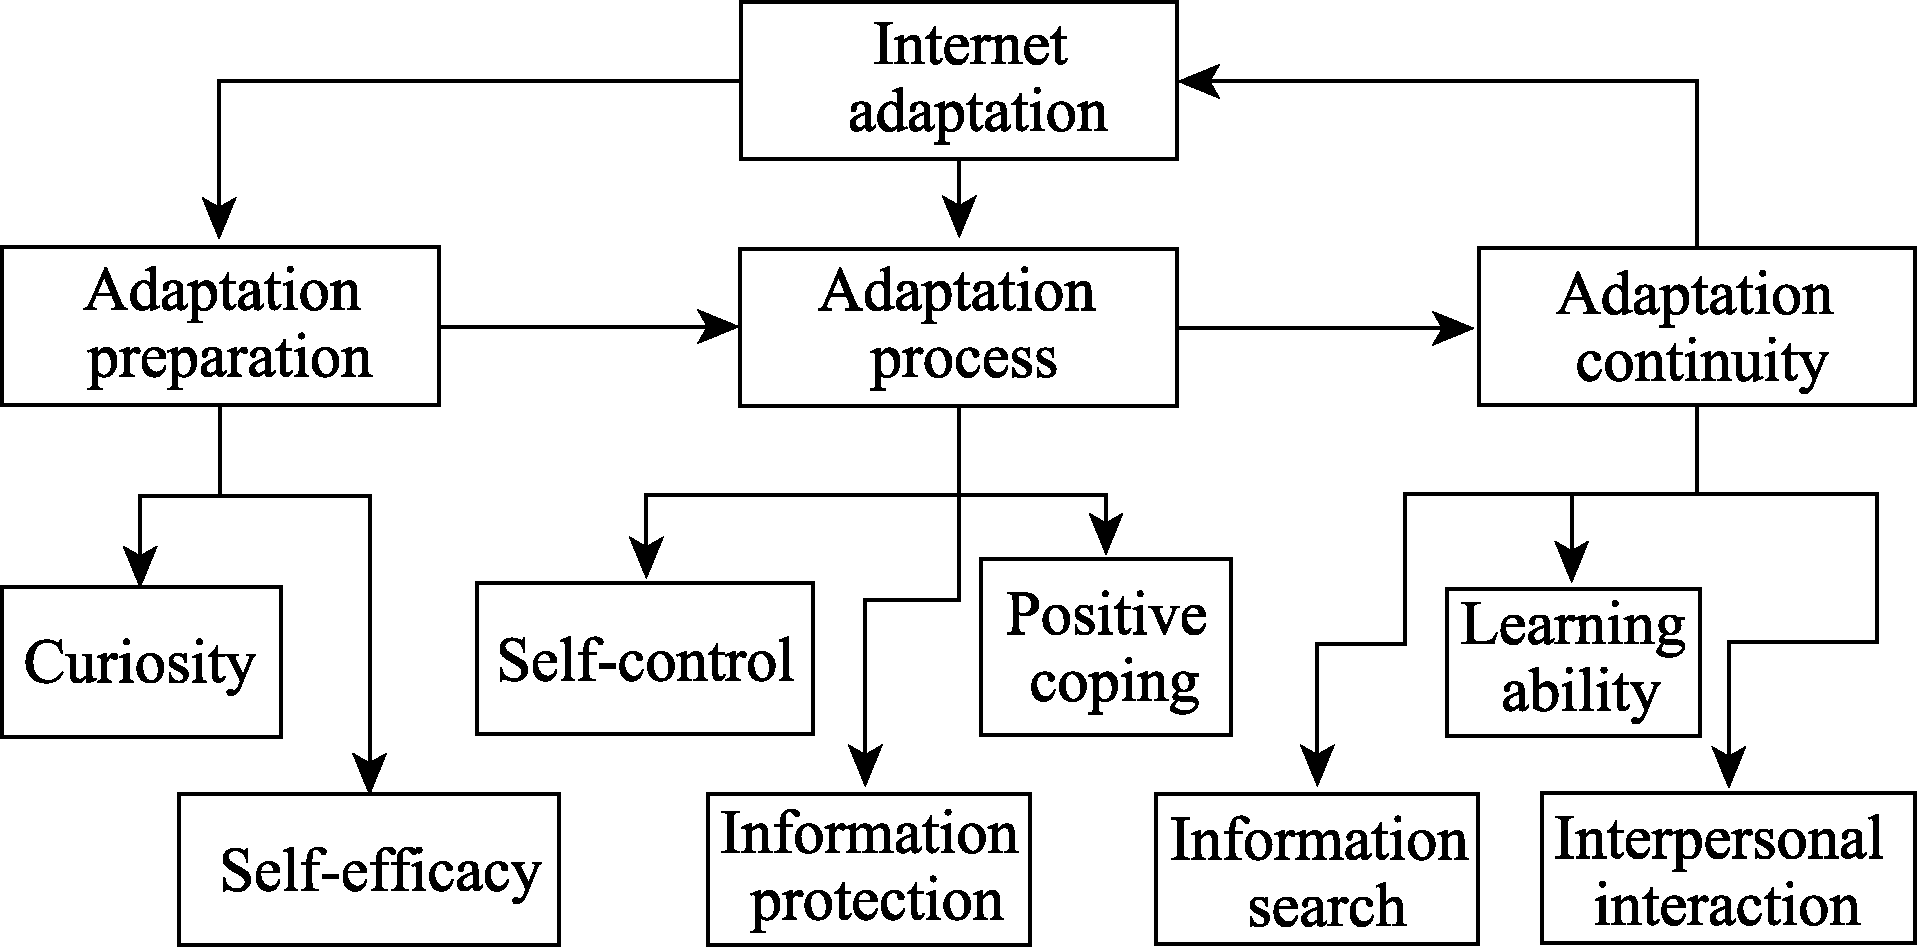
Figure 1. Schematic diagram of the dynamic process of internet adaptation.
| Dimension | N = 5783 | N = 1235 (T1) | N = 1235 (T2) | ||||||
|---|---|---|---|---|---|---|---|---|---|
| Mean (SD) | Skewness | Kurtosis | Mean (SD) | Skewness | Kurtosis | Mean (SD) | Skewness | Kurtosis | |
| Self-Control | 3.95(1.07) | 0.11 | ?0.15 | 4.13(1.06) | 0.03 | ?0.43 | 4.49(0.93) | ?0.25 | ?0.28 |
| Interpersonal Interaction | 3.87 (1.06) | ?0.04 | ?0.08 | 3.93(1.07) | ?0.17 | ?0.13 | 4.44(0.92) | ?0.19 | ?0.27 |
| Information search | 4.07(1.15) | ?0.21 | ?0.13 | 4.07(1.17) | ?0.31 | ?0.11 | 4.36(1.06) | ?0.41 | 0.00 |
| Information Protection | 4.39(1.09) | ?0.26 | ?0.44 | 4.50(1.06) | ?0.38 | ?0.42 | 4.53(0.96) | ?0.40 | ?0.10 |
| Proactive Coping | 4.54(1.05) | ?0.32 | ?0.31 | 4.72(0.99) | ?0.38 | ?0.52 | 4.65(0.93) | ?0.43 | 0.25 |
| Learning Ability | 4.06(1.04) | ?0.06 | 0.13 | 4.05(1.06) | ?0.13 | 0.06 | 4.49(0.95) | ?0.29 | ?0.04 |
| Self-Efficacy | 3.97(1.11) | 0.01 | ?0.10 | 3.94(1.15) | ?0.08 | ?0.20 | 4.48(0.98) | ?0.31 | ?0.08 |
| Curiosity | 4.11(1.02) | ?0.08 | 0.12 | 4.13(1.03) | ?0.18 | 0.10 | 4.42(0.93) | ?0.18 | ?0.11 |
| Craving | - | - | - | 2.41(1.00) | 0.41 | ?0.11 | 2.72(1.08) | 0.14 | ?0.49 |
| Tolerance | - | - | - | 2.28(1.04) | 0.44 | ?0.38 | 2.57(1.13) | 0.20 | ?0.66 |
| Behavioral Dyscontrol | - | - | - | 2.24(1.07) | 0.52 | ?0.36 | 2.48(1.15) | 0.32 | ?0.66 |
| Withdrawal | - | - | - | 2.00(1.08) | 0.84 | ?0.08 | 2.25(1.13) | 0.53 | ?0.55 |
| Time Extension | - | - | - | 2.57(1.16) | 0.31 | ?0.70 | 2.66(1.13) | 0.16 | ?0.71 |
| Negative Consequences | - | - | - | 1.62(0.93) | 1.36 | 1.03 | 2.01(1.12) | 0.71 | ?0.57 |
| Deception | - | - | - | 1.94(1.06) | 0.91 | 0.11 | 2.22(1.15) | 0.48 | ?0.73 |
| Escape | - | - | - | 2.24(1.18) | 0.62 | ?0.45 | 2.52(1.28) | 0.30 | ?0.94 |
Table 1 Descriptive Statistics of Internet Adaptation and Internet Addiction Dimensions
| Dimension | N = 5783 | N = 1235 (T1) | N = 1235 (T2) | ||||||
|---|---|---|---|---|---|---|---|---|---|
| Mean (SD) | Skewness | Kurtosis | Mean (SD) | Skewness | Kurtosis | Mean (SD) | Skewness | Kurtosis | |
| Self-Control | 3.95(1.07) | 0.11 | ?0.15 | 4.13(1.06) | 0.03 | ?0.43 | 4.49(0.93) | ?0.25 | ?0.28 |
| Interpersonal Interaction | 3.87 (1.06) | ?0.04 | ?0.08 | 3.93(1.07) | ?0.17 | ?0.13 | 4.44(0.92) | ?0.19 | ?0.27 |
| Information search | 4.07(1.15) | ?0.21 | ?0.13 | 4.07(1.17) | ?0.31 | ?0.11 | 4.36(1.06) | ?0.41 | 0.00 |
| Information Protection | 4.39(1.09) | ?0.26 | ?0.44 | 4.50(1.06) | ?0.38 | ?0.42 | 4.53(0.96) | ?0.40 | ?0.10 |
| Proactive Coping | 4.54(1.05) | ?0.32 | ?0.31 | 4.72(0.99) | ?0.38 | ?0.52 | 4.65(0.93) | ?0.43 | 0.25 |
| Learning Ability | 4.06(1.04) | ?0.06 | 0.13 | 4.05(1.06) | ?0.13 | 0.06 | 4.49(0.95) | ?0.29 | ?0.04 |
| Self-Efficacy | 3.97(1.11) | 0.01 | ?0.10 | 3.94(1.15) | ?0.08 | ?0.20 | 4.48(0.98) | ?0.31 | ?0.08 |
| Curiosity | 4.11(1.02) | ?0.08 | 0.12 | 4.13(1.03) | ?0.18 | 0.10 | 4.42(0.93) | ?0.18 | ?0.11 |
| Craving | - | - | - | 2.41(1.00) | 0.41 | ?0.11 | 2.72(1.08) | 0.14 | ?0.49 |
| Tolerance | - | - | - | 2.28(1.04) | 0.44 | ?0.38 | 2.57(1.13) | 0.20 | ?0.66 |
| Behavioral Dyscontrol | - | - | - | 2.24(1.07) | 0.52 | ?0.36 | 2.48(1.15) | 0.32 | ?0.66 |
| Withdrawal | - | - | - | 2.00(1.08) | 0.84 | ?0.08 | 2.25(1.13) | 0.53 | ?0.55 |
| Time Extension | - | - | - | 2.57(1.16) | 0.31 | ?0.70 | 2.66(1.13) | 0.16 | ?0.71 |
| Negative Consequences | - | - | - | 1.62(0.93) | 1.36 | 1.03 | 2.01(1.12) | 0.71 | ?0.57 |
| Deception | - | - | - | 1.94(1.06) | 0.91 | 0.11 | 2.22(1.15) | 0.48 | ?0.73 |
| Escape | - | - | - | 2.24(1.18) | 0.62 | ?0.45 | 2.52(1.28) | 0.30 | ?0.94 |
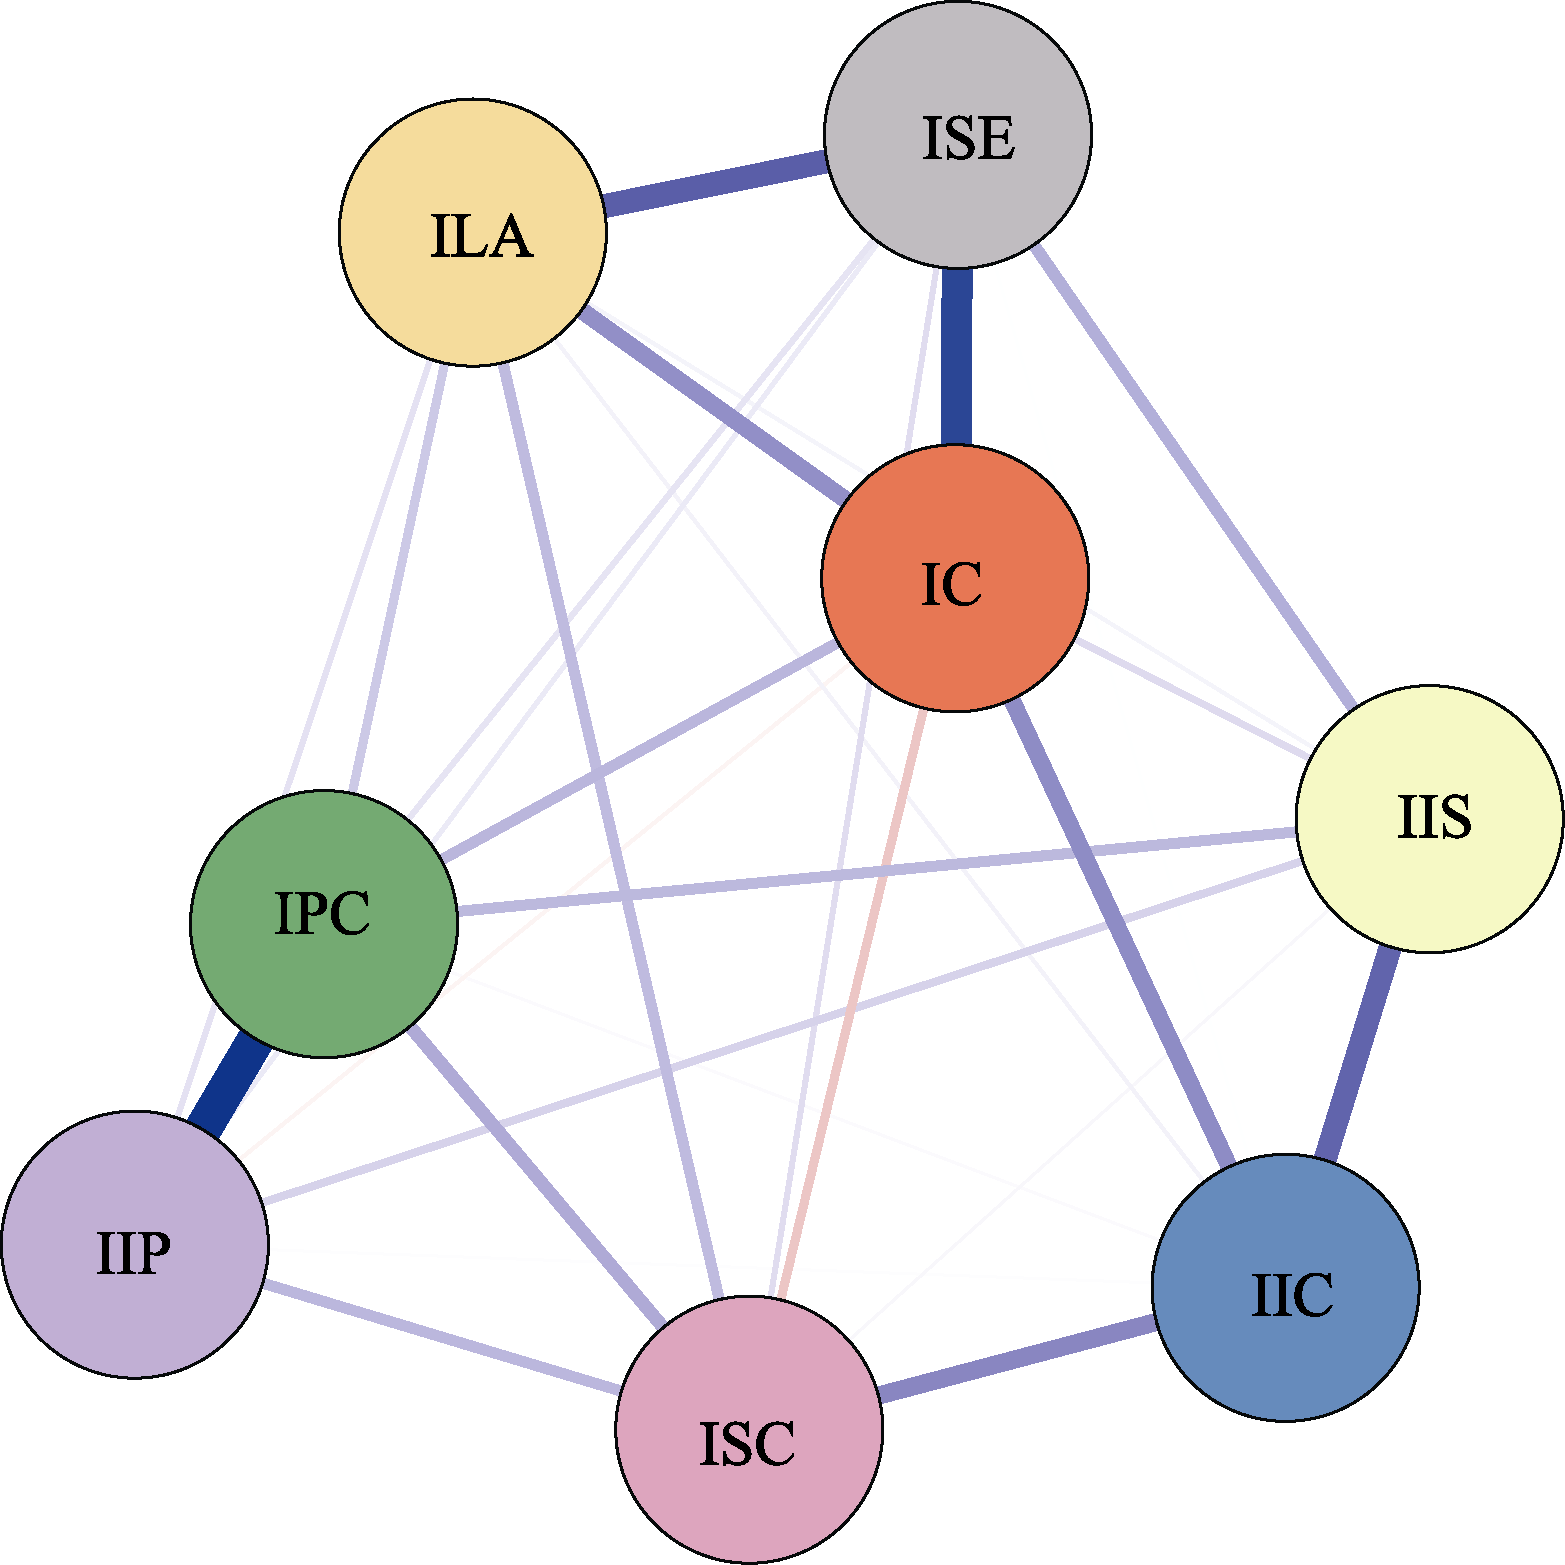
Figure 2. Regularized partial correlation network of internal dimensions of internet adaptation. Note. The thicker the edge, the stronger the conditional correlation between nodes. Blue edges indicate positive relationships, and red edges indicate negative relationships. For a color version, please refer to the electronic version.
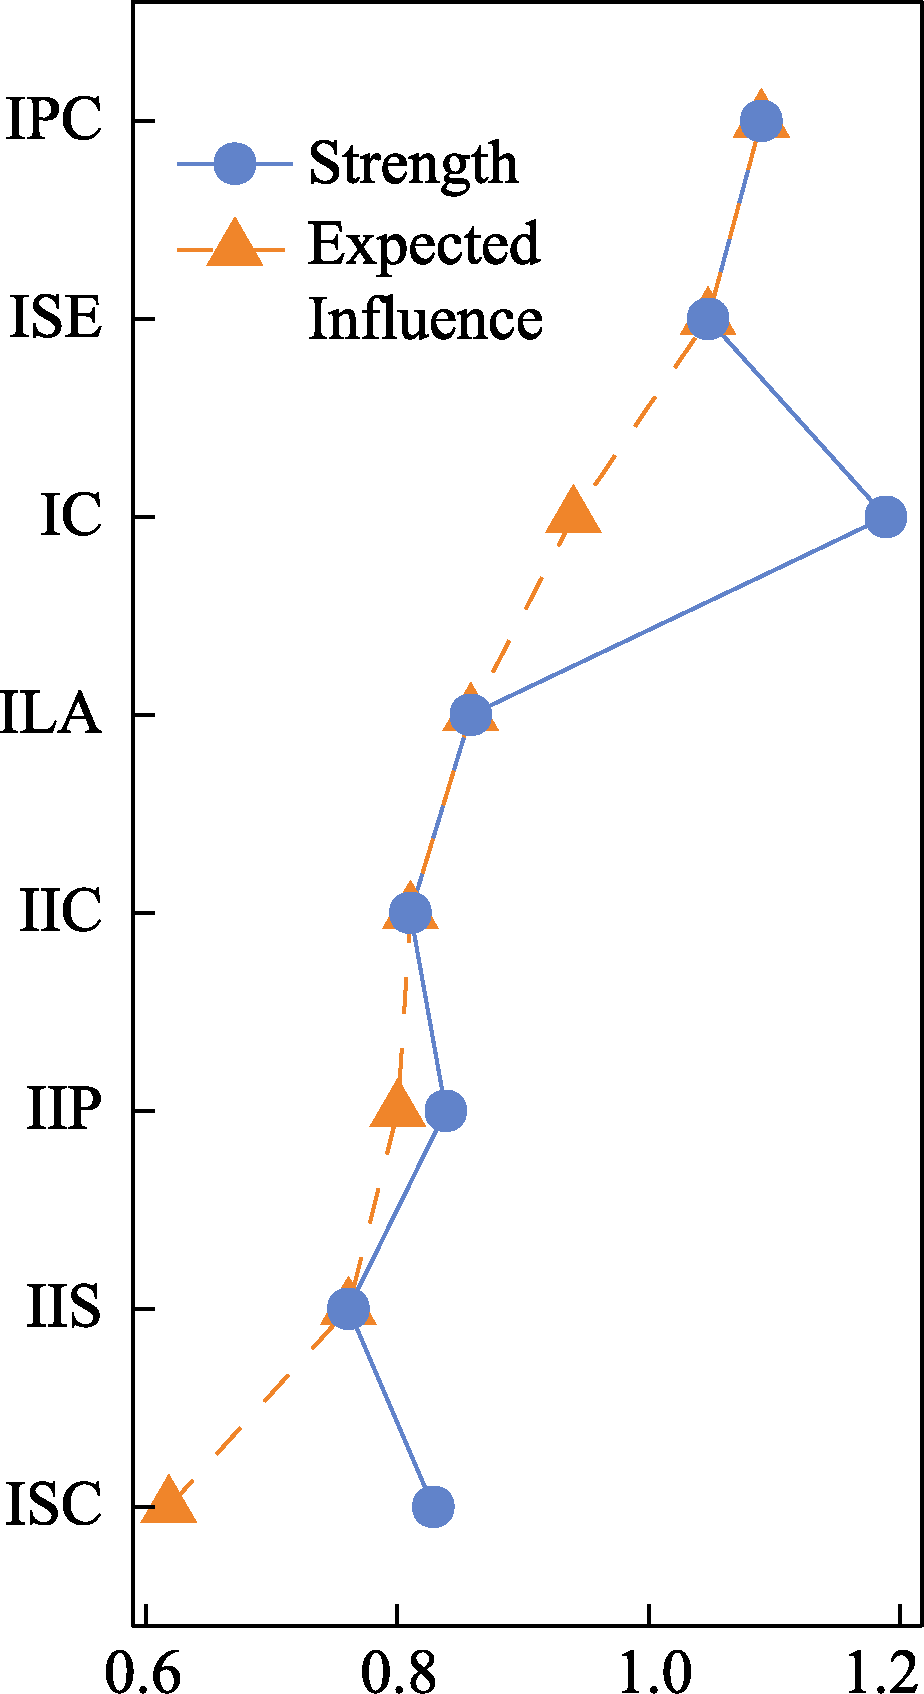
Figure 3. Node strength and expected impact of internet adaptation.
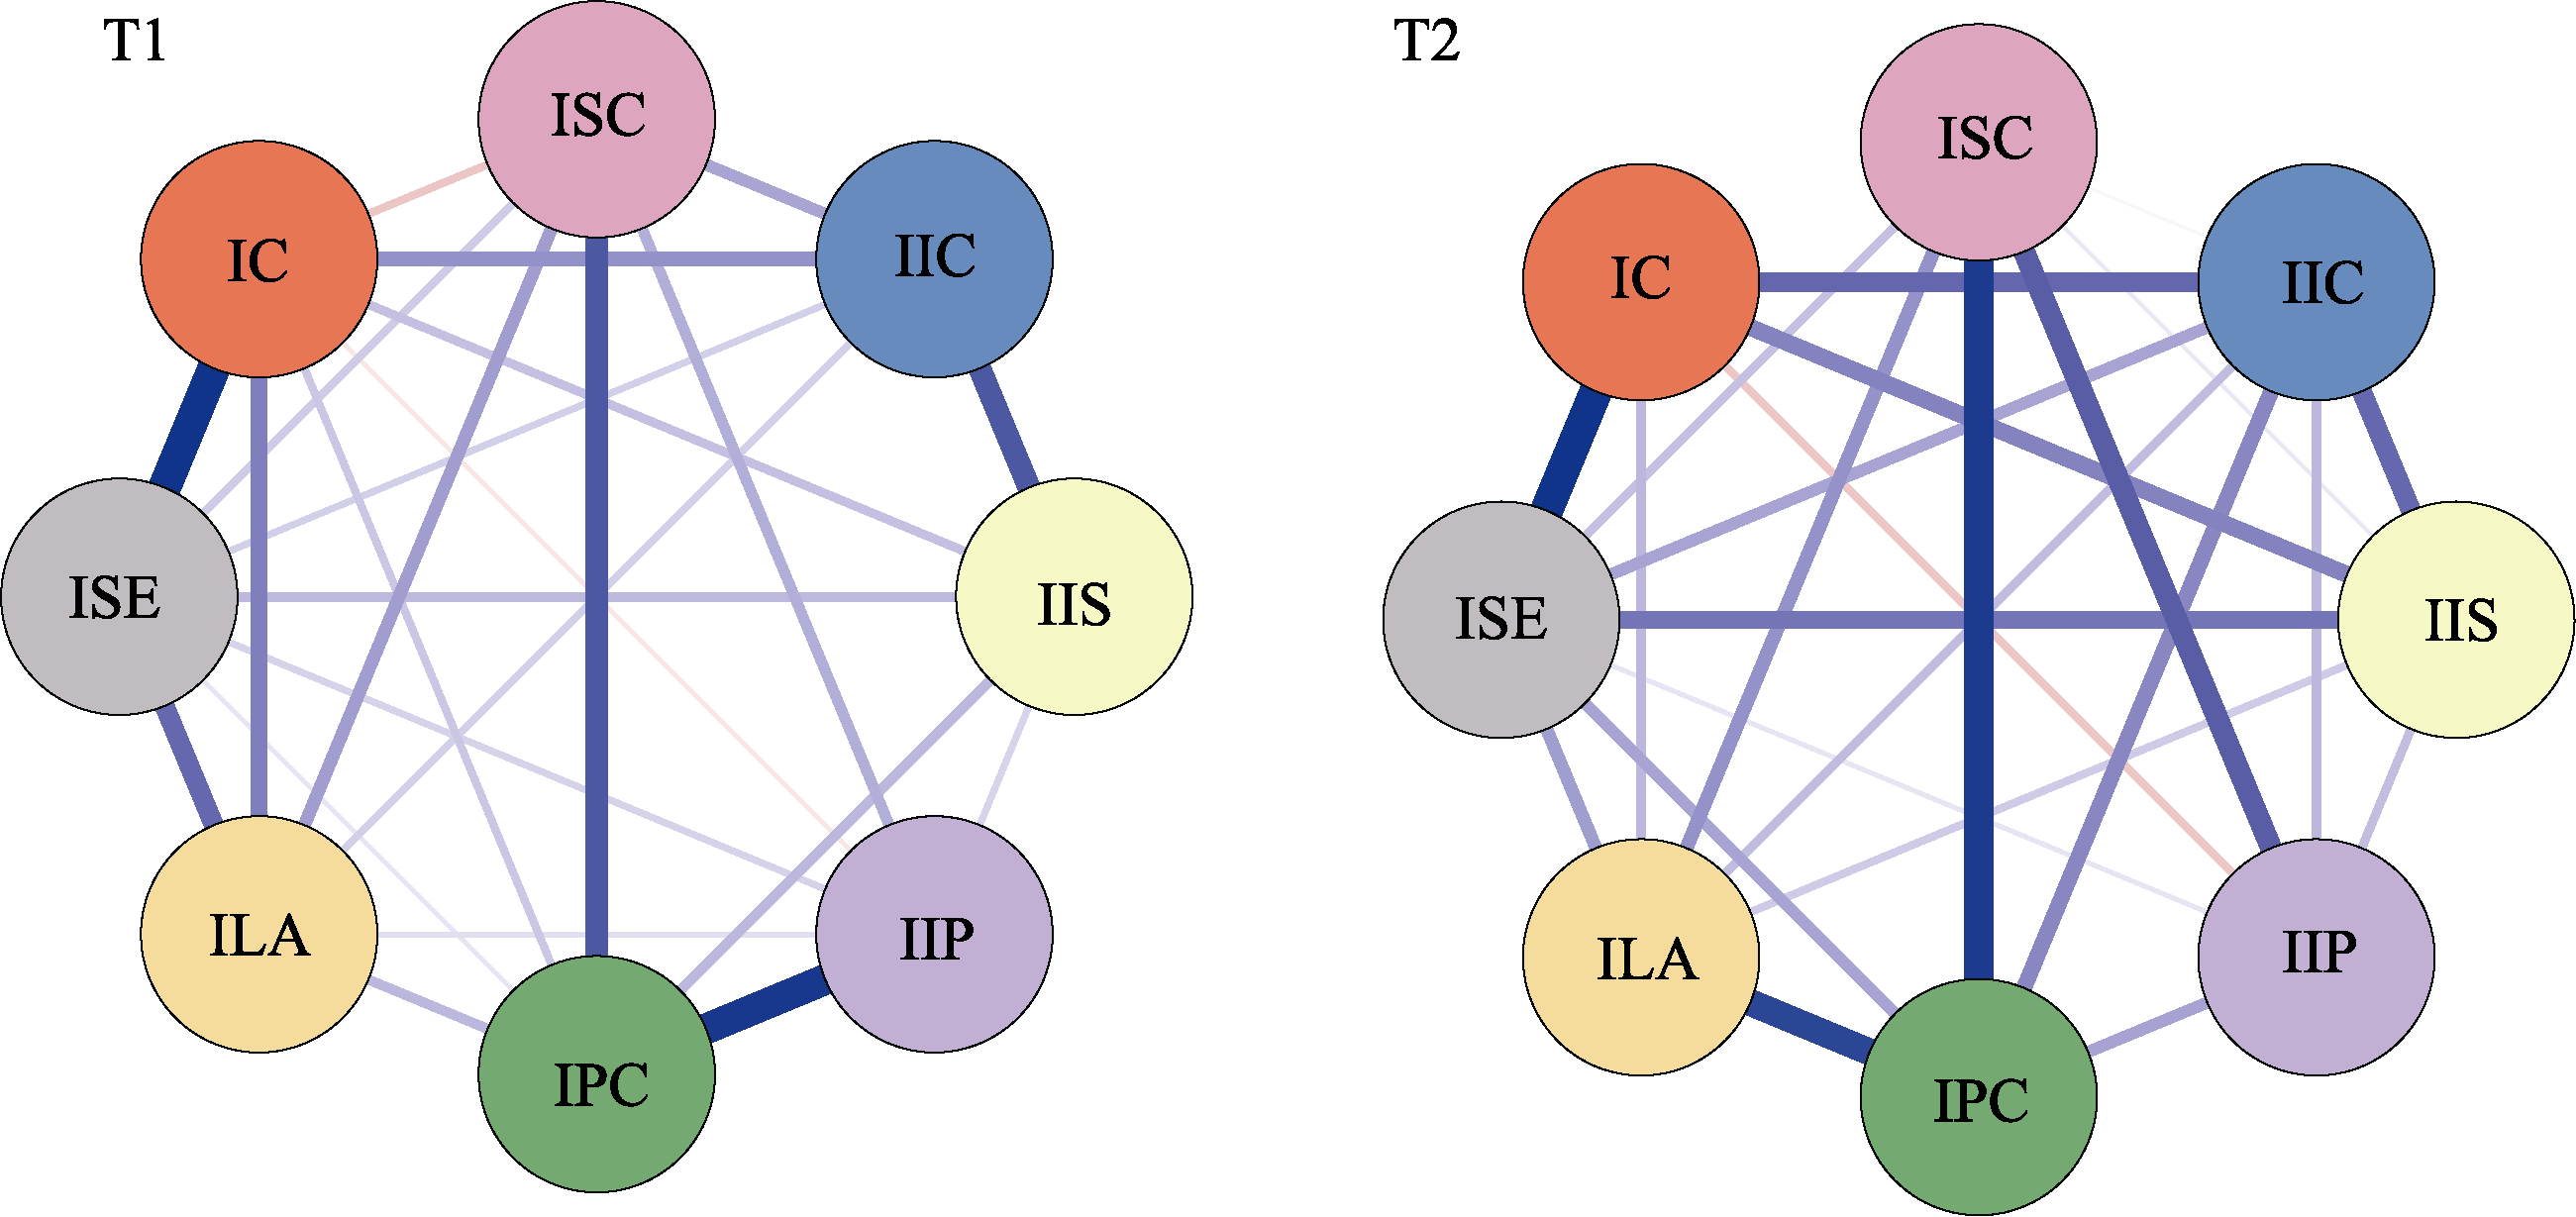
Figure 4. Cross-sectional network at T1 and T2. Note. For visual comparison, the network is presented in a circular layout.
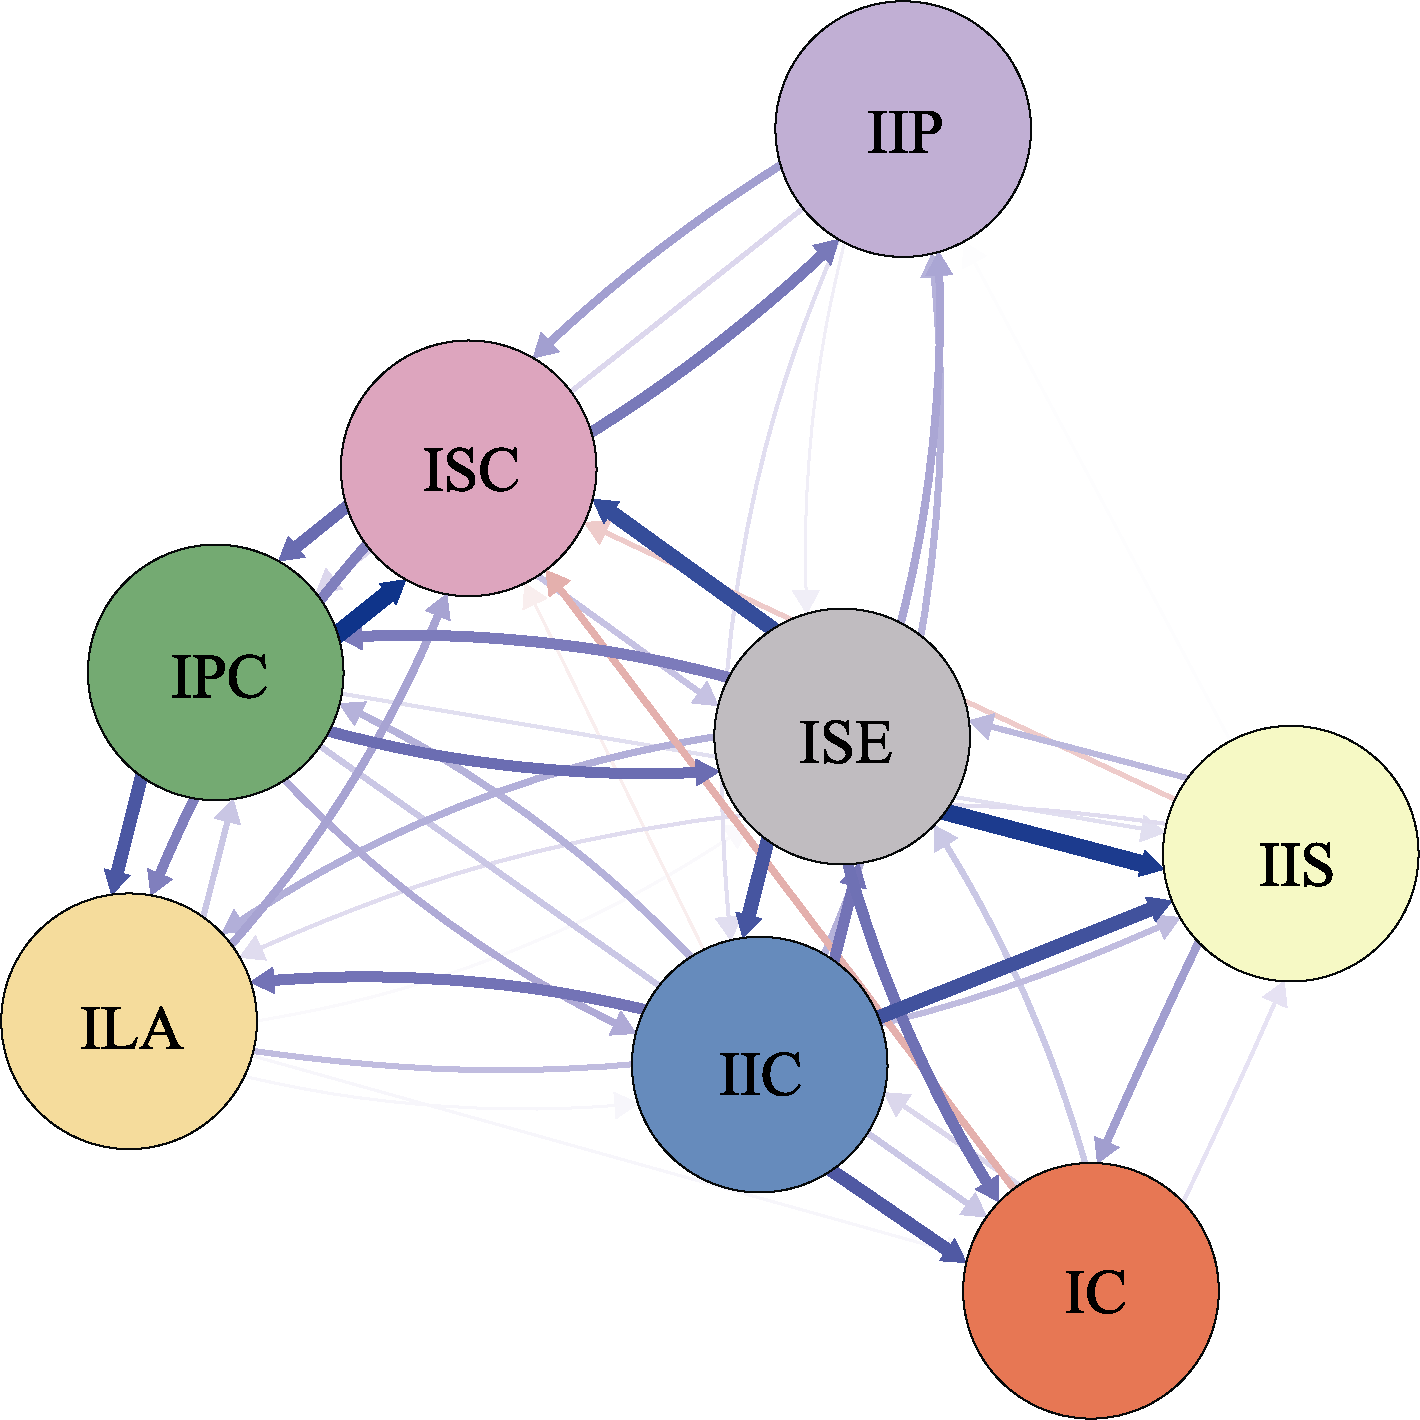
Figure 5. Cross-lagged network of adolescent internet adaptation (Autoregressive paths omitted).
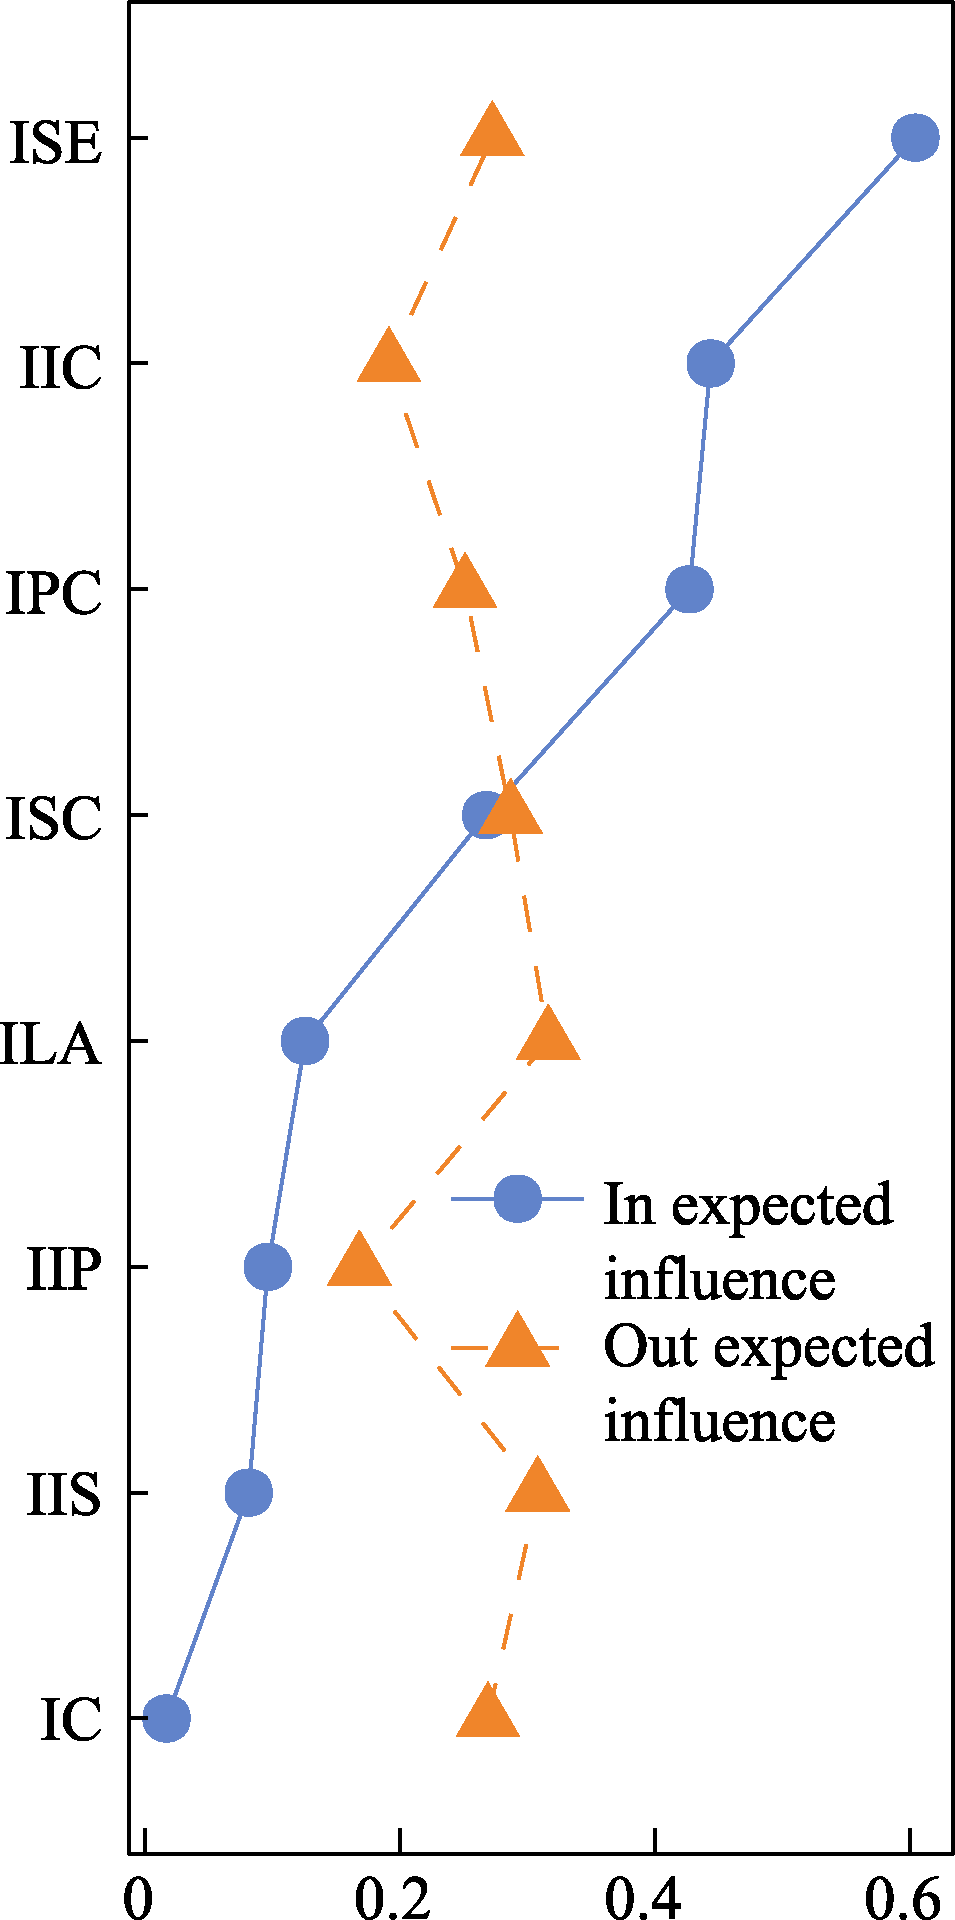
Figure 6. Outgoing and incoming predicted effects in the cross- lagged network of internet adaptation.
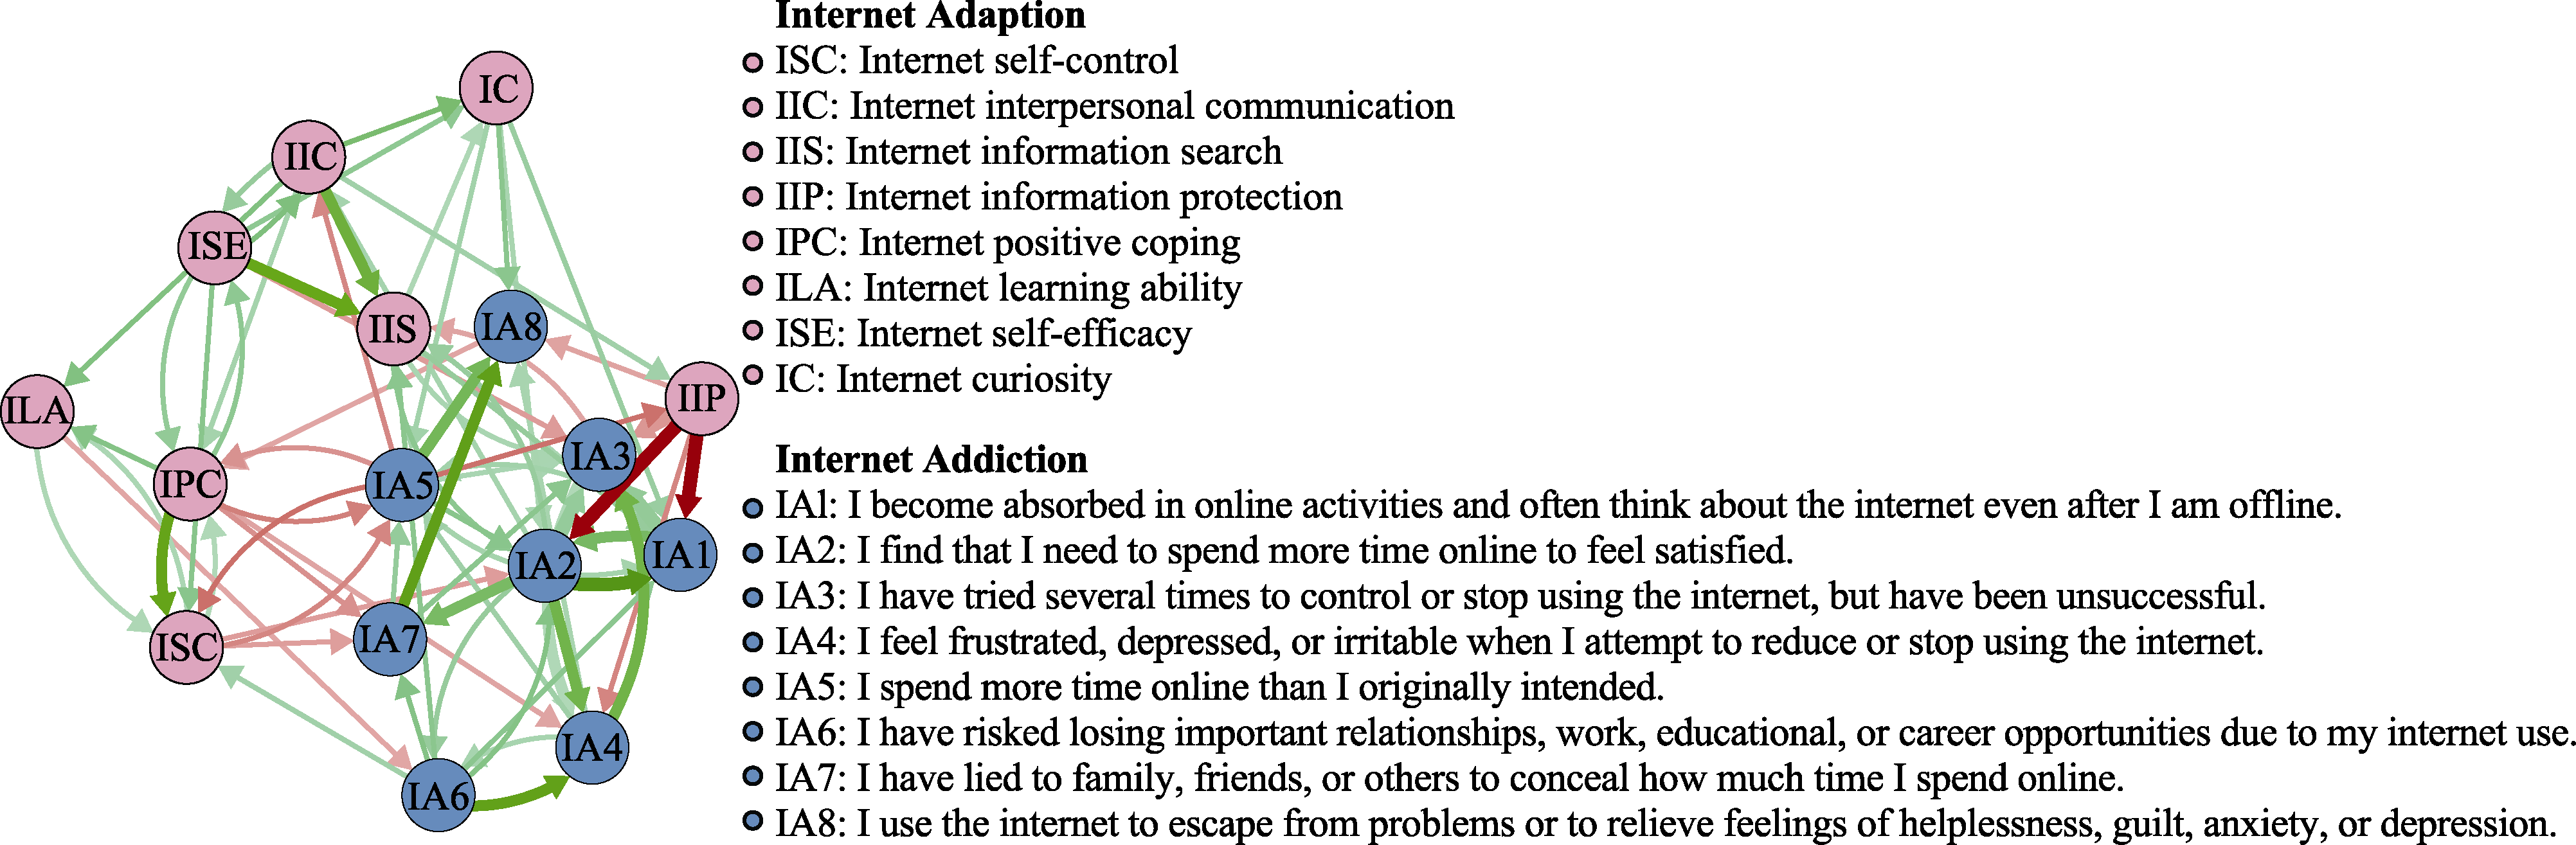
Figure 7. Cross-lagged network model of T1 internet adaptation and T2 internet addiction. Note. The model represents the temporal interactions between internet adaptation and internet addiction over two time points.
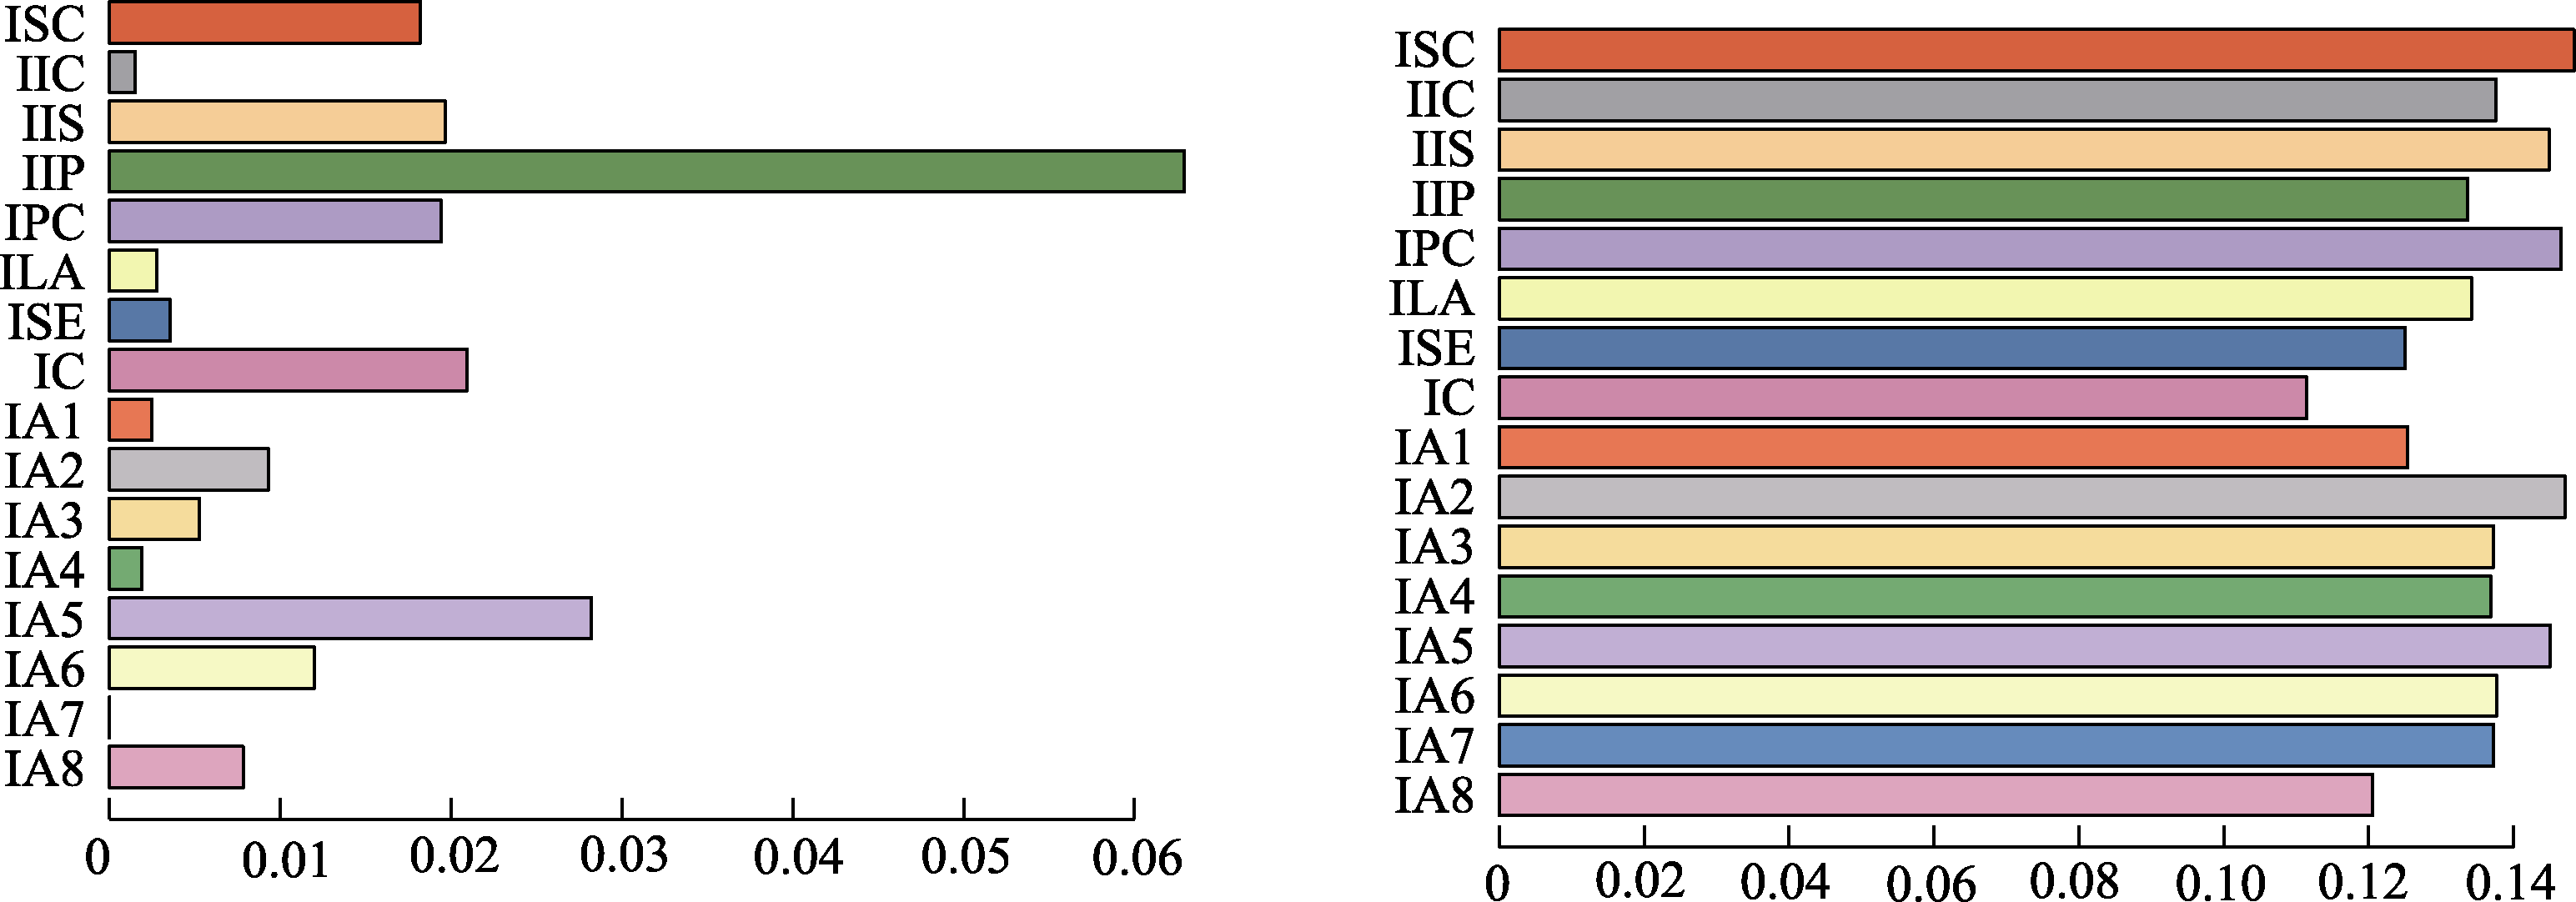
Figure 8. Cross-cluster outgoing predictability (left) and incoming predictability (right) in the cross-lagged network of internet adaptation and internet addiction.
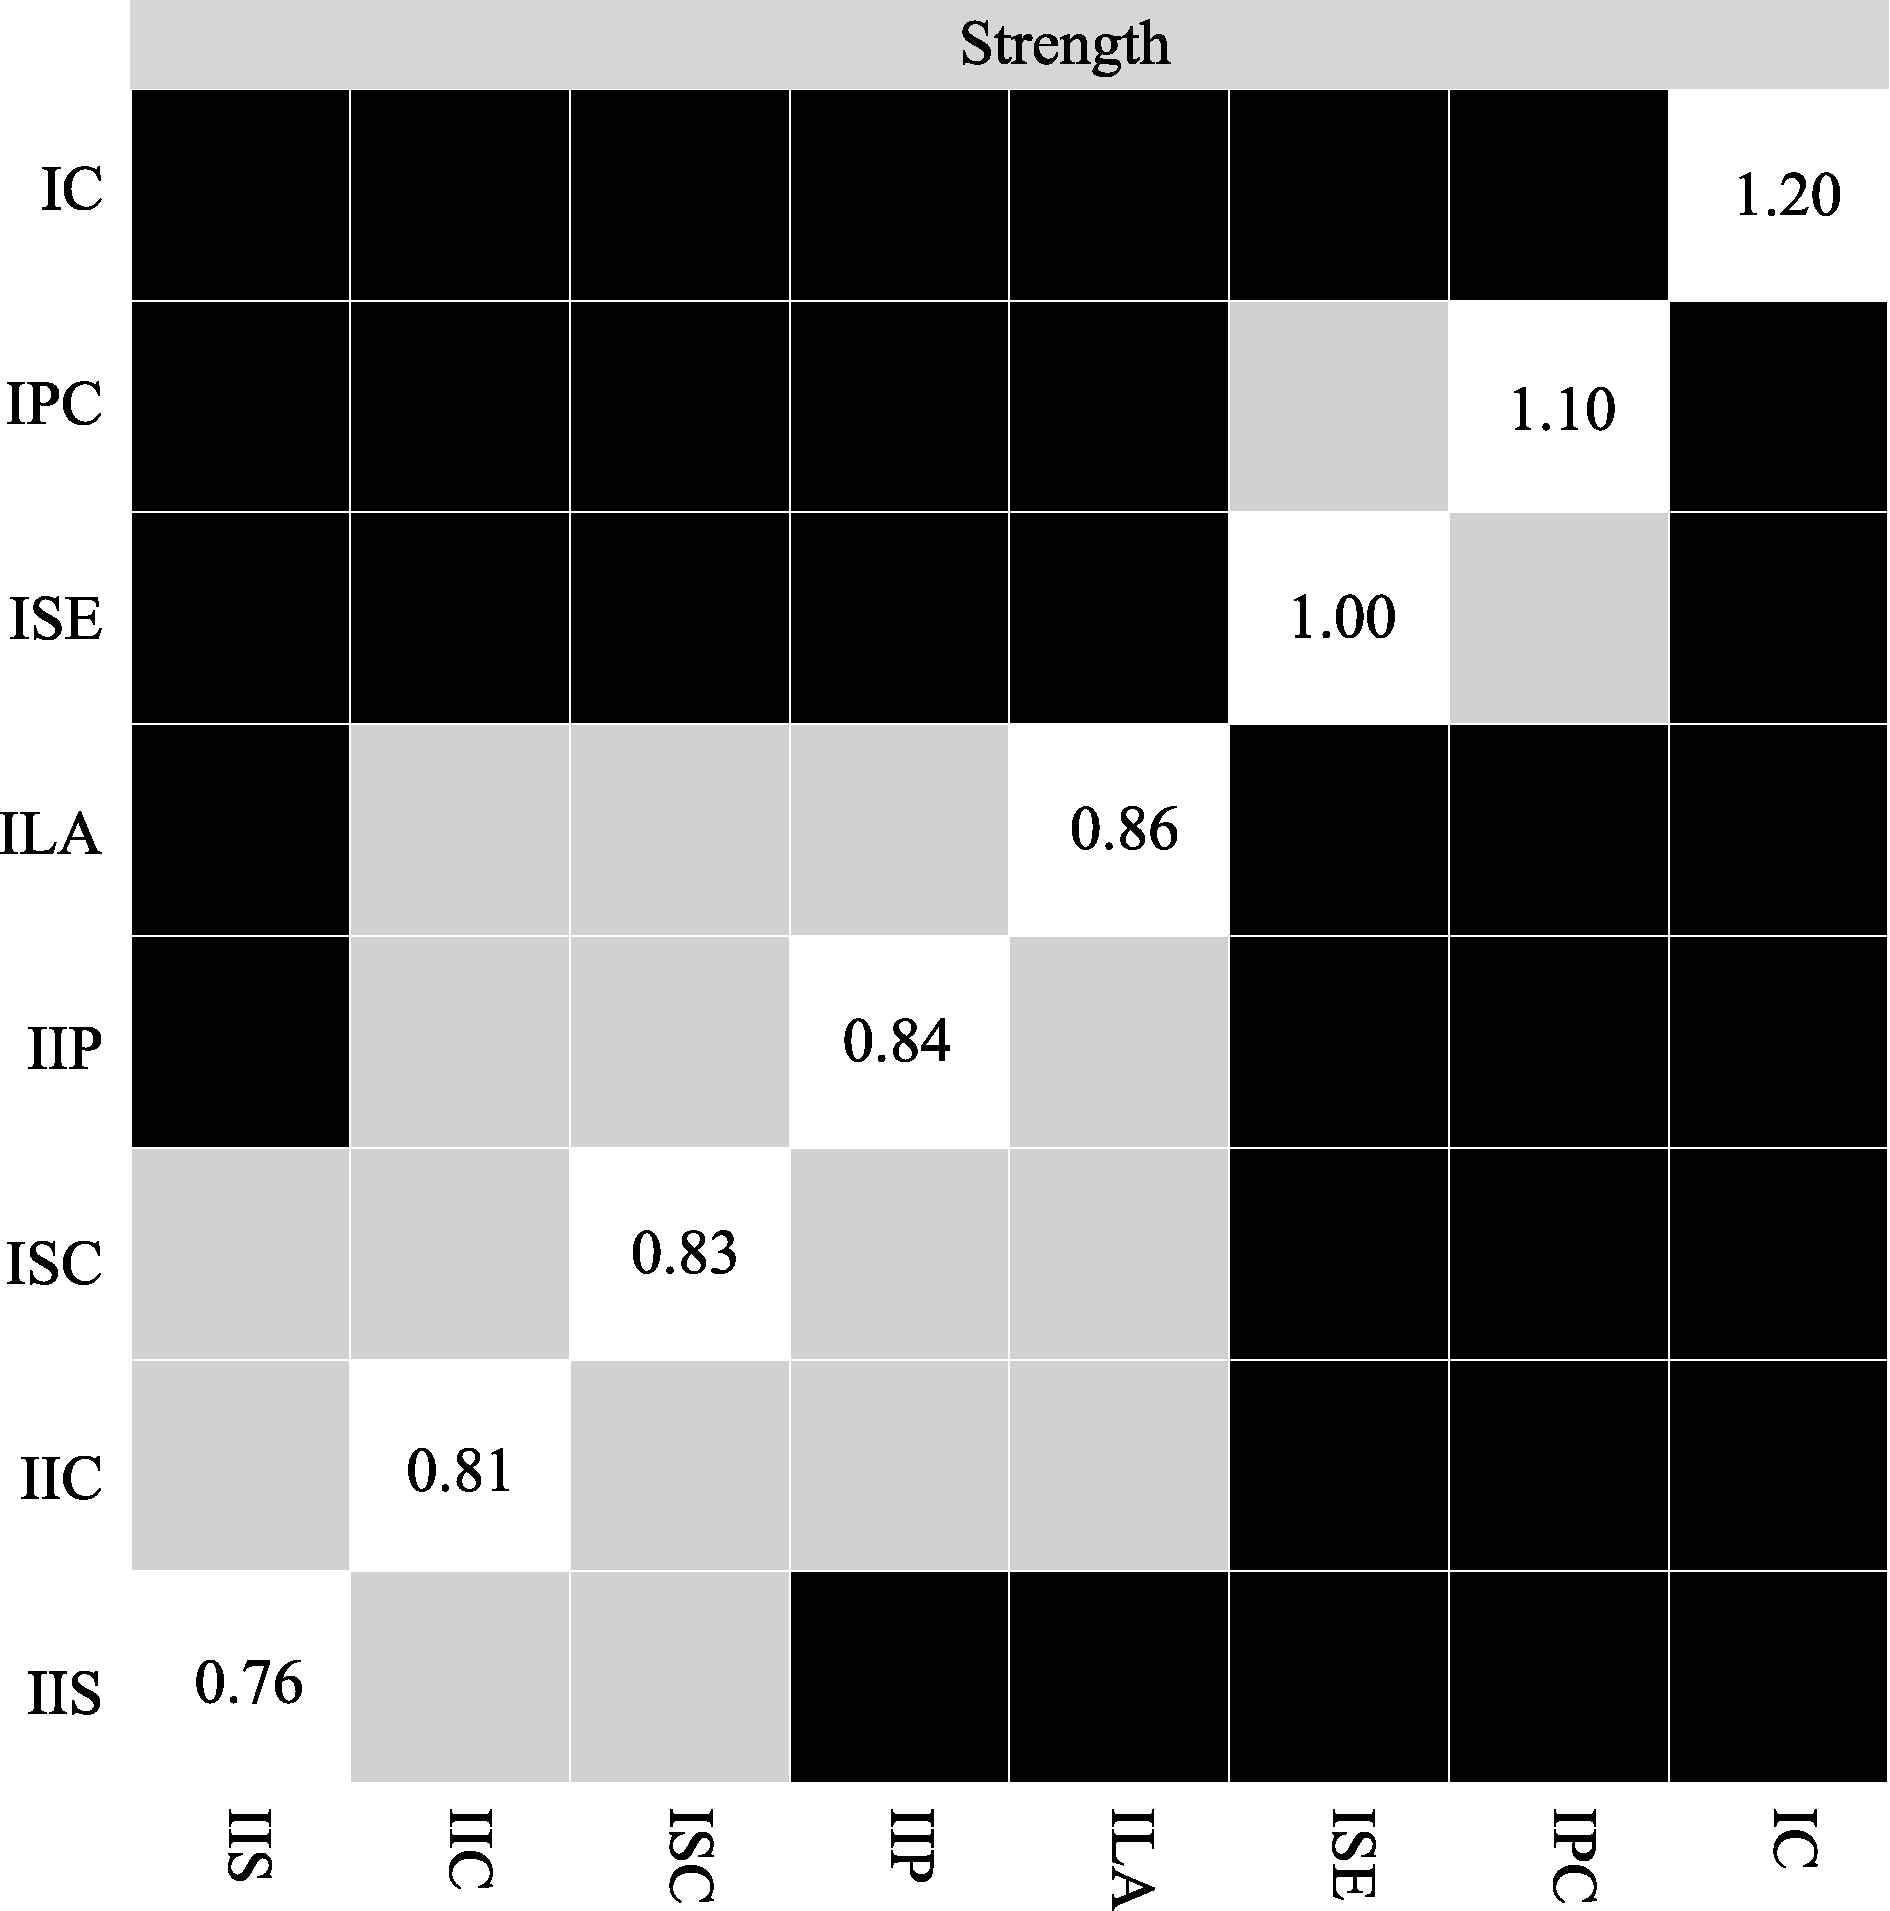
Figure S1. Nonparametric bootstrap method for testing network adaptation to the strength difference of individual nodes of the transect network. Note. Black squares in the figure indicate that the 95% confidence interval corresponding to the difference in the strengths of the two nodes derived from the bootstrap method does not contain zero, while gray squares indicate that the 95% confidence interval corresponding to the difference in the strengths of the two nodes contains zero. The diagonal lines indicate the magnitude of the individual node intensities (below).
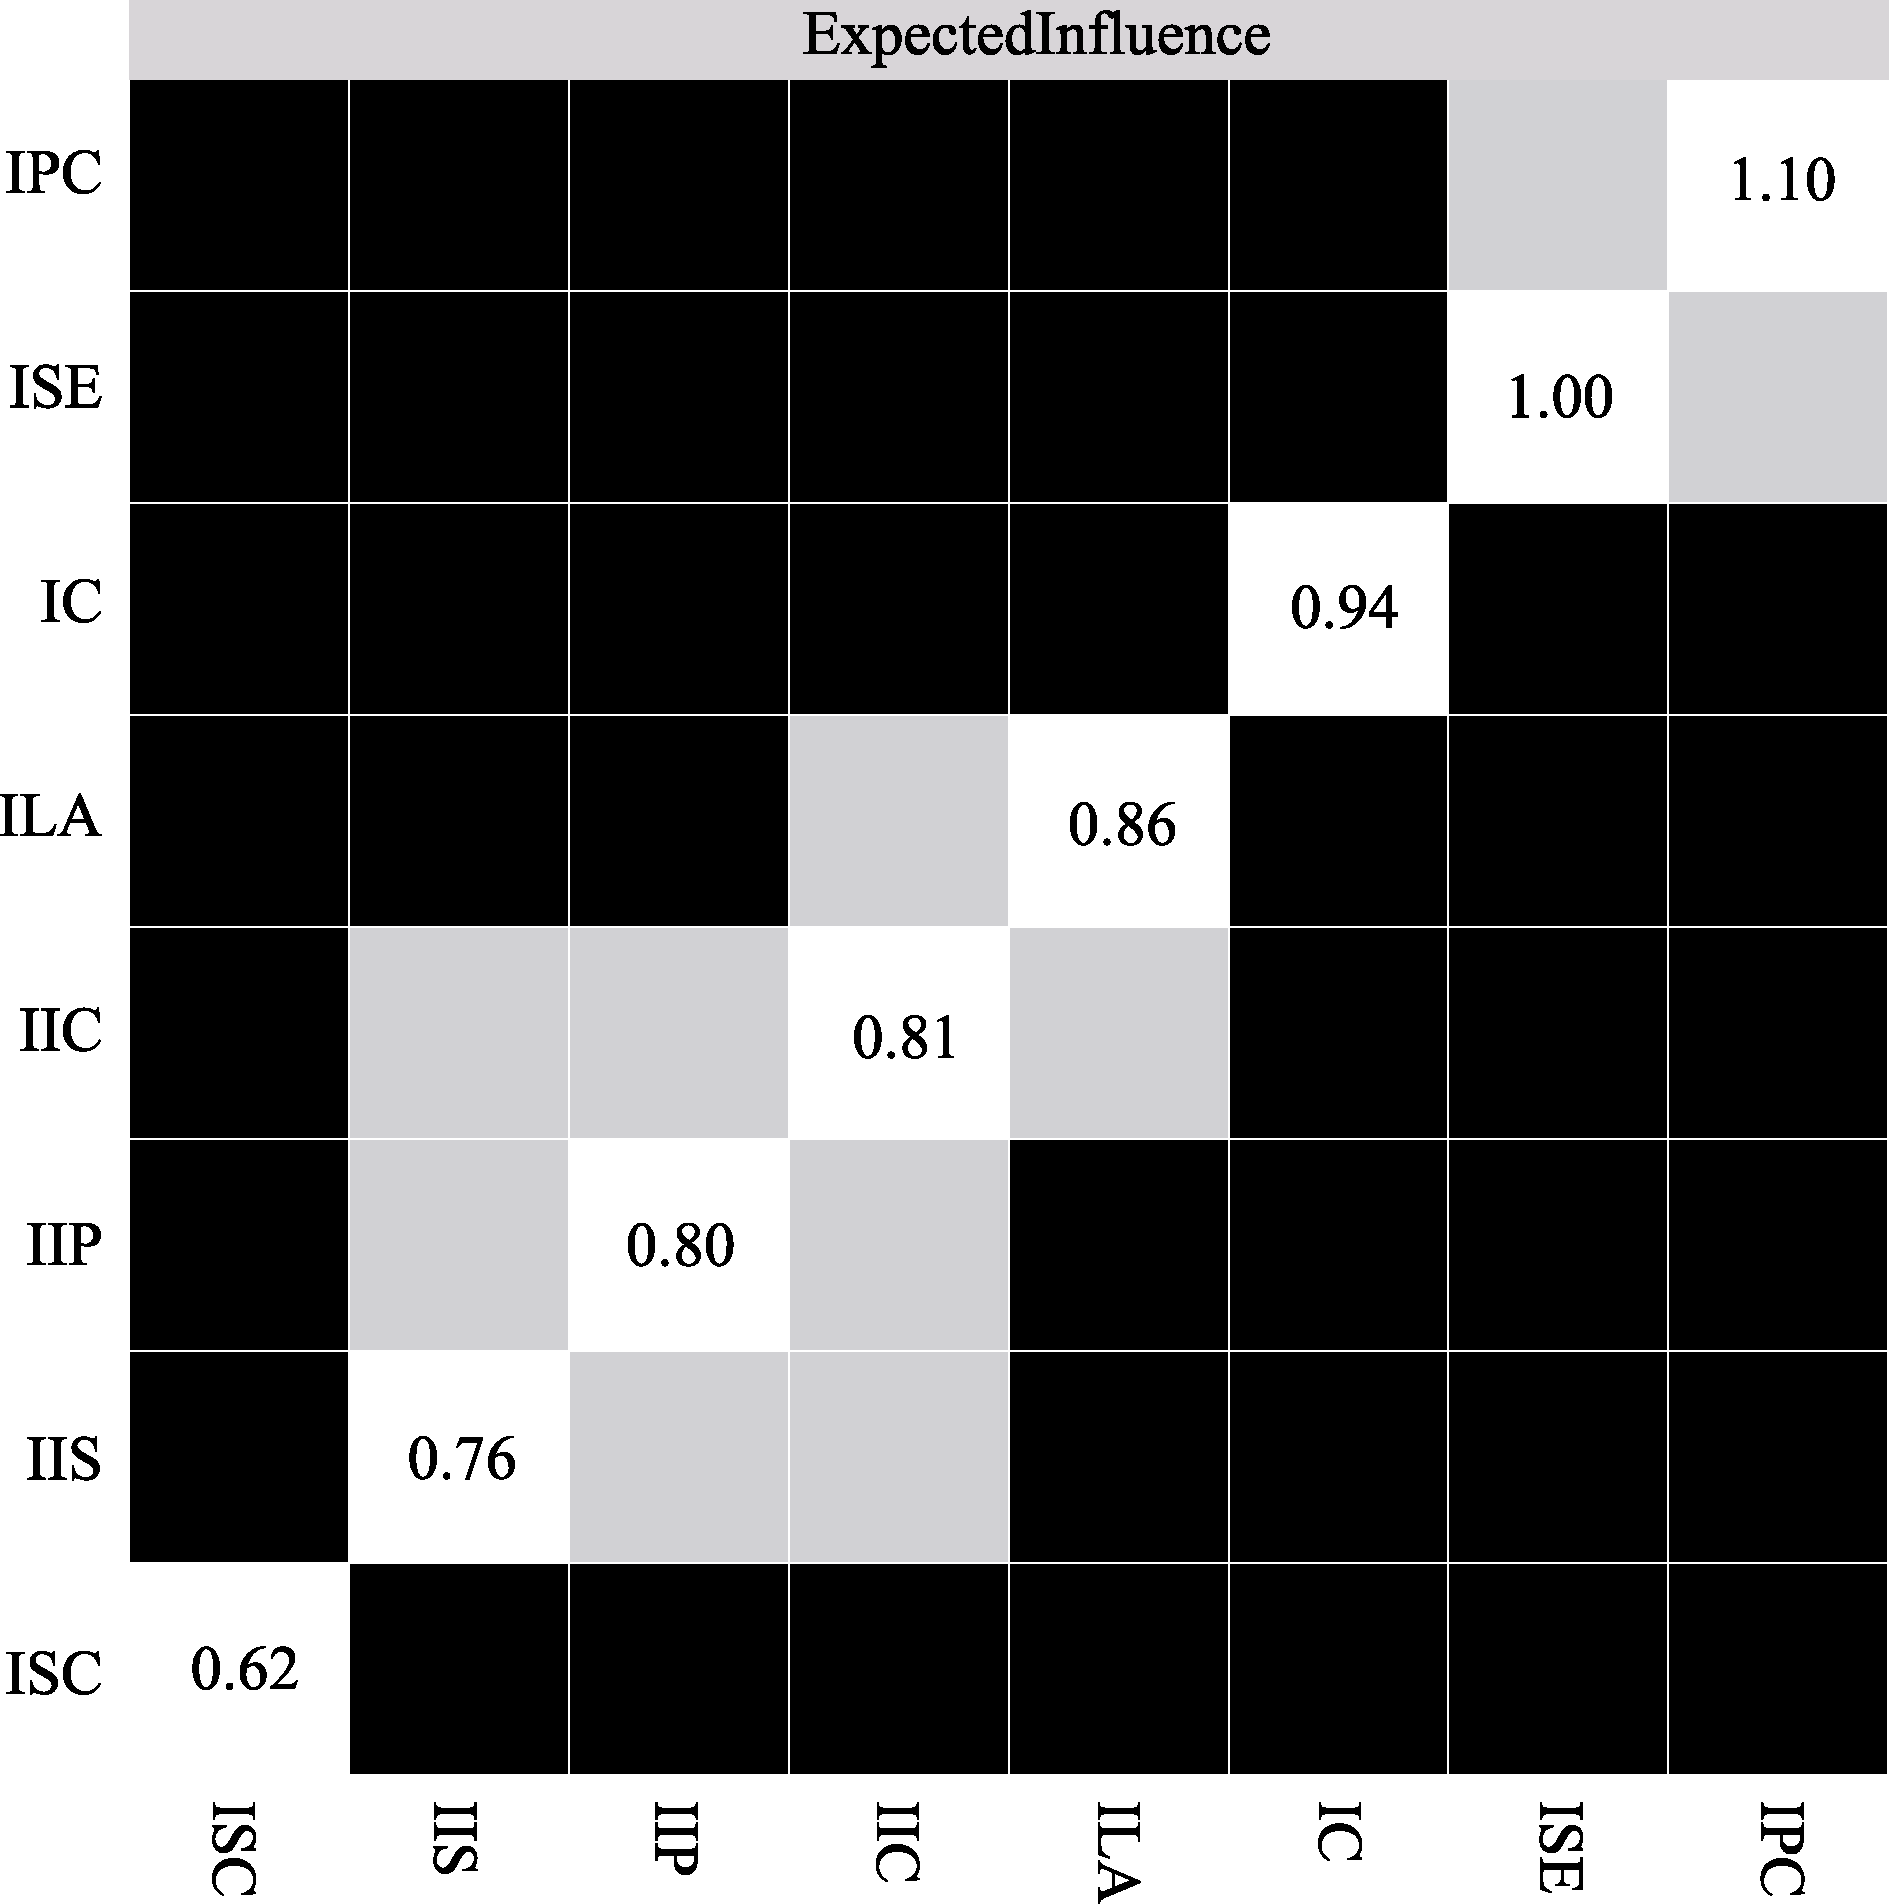
Figure S2. Nonparametric bootstrap method for testing network adaptation to transect differences in the expected impact of individual nodes of the network.
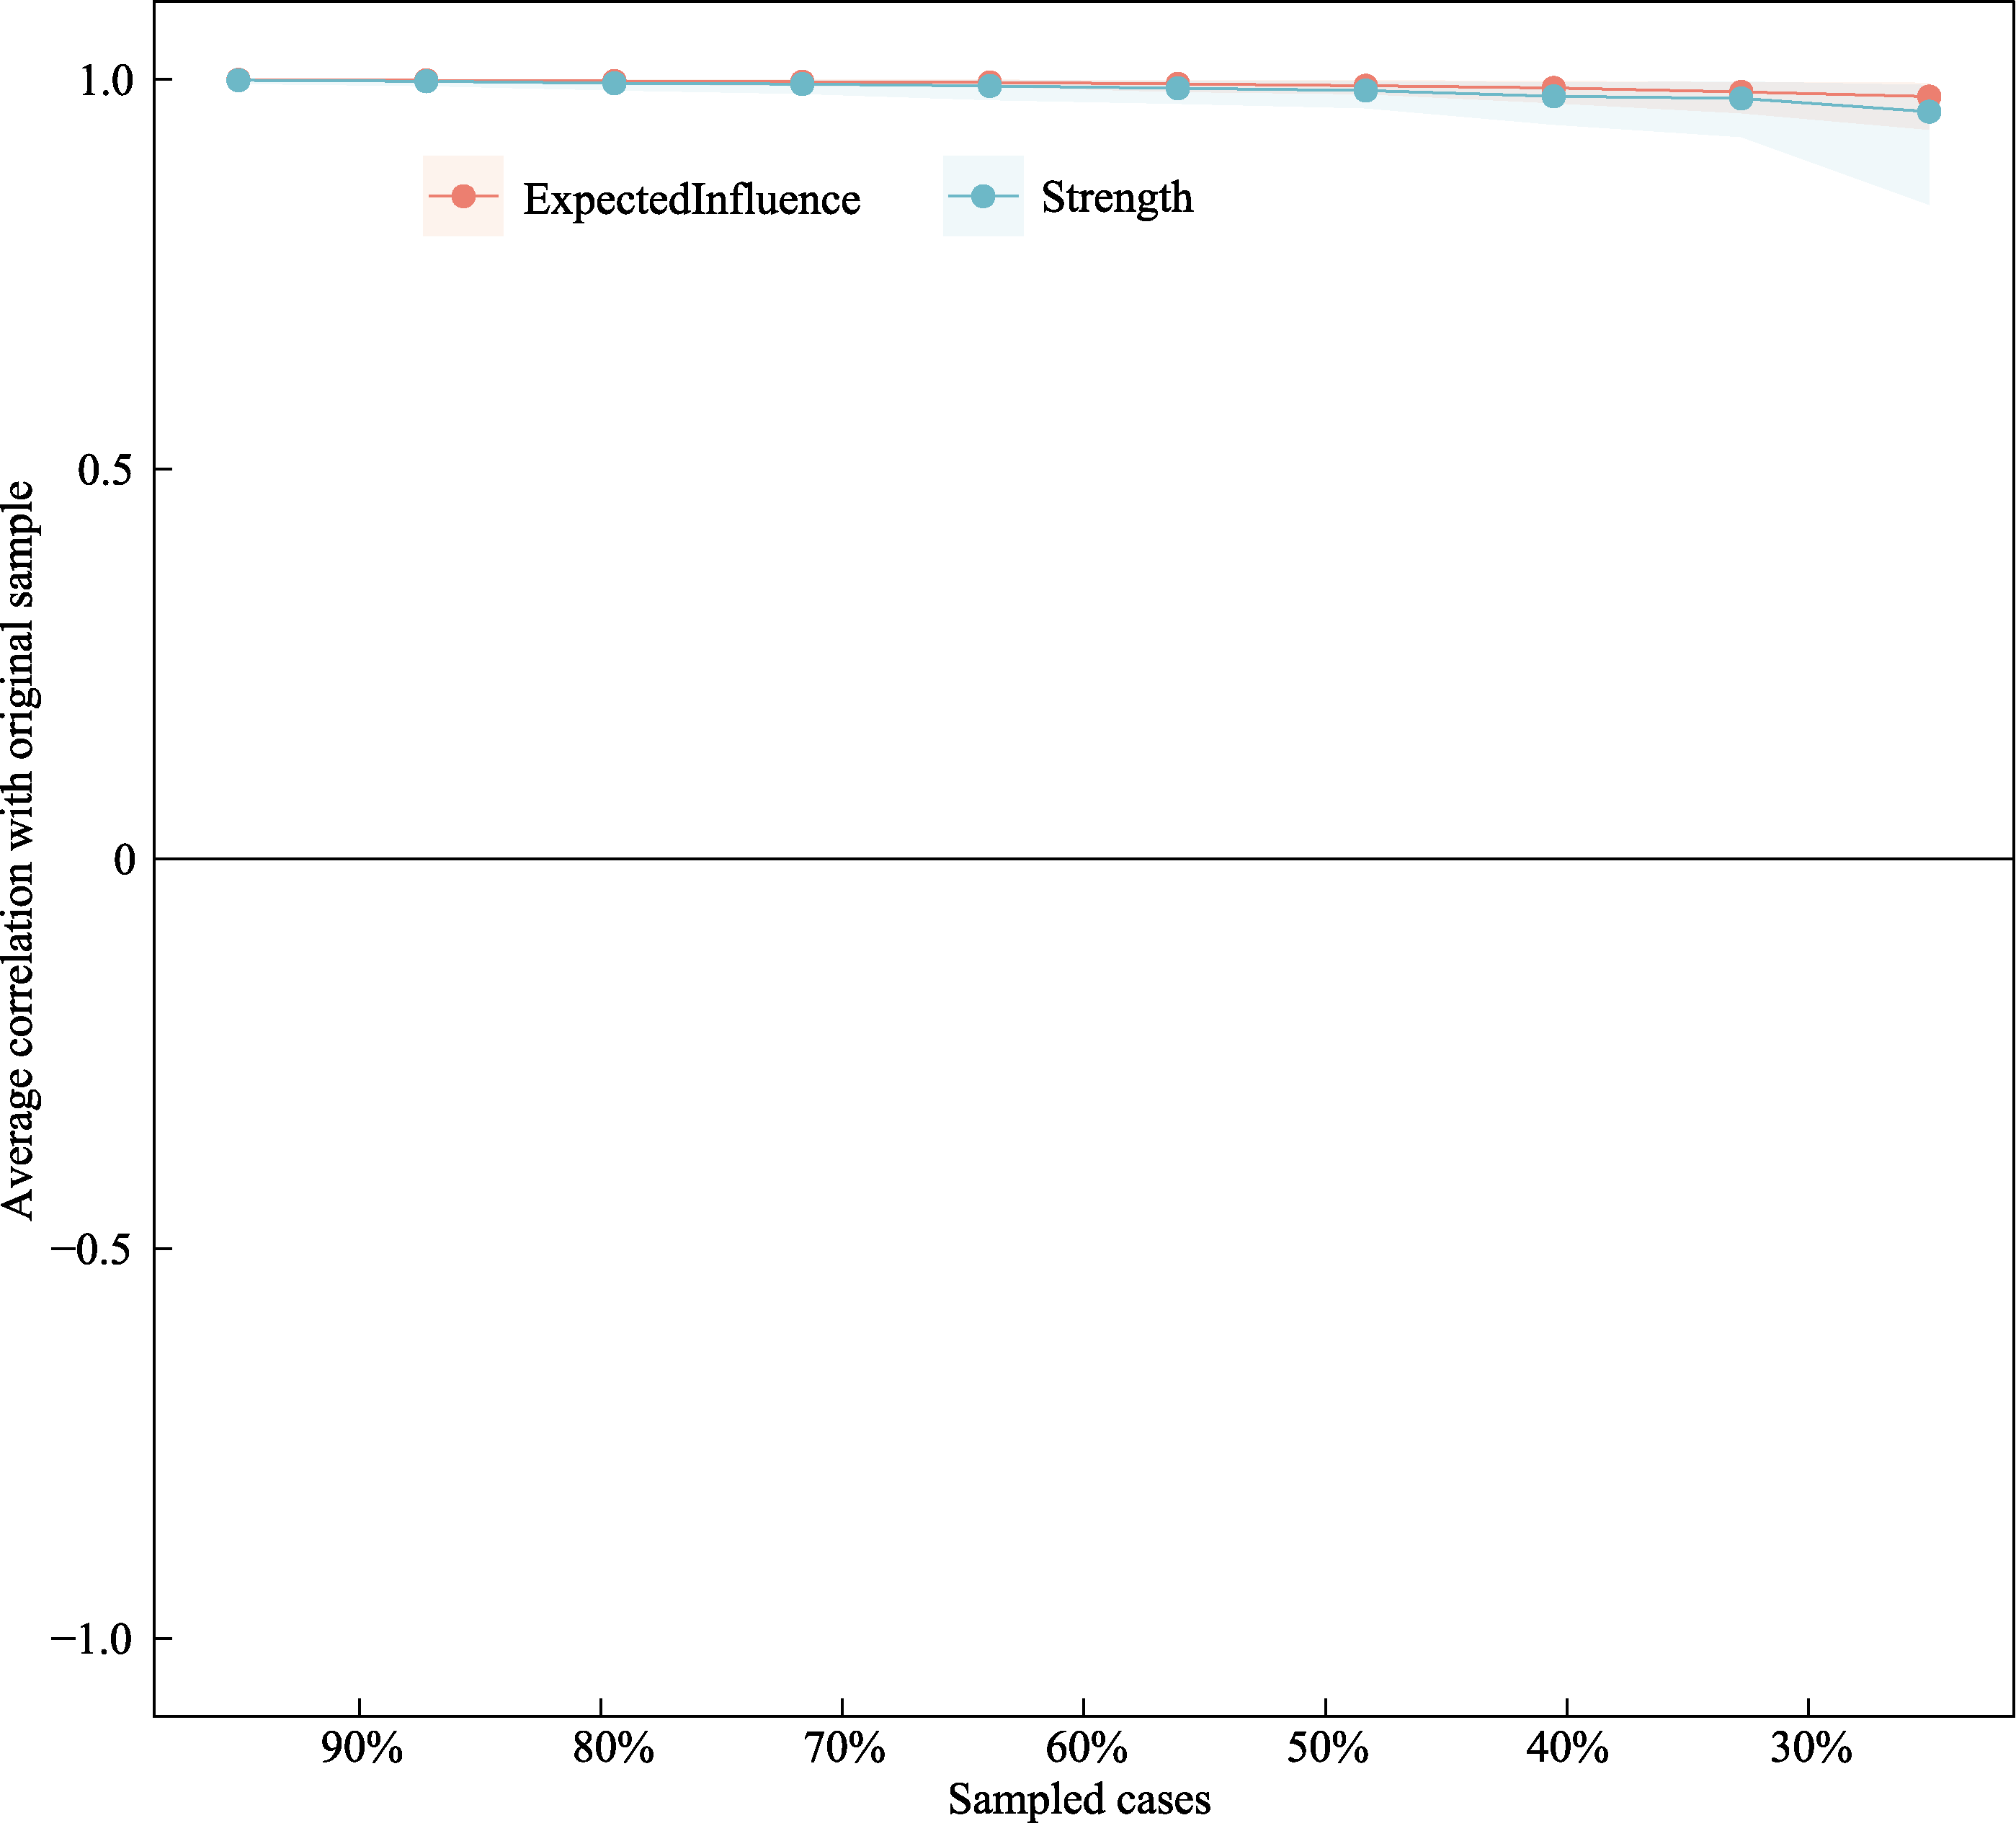
Figure S3. Stability test results of the Case-droping method for testing network adaptation to intensity and expected impacts in the transect network Note: The X-axis indicates the percentage of remaining after randomly dropping samples on the original sample; the Y-axis indicates the correlation of the centrality metrics between the remaining samples and the original sample. Points on the lines in the figure indicate the average correlation (from 90% to 10%) between the intensity estimated in the full sample and the intensity estimated on a random subsample that retains only a percentage of cases. Shaded areas indicate 95% bootstrap confidence intervals for the correlation estimates. Higher values indicate better stability of the centrality estimates. (below)
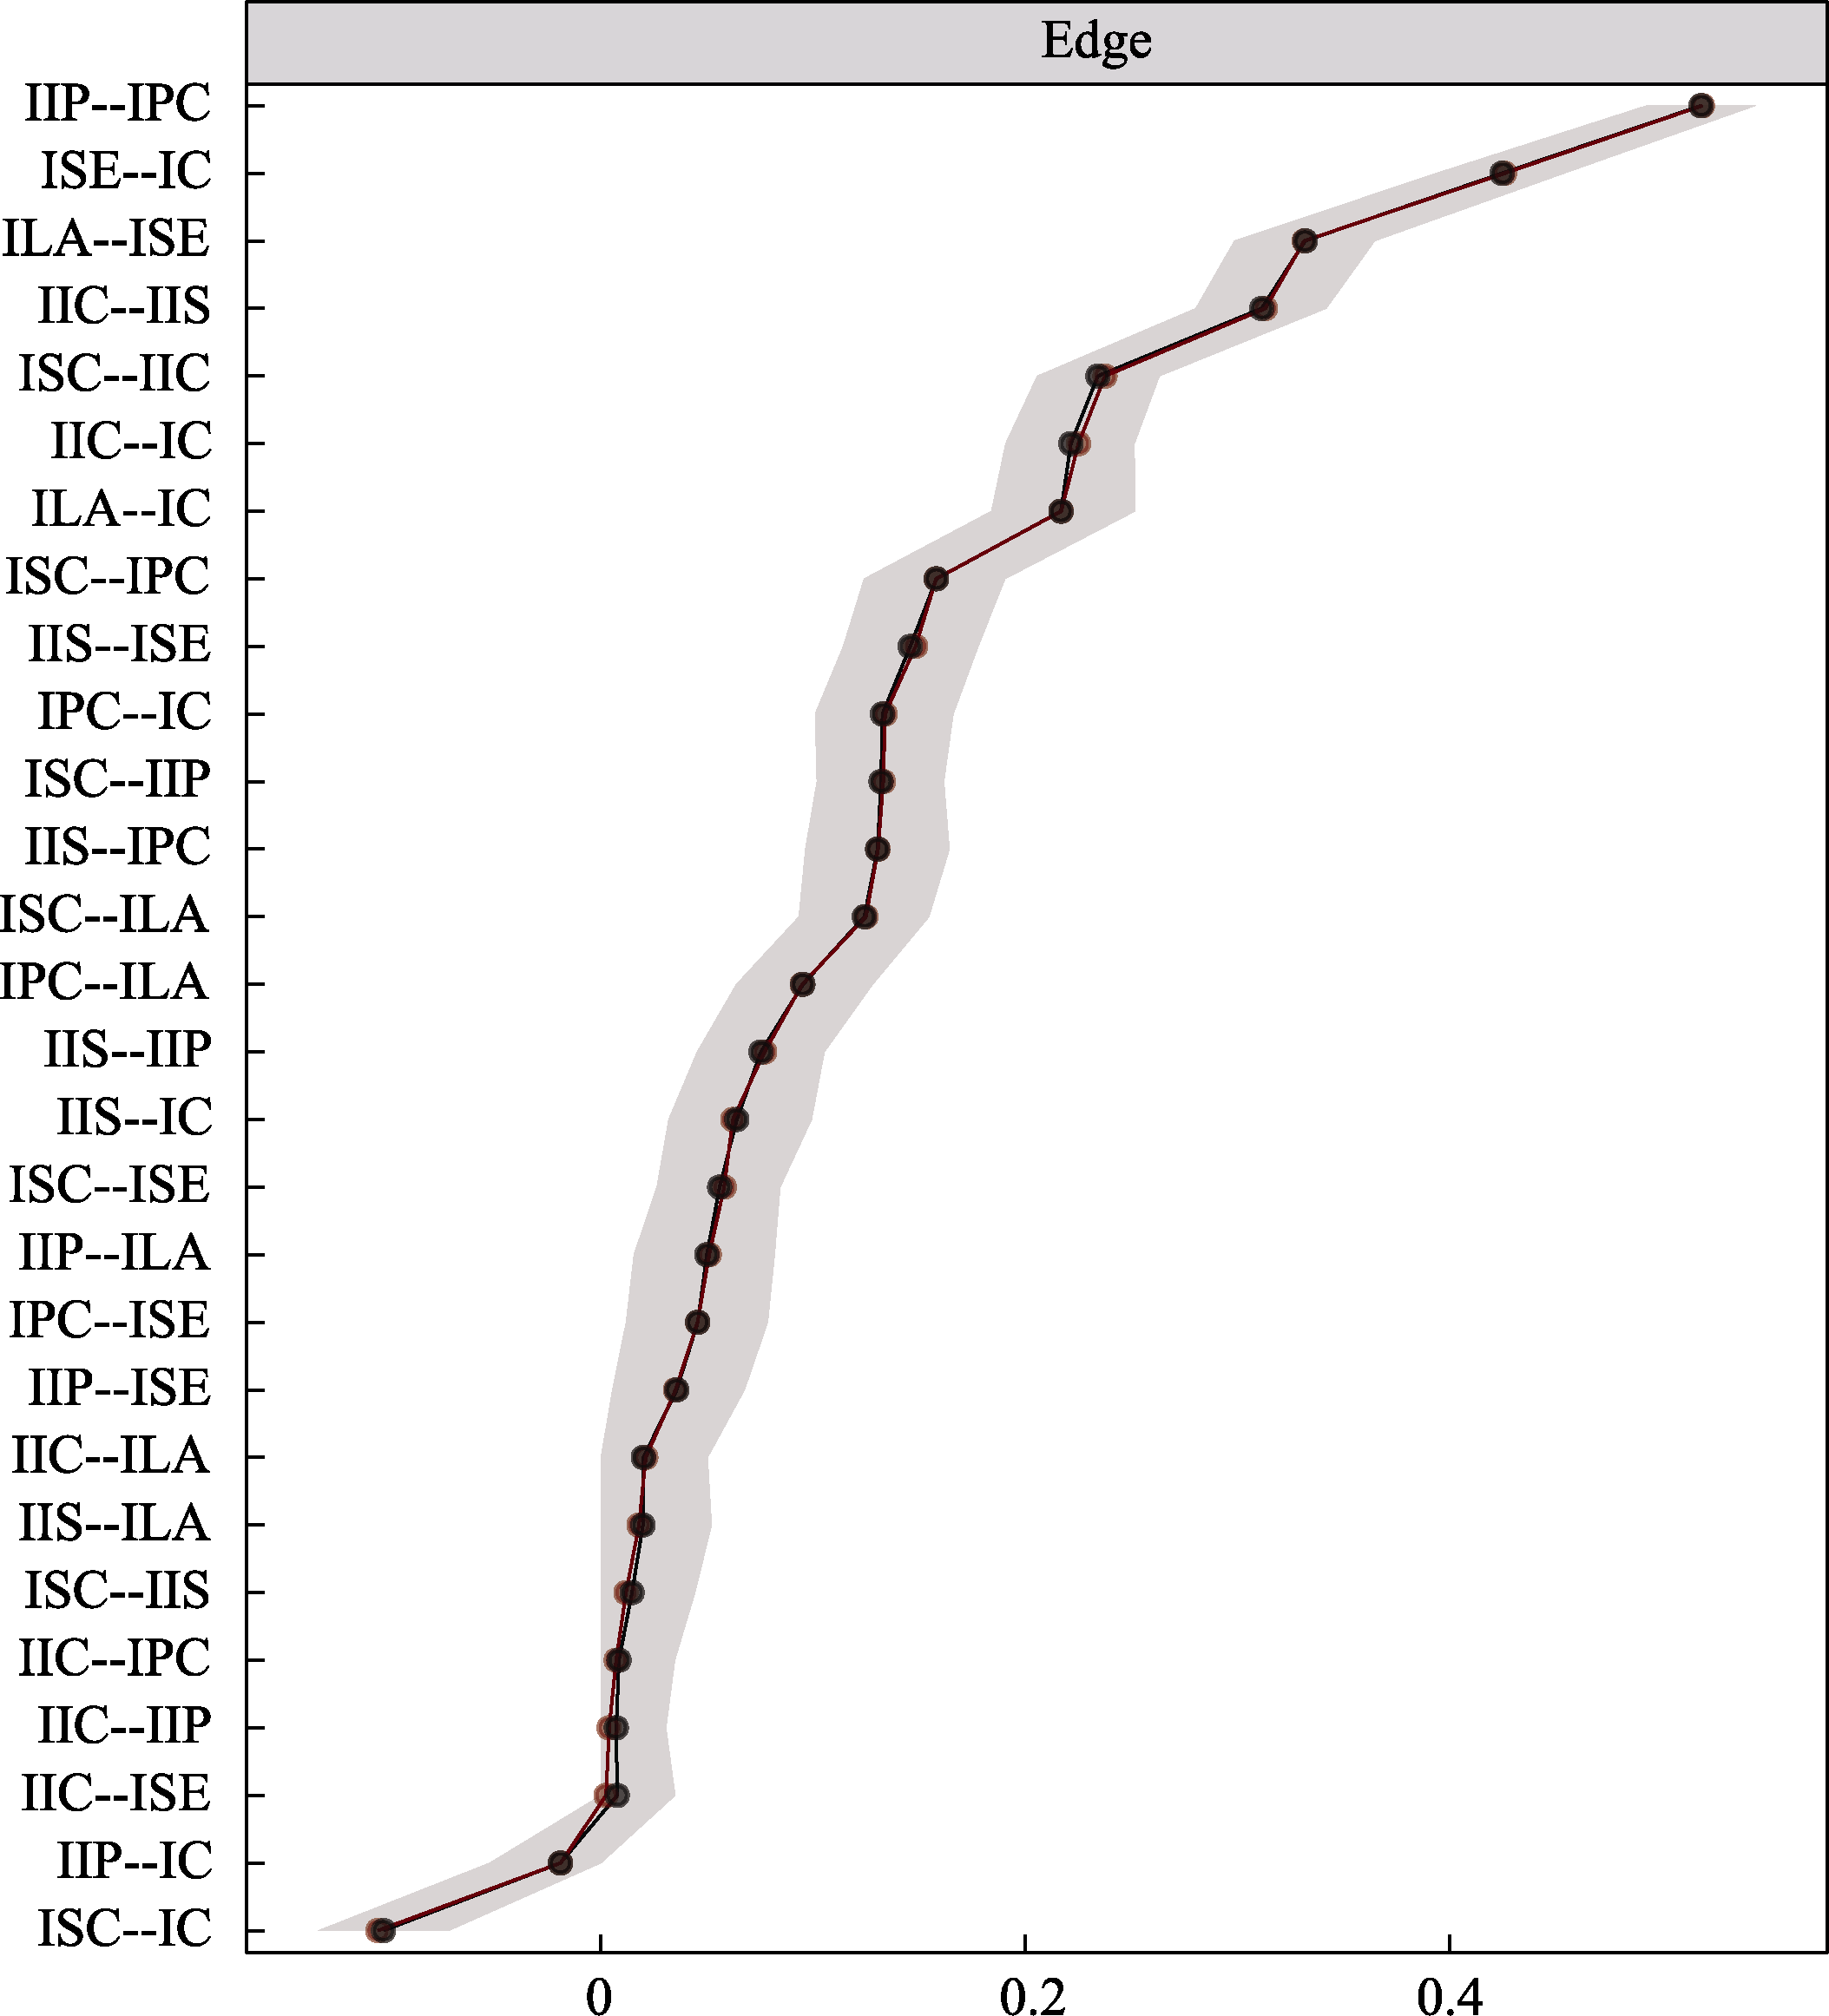
Figure S4. Nonparametric bootstrap method for testing network adaptation to edge differences in transect networks.
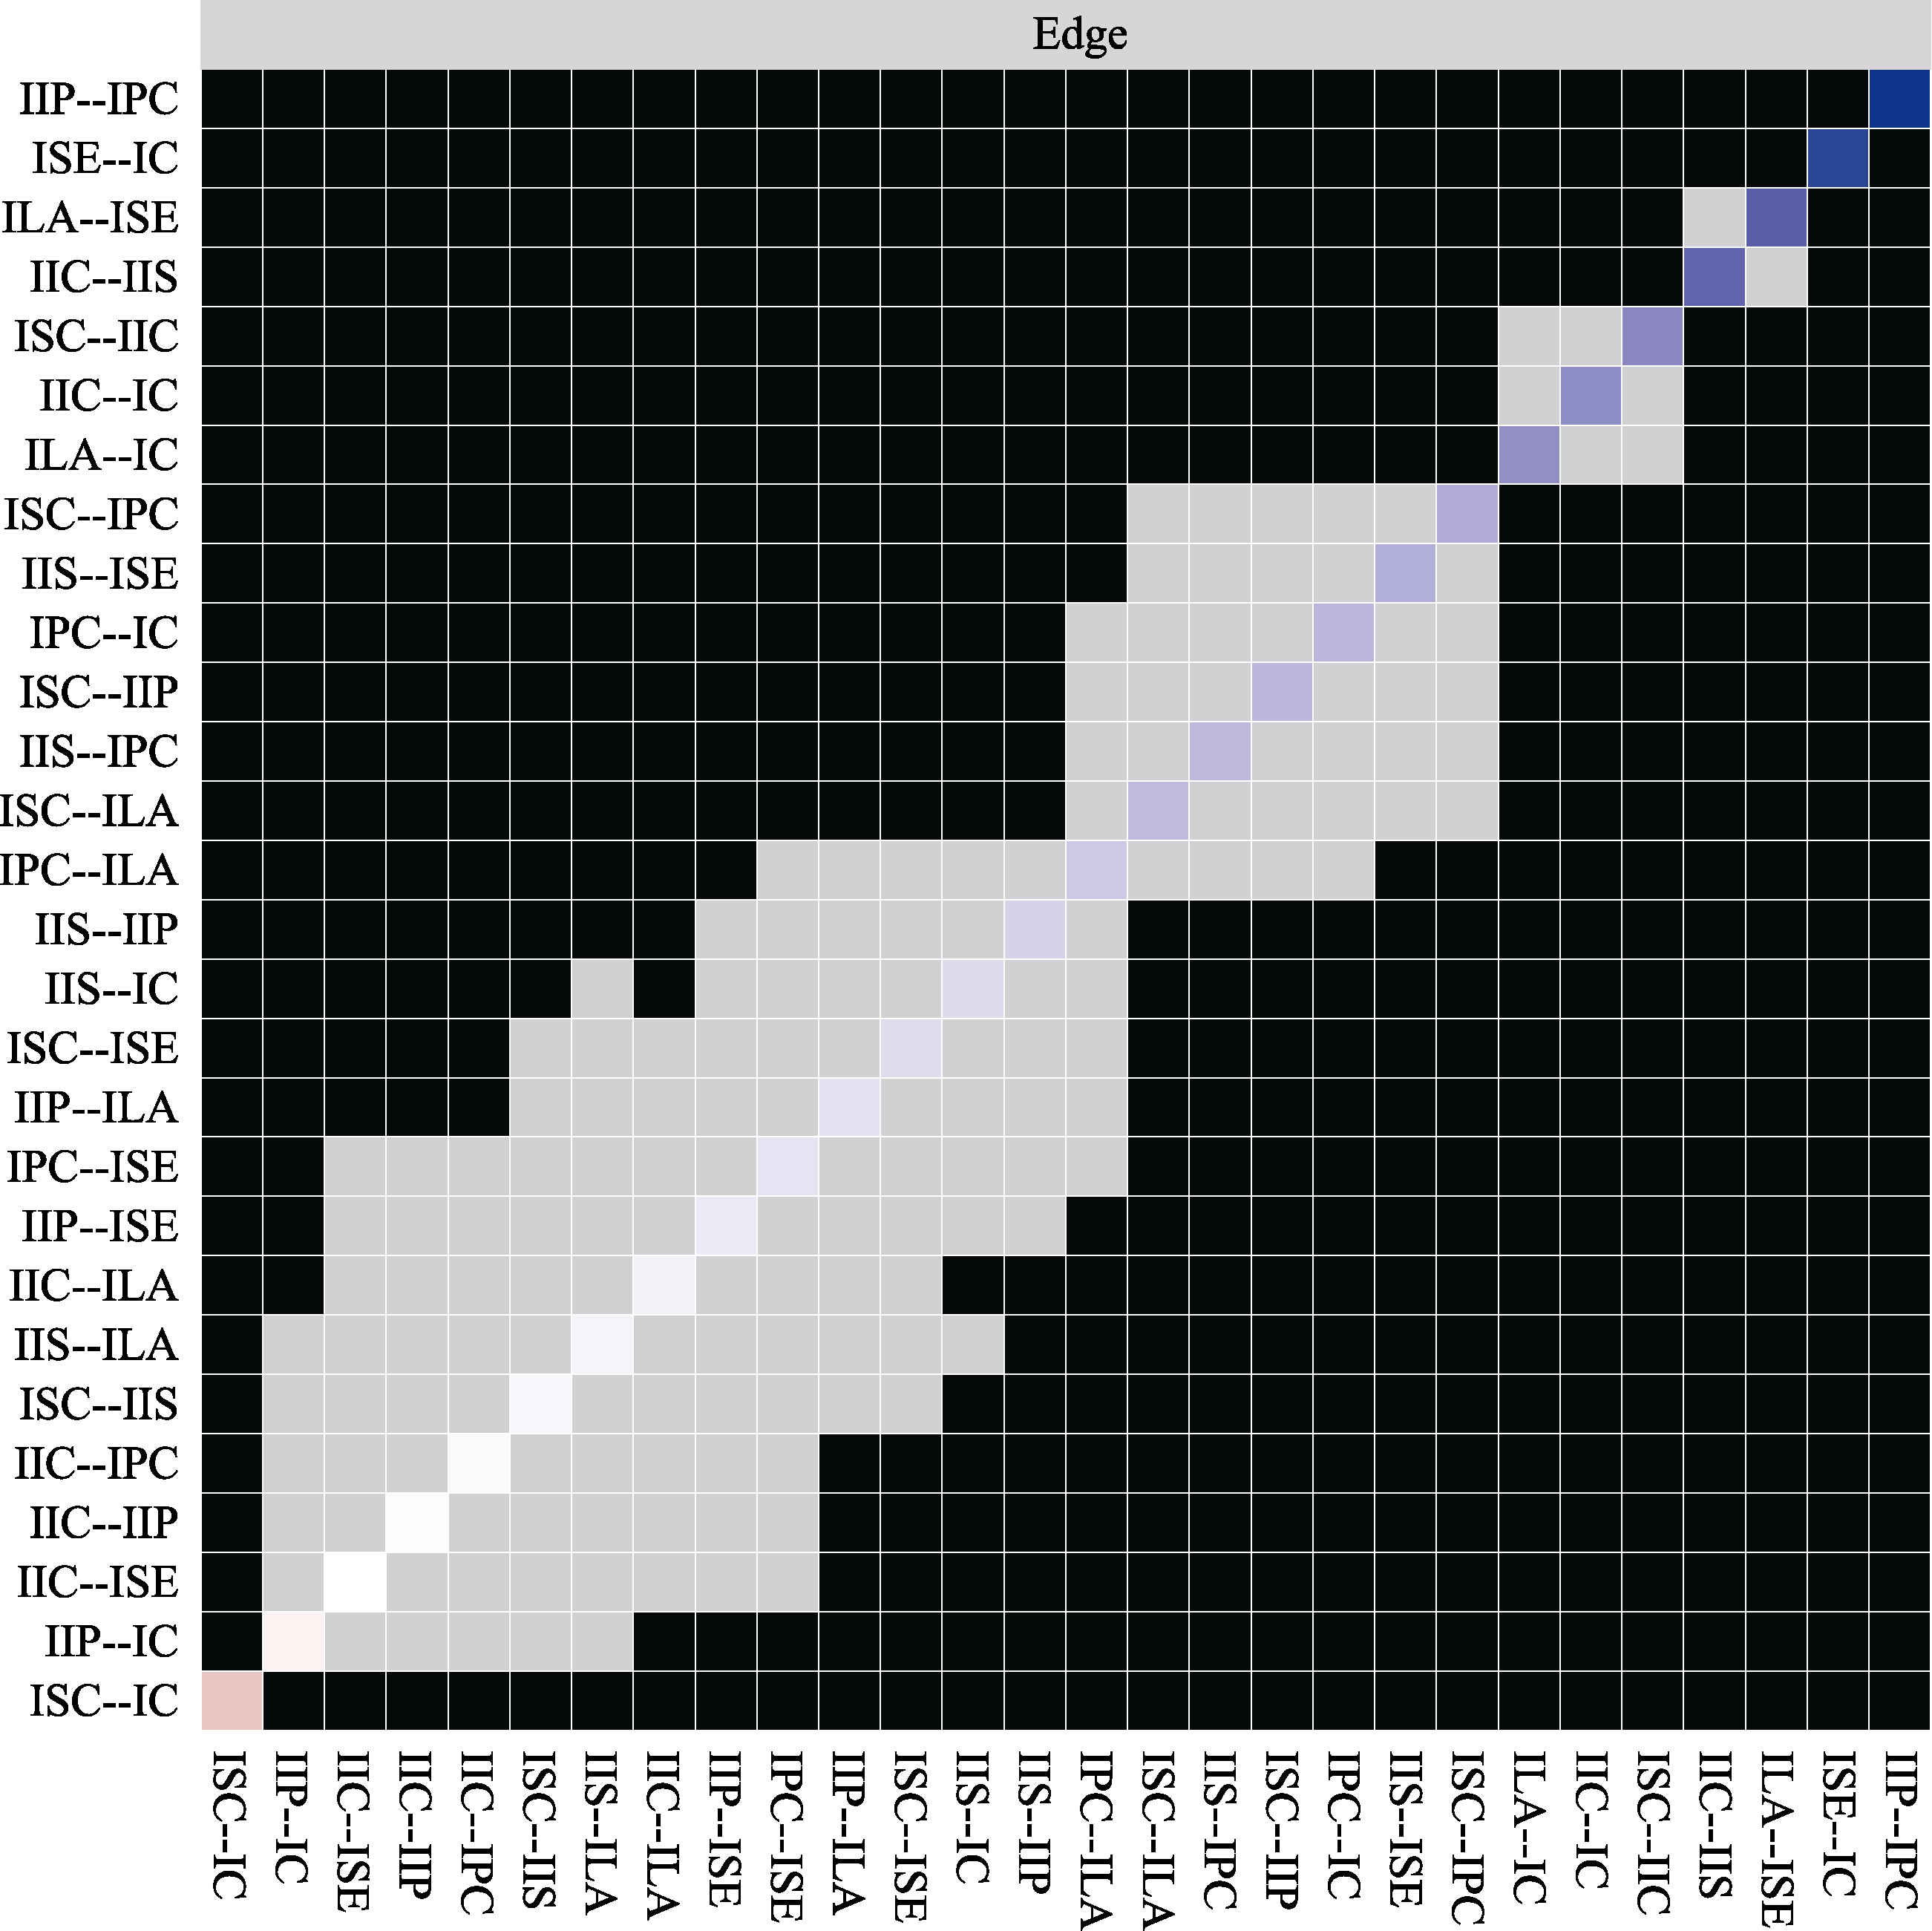
Figure S5. Nonparametric bootstrap method to test the accuracy of marginals estimation in network-adapted transect networks. Note. The red and black dots on each horizontal line indicate the sample values and the estimated bootstrap means of the marginals, respectively. The shaded portion of each horizontal line is the 95% confidence interval of the bootstrap estimate of the marginals, and the narrower gray shading means the higher accuracy of the marginals. (Same below)
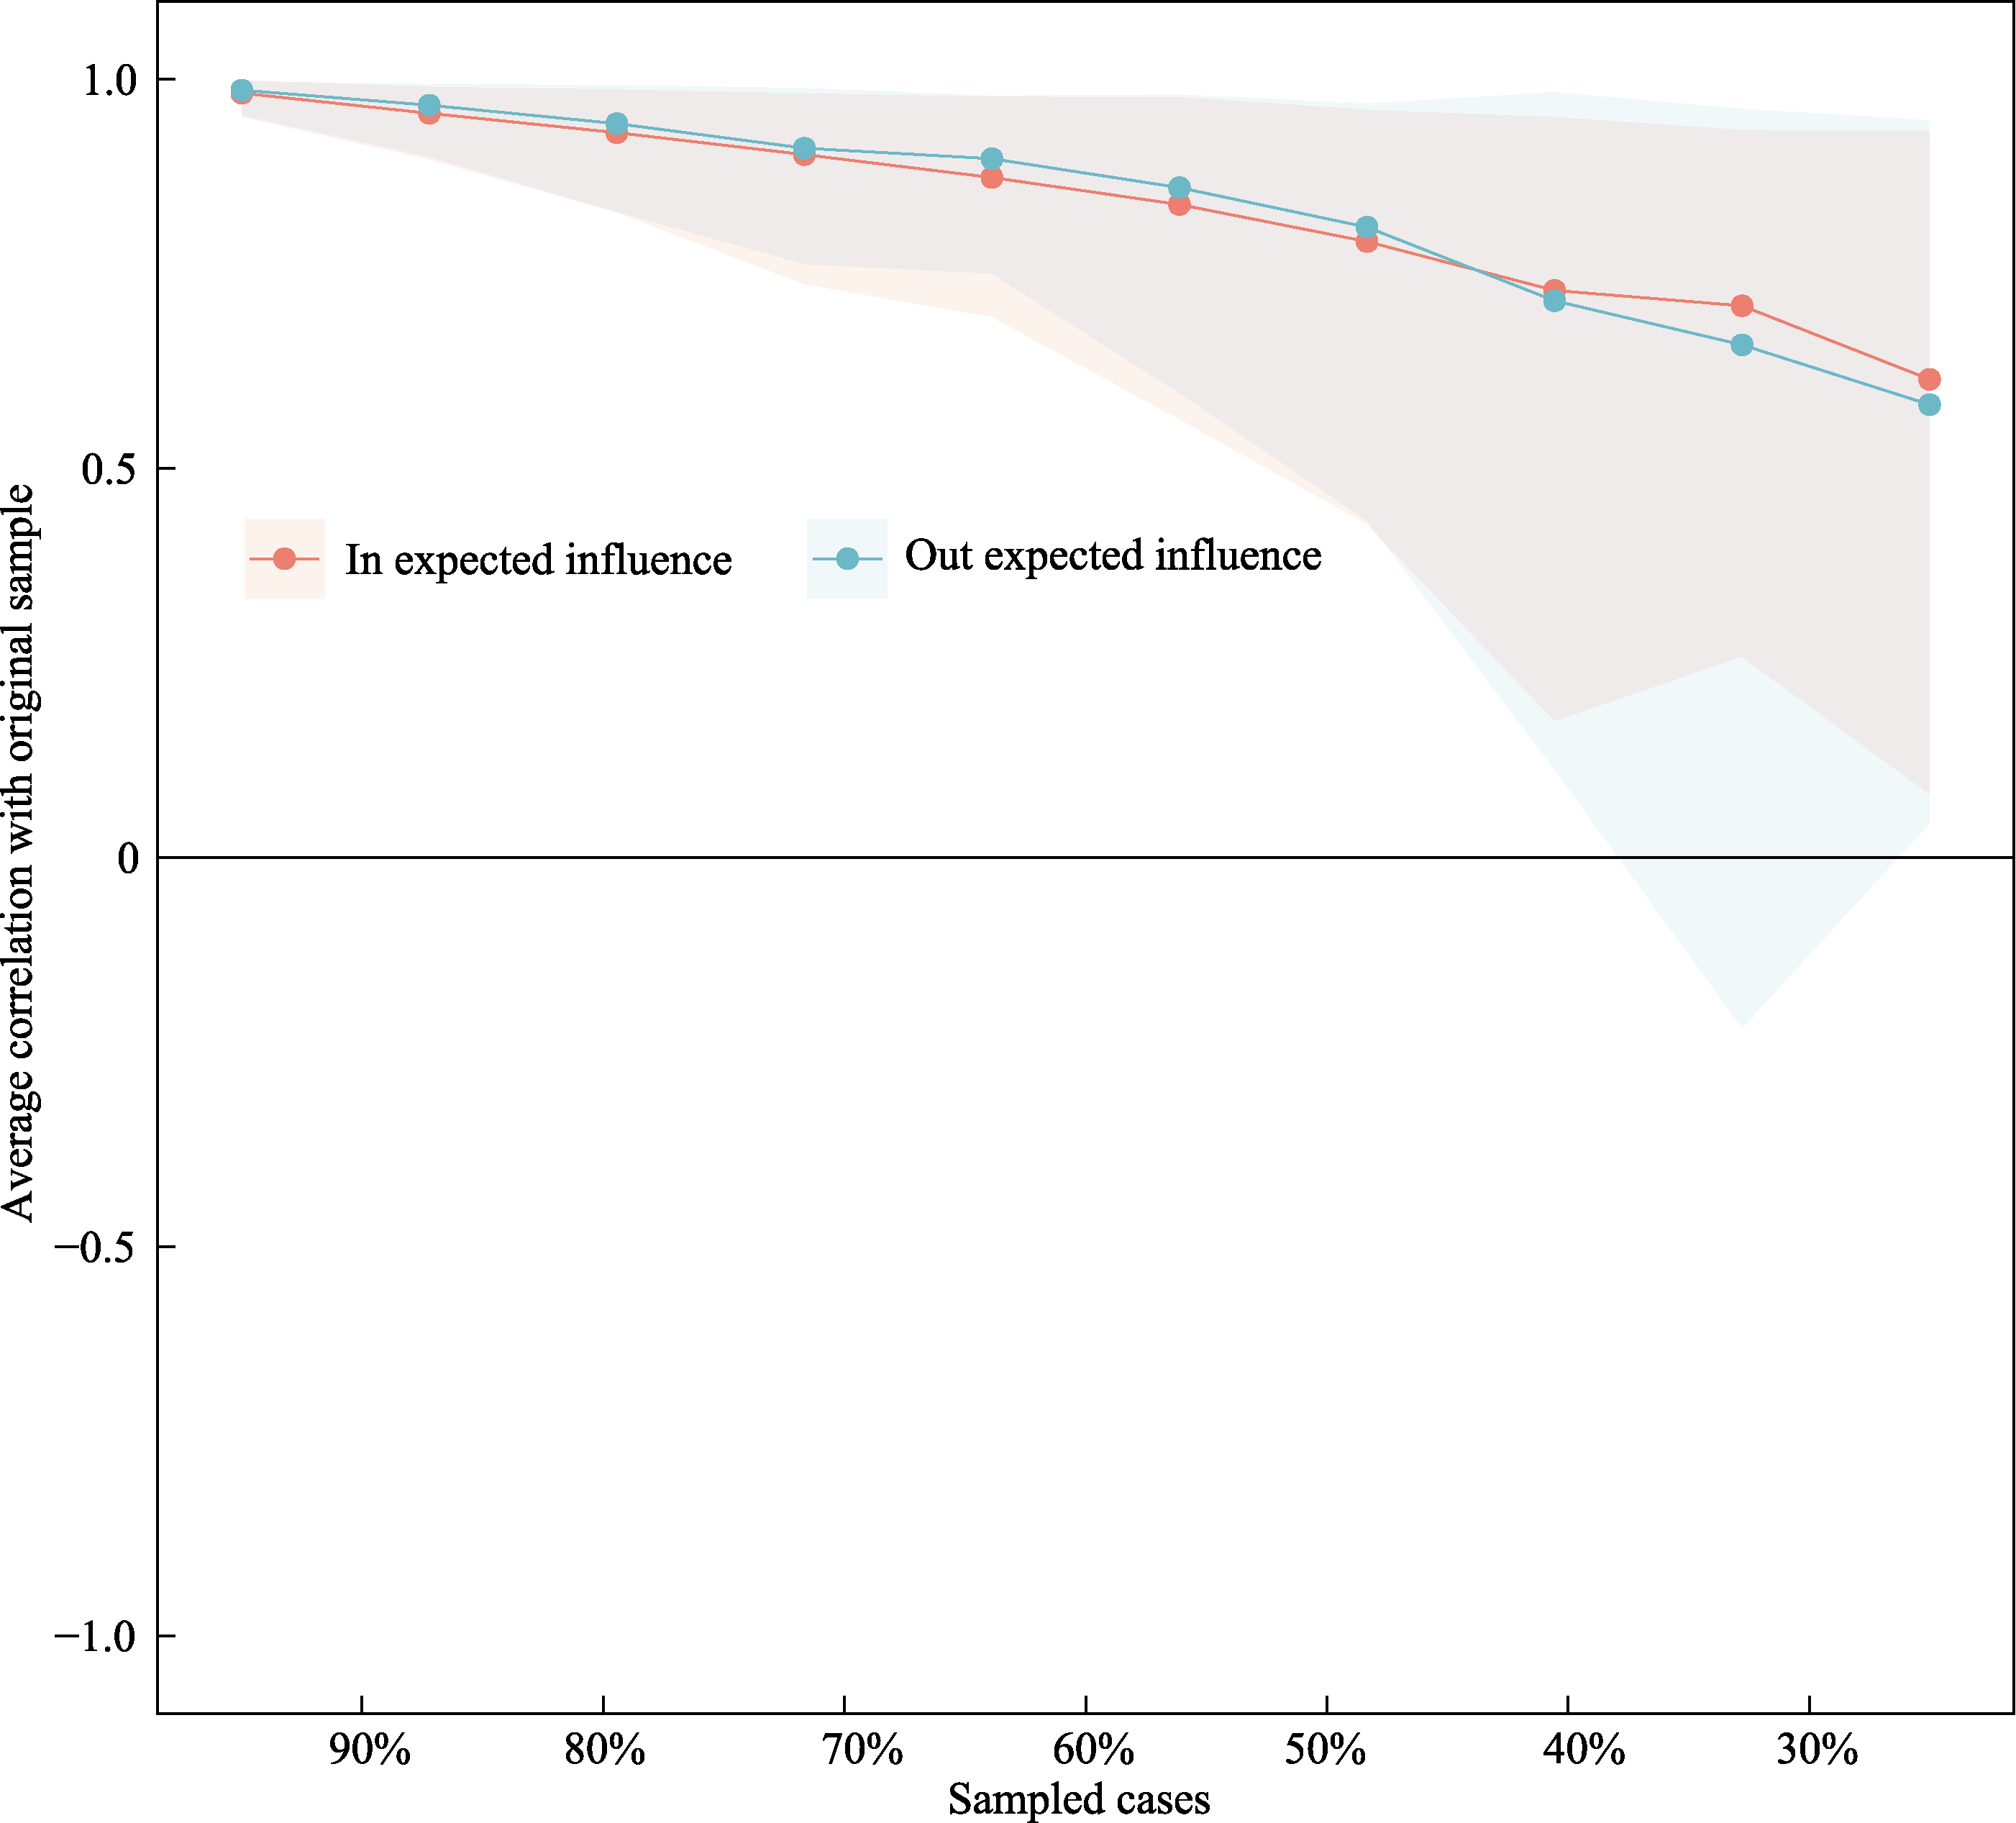
Figure S6. Case-droping method to test the stability of network adaptation to in-expected and out-expected impacts in cross-lagged networks.
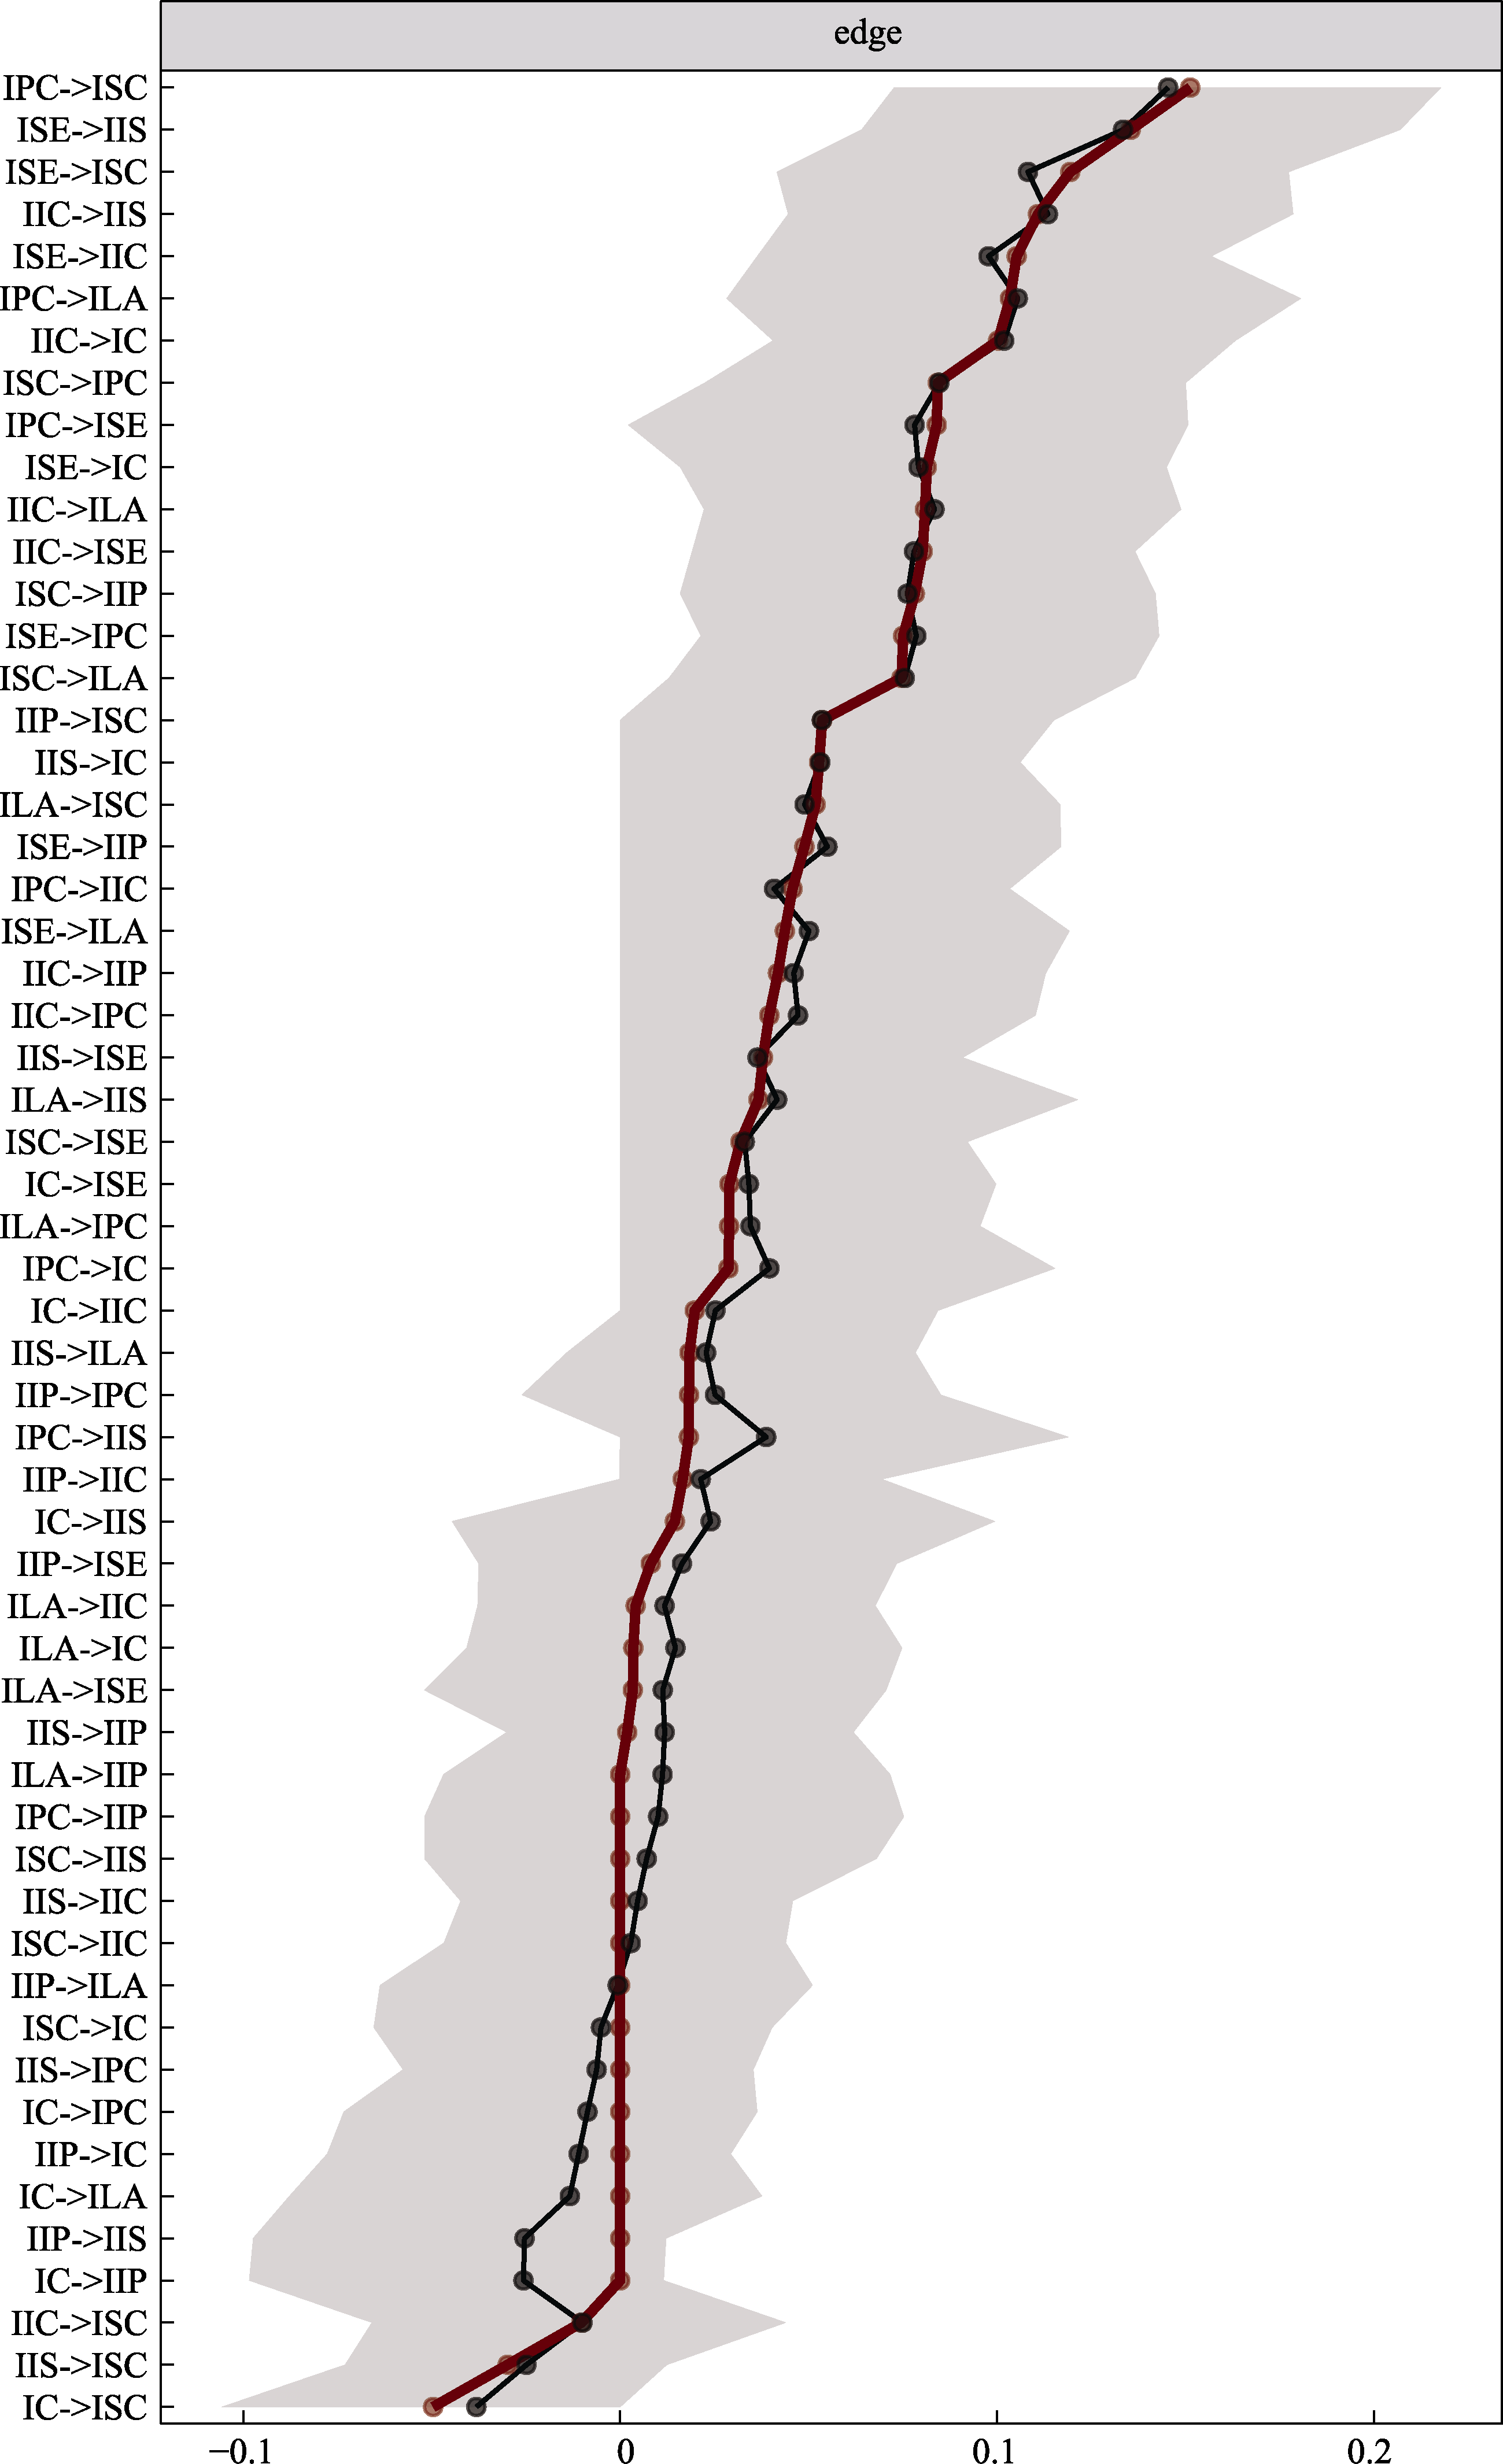
Figure S7. Nonparametric bootstrap method to test the accuracy of margin estimation in network-adapted cross-lag networks.
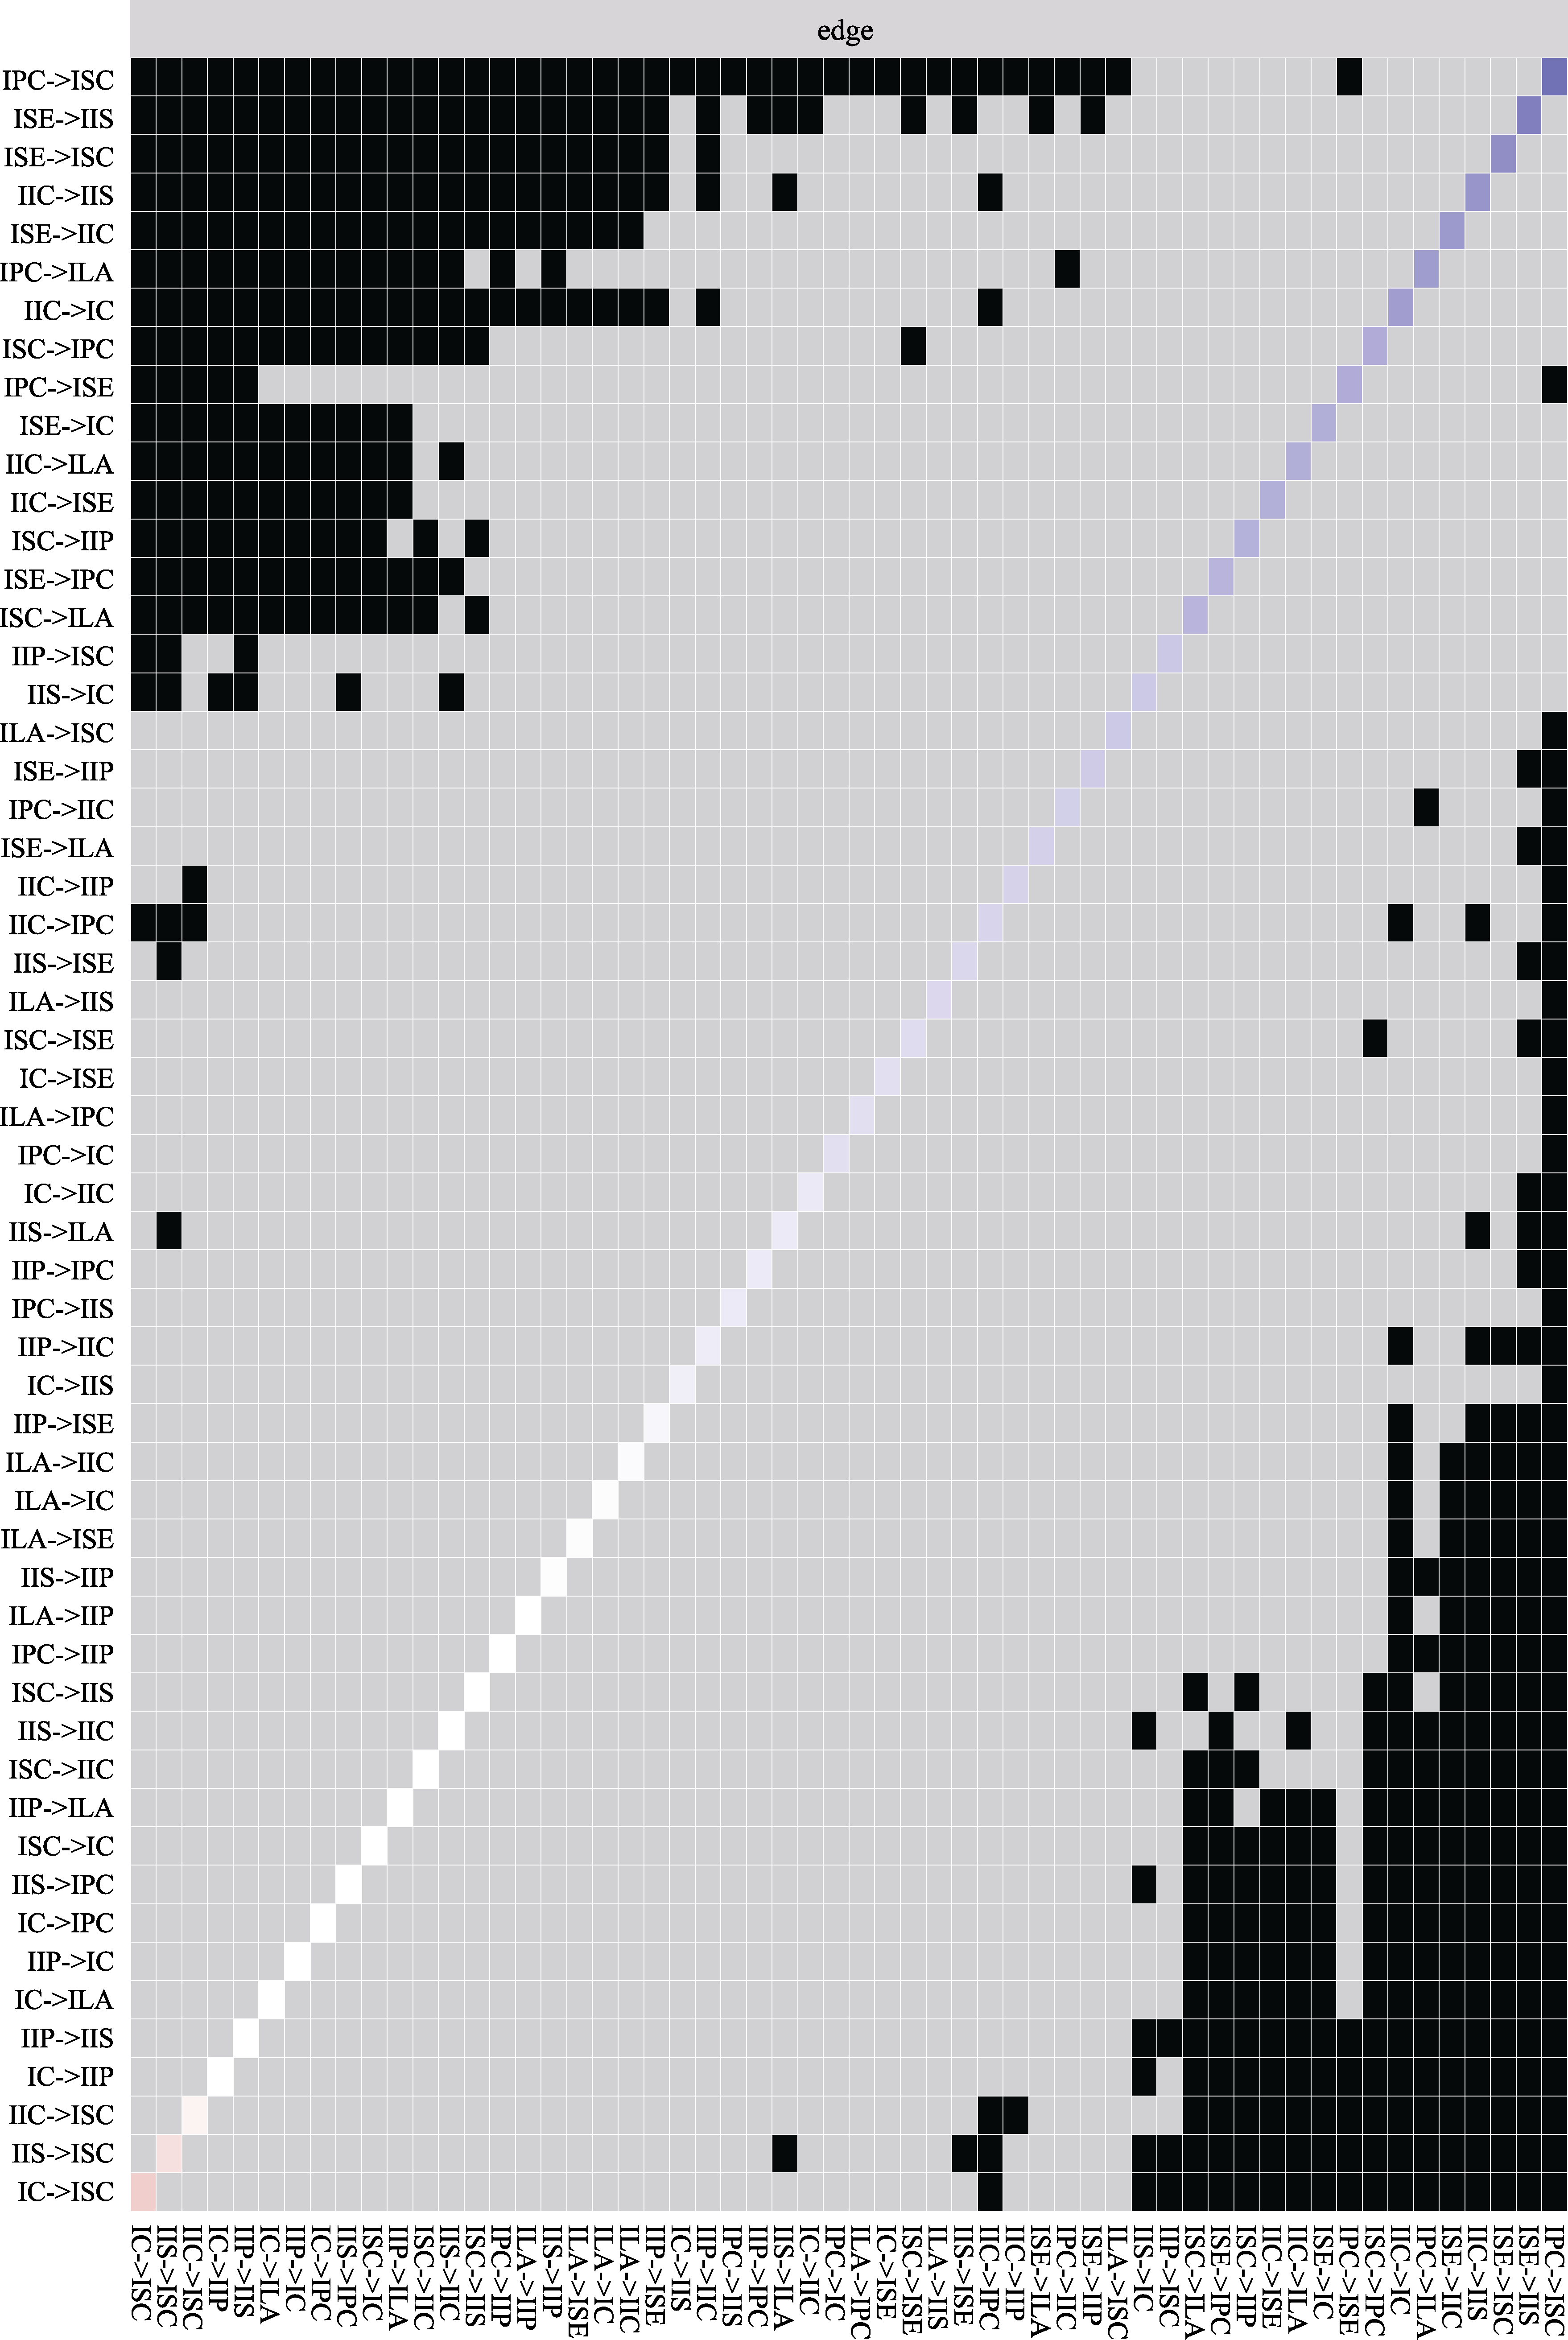
Figure S8. Nonparametric bootstrap method for testing network adaptation to borderline differences in cross-lagged networks.
| [1] | Al-Maskari, A., & |
