

ISSN 0439-755X
CN 11-1911/B
CN 11-1911/B
Acta Psychologica Sinica ›› 2026, Vol. 58 ›› Issue (9): 1720-1735.doi: 10.3724/SP.J.1041.2026.1720
• Column on the Stress, Resilience, and Health • Previous Articles Next Articles
GAO Qianqian1, CHEN Meijing1, SUN Jianing2, LI Yijia1, WANG Wei1, XIANG Shiyuan1, XIE Mingjun1( ), LIN Danhua1()
Published:2026-09-25
Online:2026-07-29
Contact:
Correspondence concerning this article should be addressed to Danhua Lin (E-mail: danhualin@bnu.edu.cn) and Mingjun Xie (E-mail: mxie@bnu.edu.cn)
Supported by:GAO Qianqian, CHEN Meijing, SUN Jianing, LI Yijia, WANG Wei, XIANG Shiyuan, XIE Mingjun, LIN Danhua. (2026). Family environmental unpredictability and adolescent physiological and psychological health: The buffering role of positive school climate. Acta Psychologica Sinica, 58(9), 1720-1735.
Add to citation manager EndNote|Ris|BibTeX
URL: https://journal.psych.ac.cn/acps/EN/10.3724/SP.J.1041.2026.1720
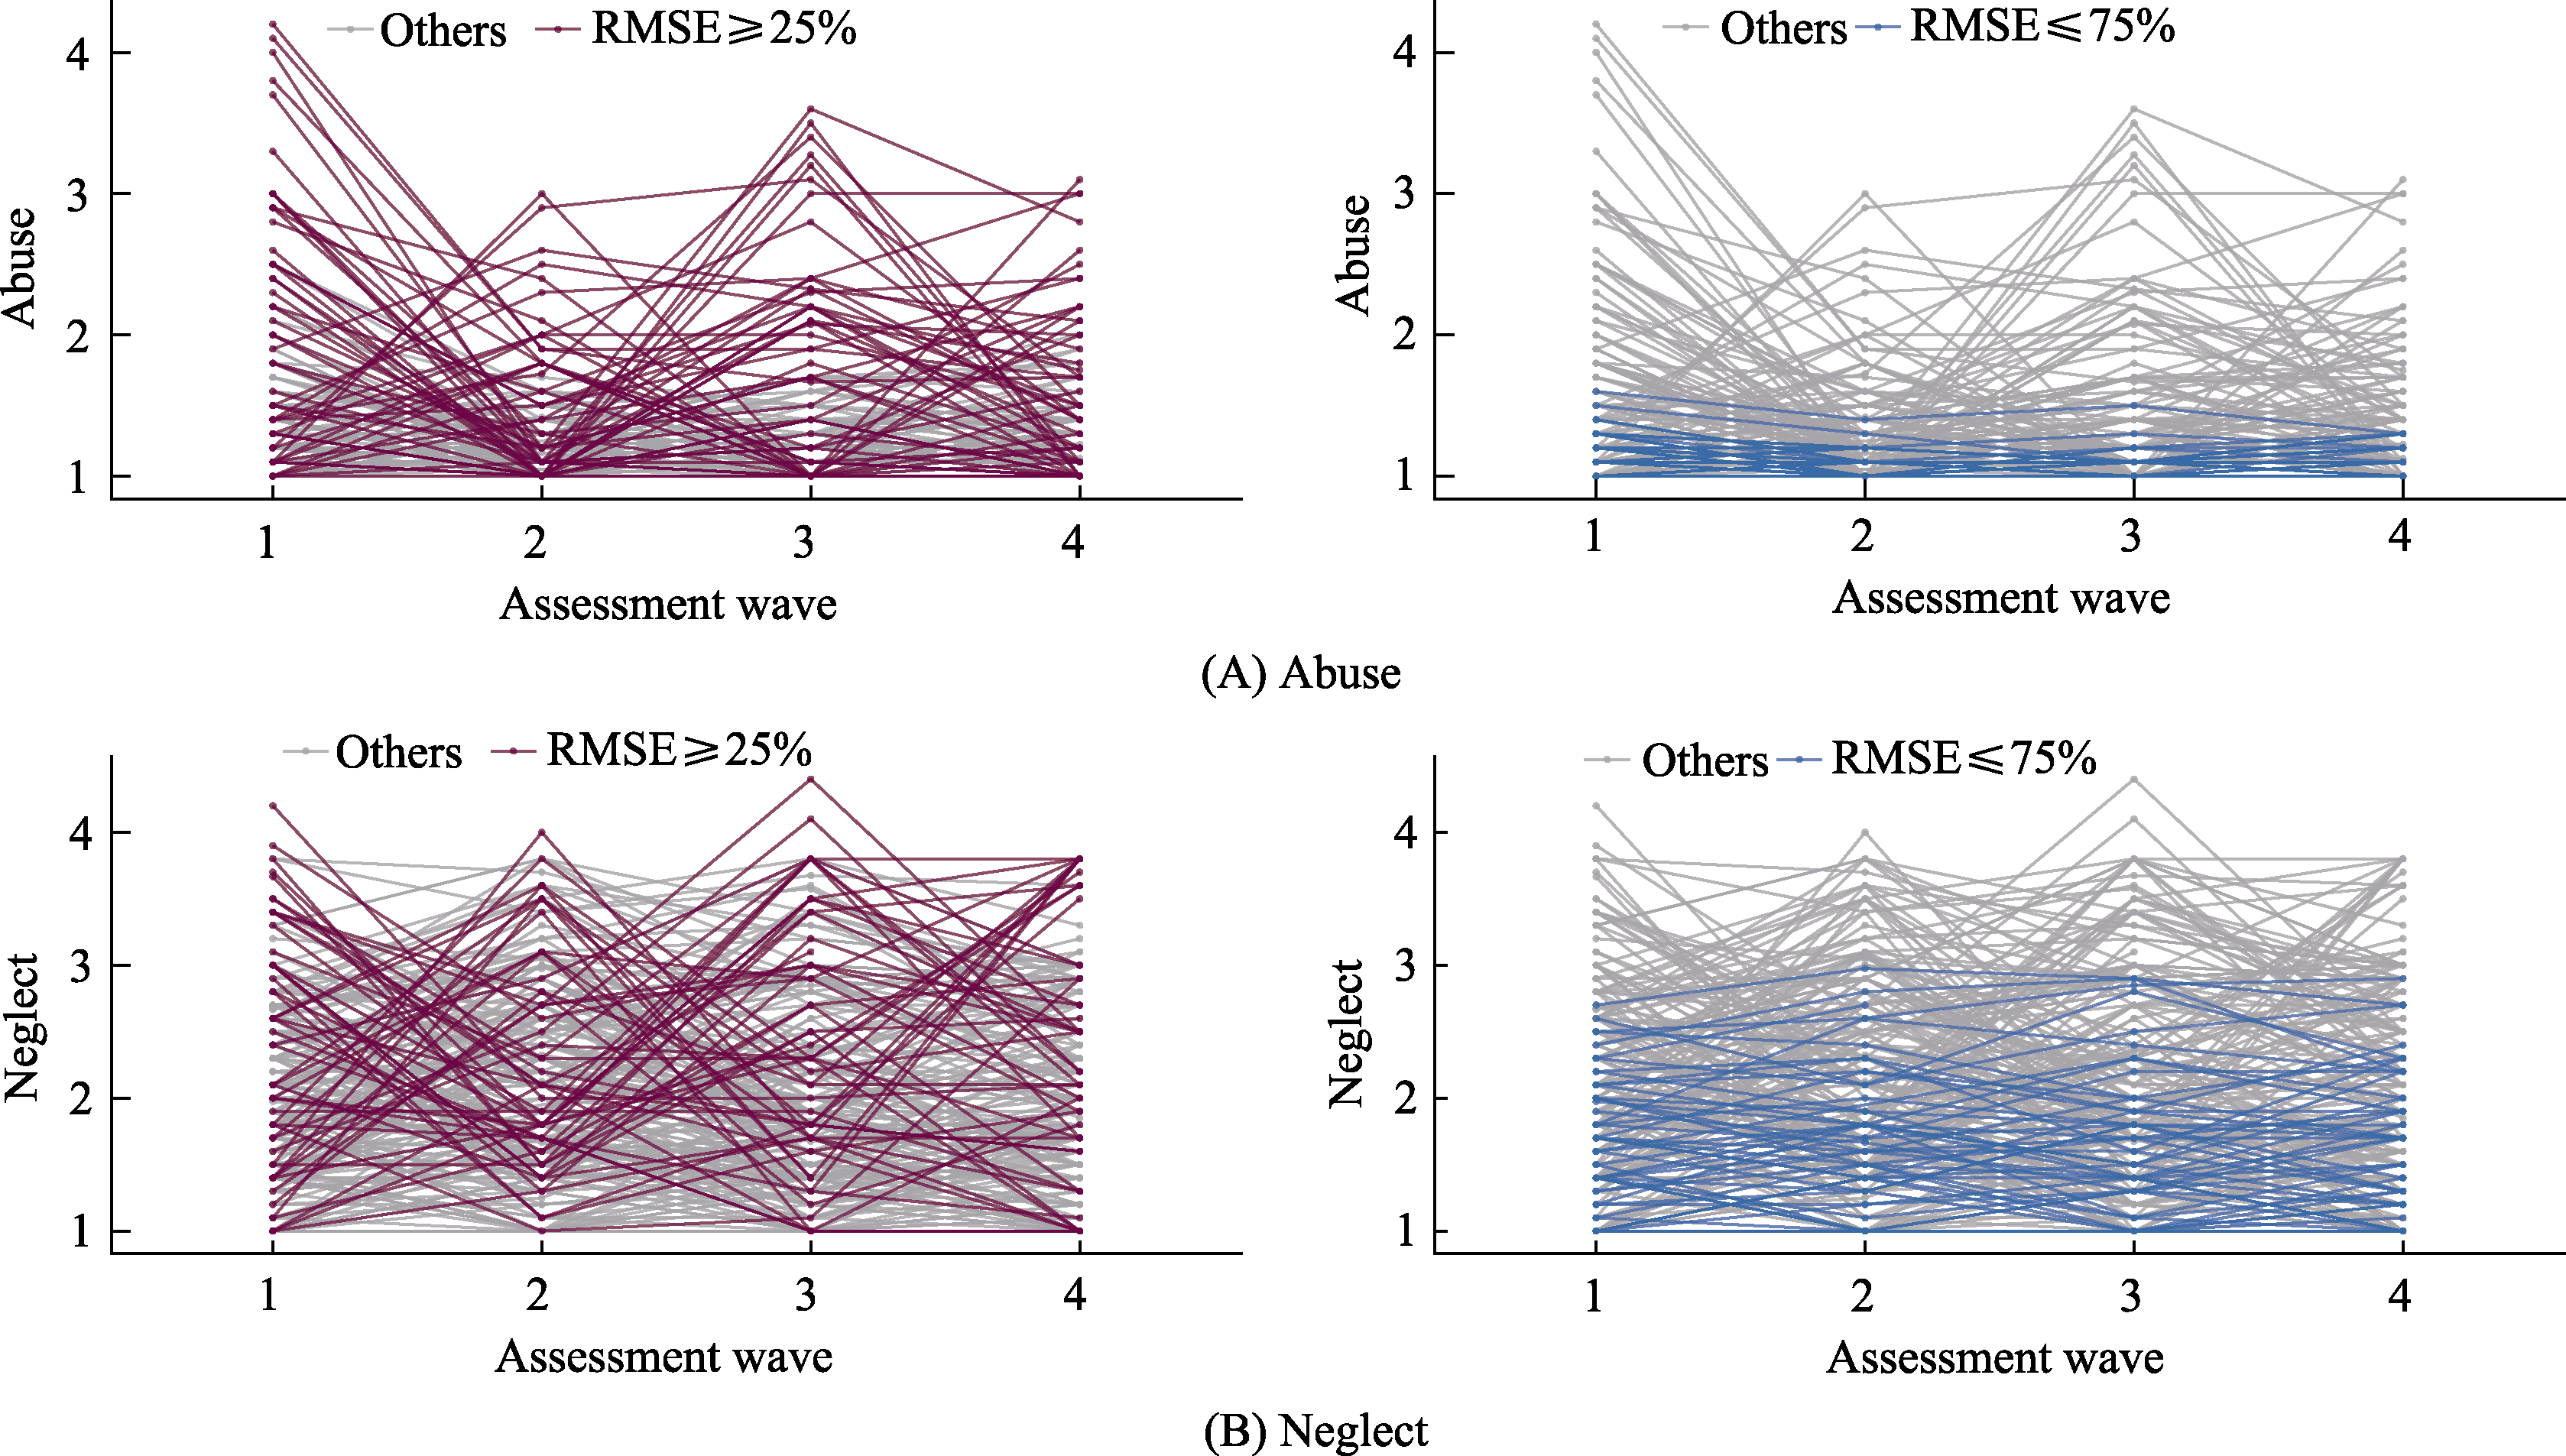
Figure 1. Observed trajectories of family abuse (A) and neglect (B) across the four assessment waves. Note. Red lines indicate participants with RMSE scores in the highest quartile (high unpredictability), and blue lines indicate participants with RMSE scores in the lowest quartile (low unpredictability).
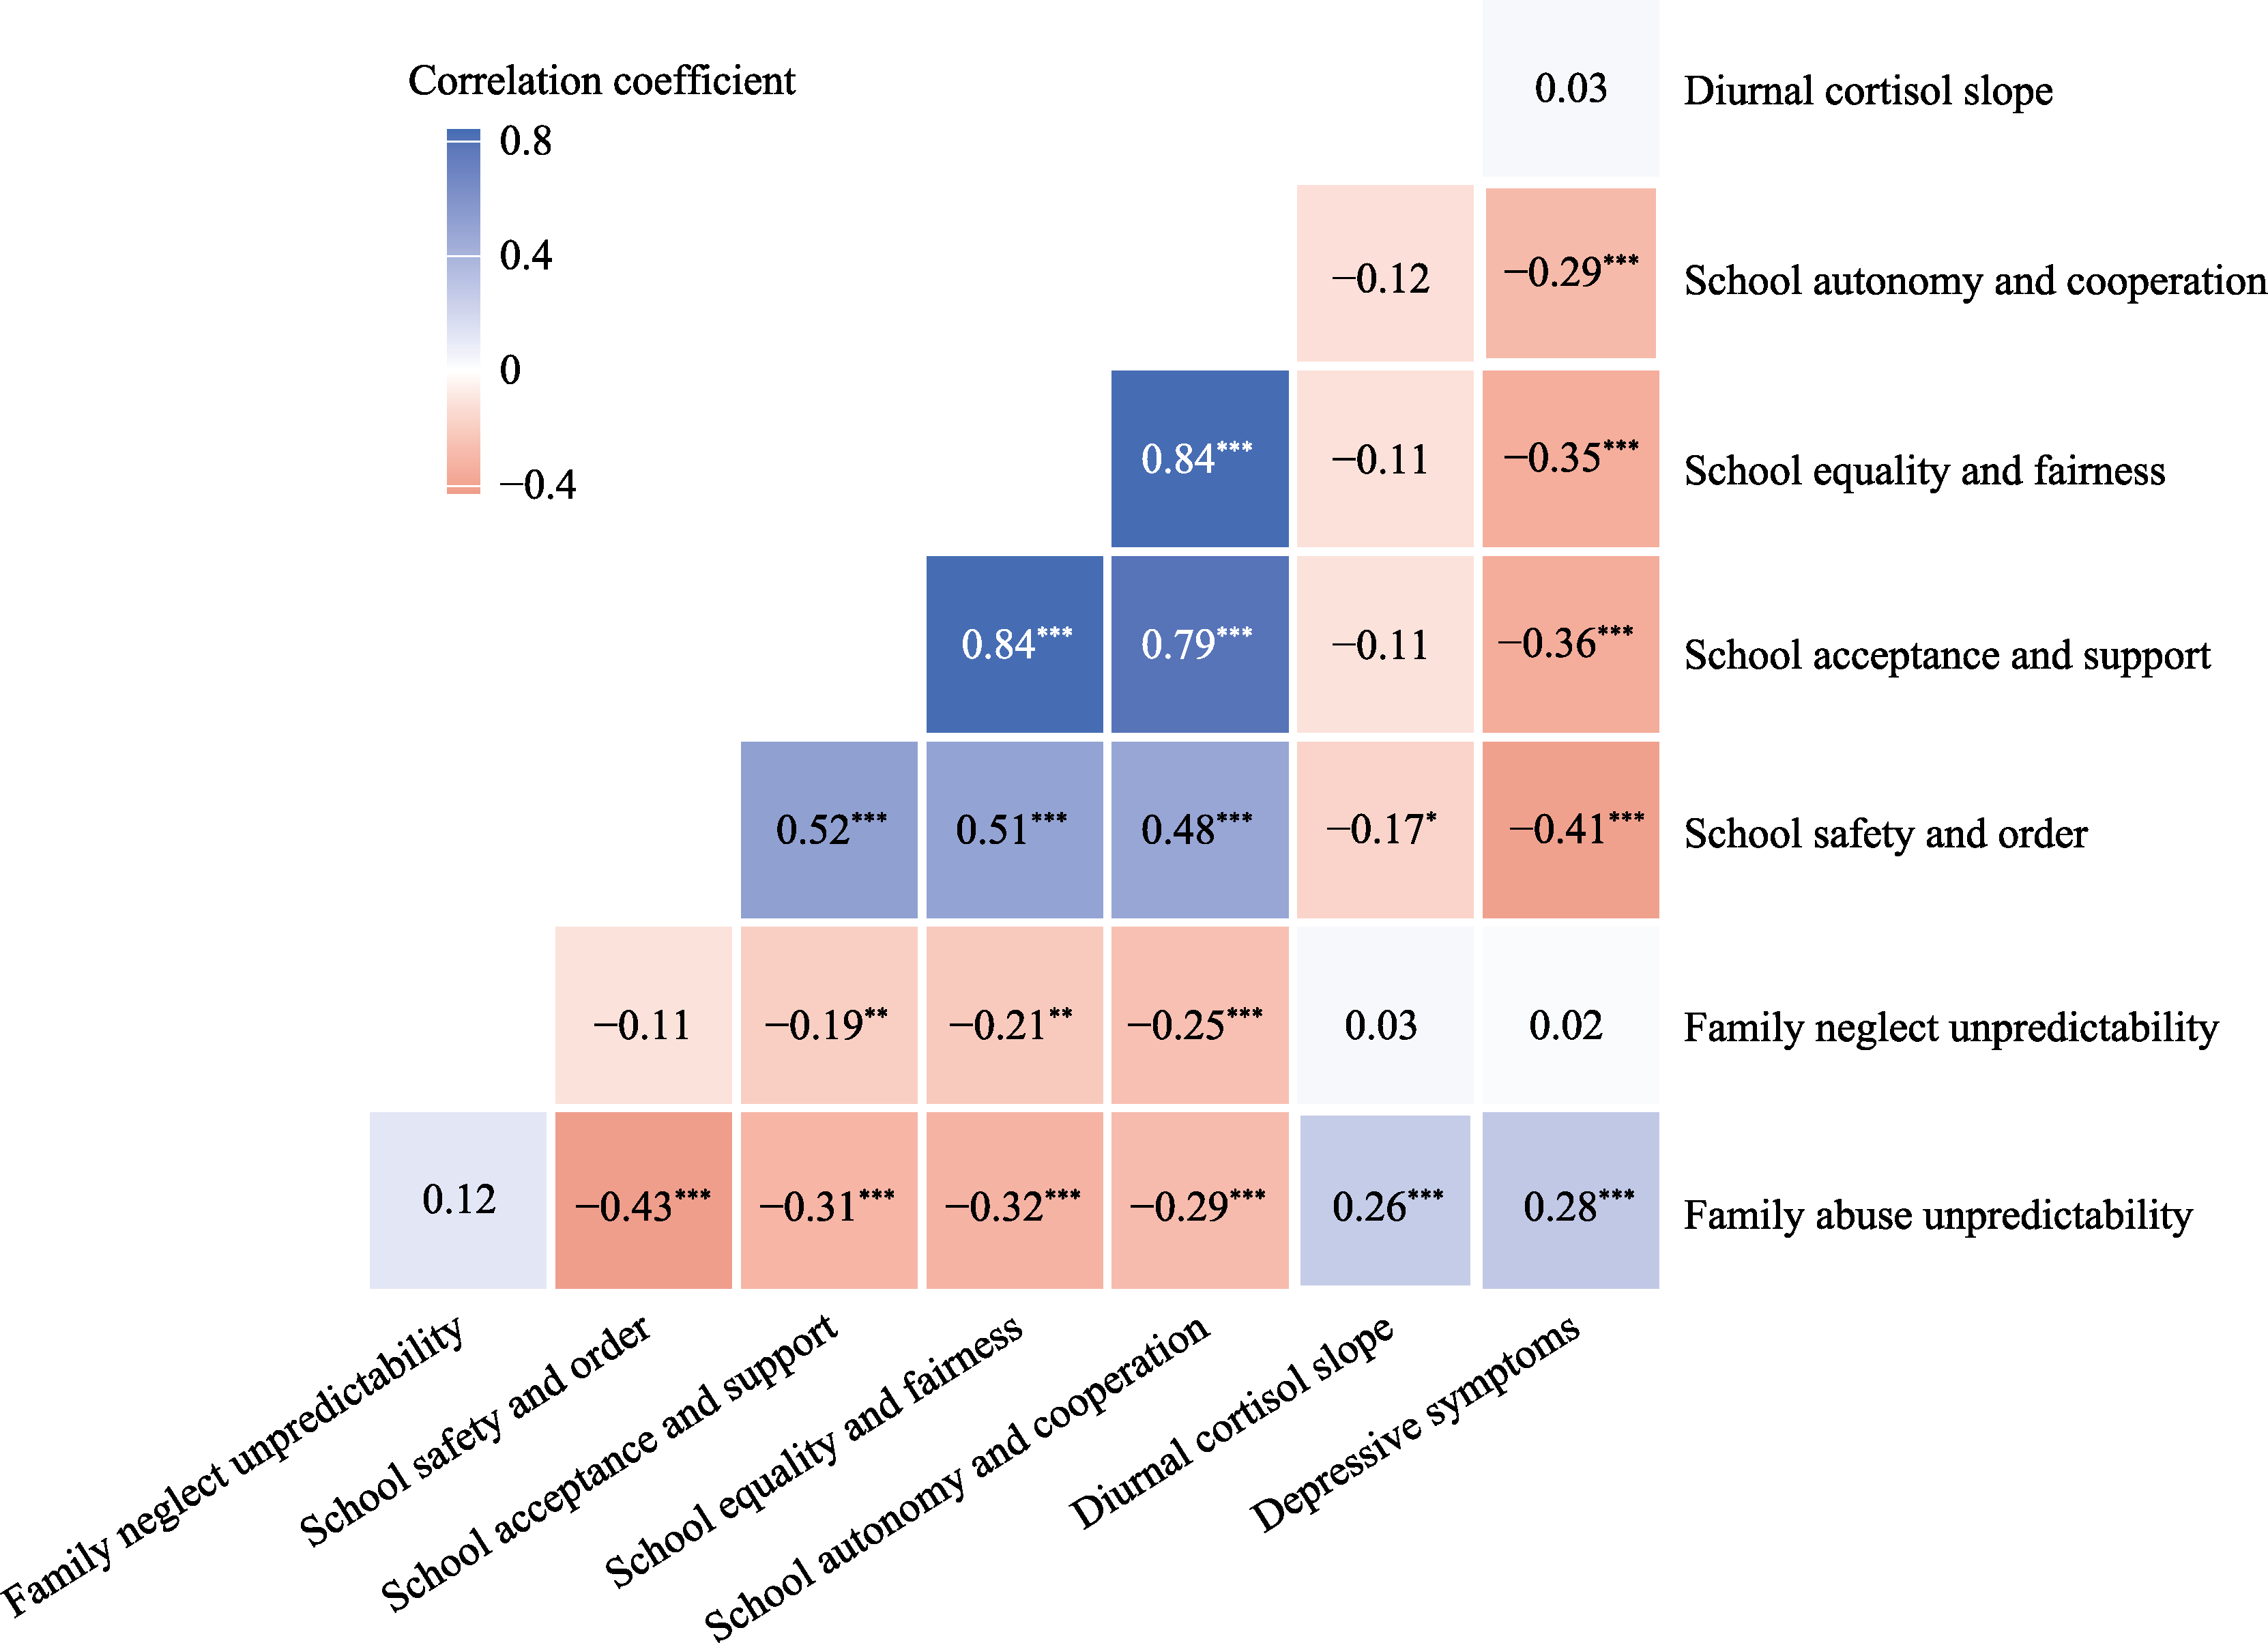
Figure 2. Correlation matrix of study variables. Note. * p < 0.05, **p < 0.01, *** p < 0.001.
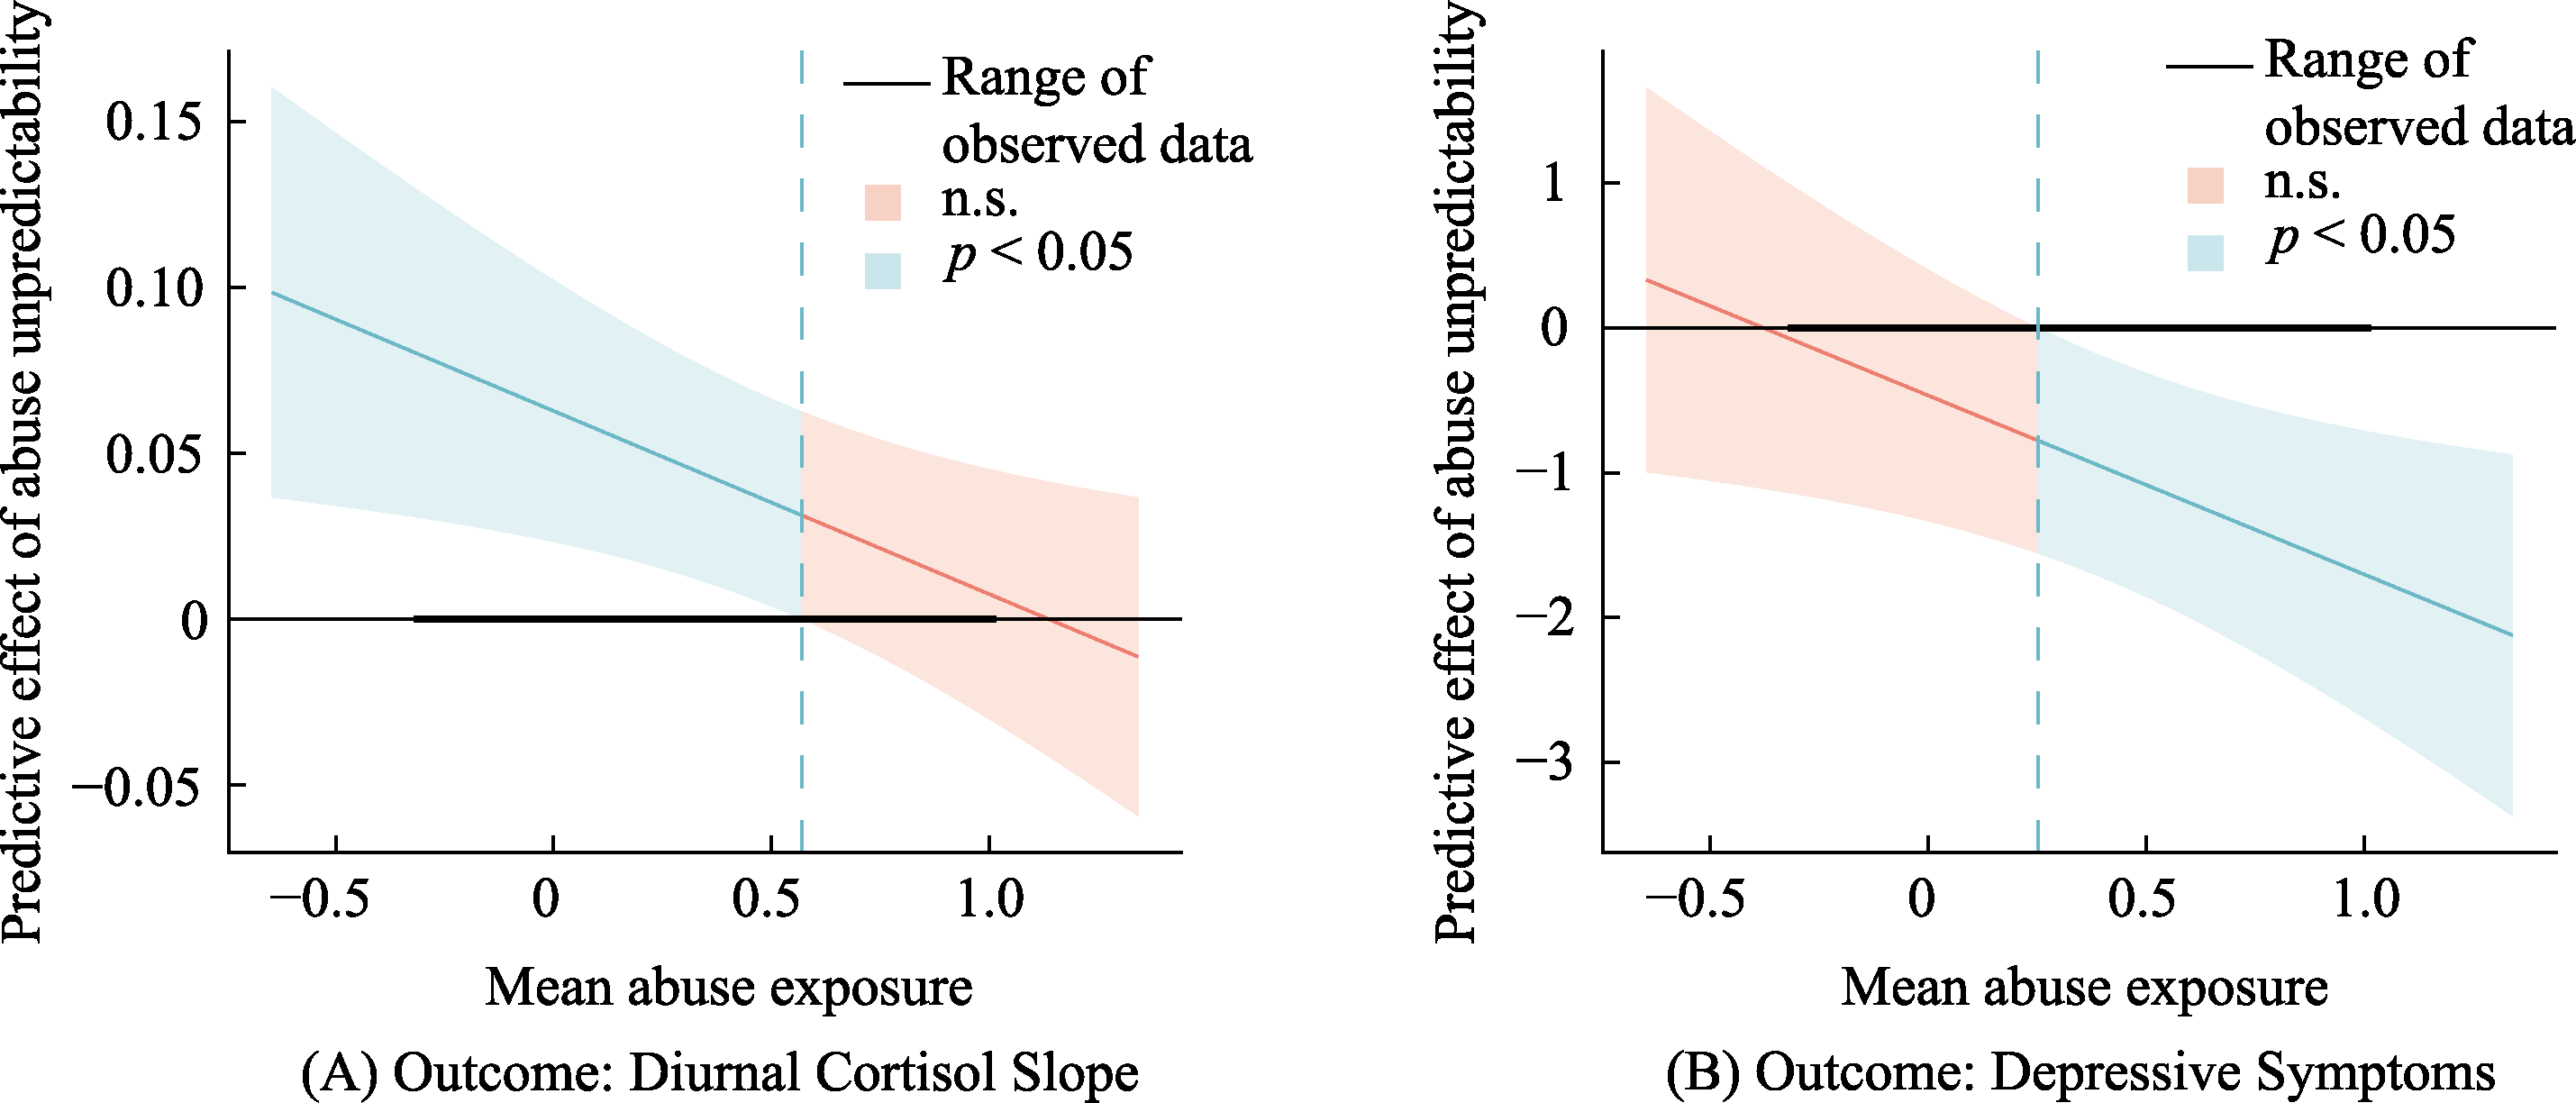
Figure 3. The moderating effect of mean abuse exposure on the associations between abuse unpredictability and outcome variables. Note. The J-N plots illustrate the moderating effect of mean abuse exposure on the associations between abuse unpredictability and diurnal cortisol slope (left panel) and depressive symptoms (right panel). Mean abuse exposure was mean-centered, with values ranging from ?0.31 to 1.01.
| Variable | Diurnal Cortisol Slope | Depressive Symptoms | ||||||||||||
|---|---|---|---|---|---|---|---|---|---|---|---|---|---|---|
| β | B | SE | 95% CI | t | ΔR | f | β | B | SE | 95% CI | t | ΔR | f | |
| Step1: Gender | ?0.16* | ?0.01 | 0.003 | [?0.152, ?0.001] | ?2.06 | 0.076 | 0.084 | 0.16* | 0.19 | 0.082 | [0.027, 0.351] | 2.31 | 0.173 | 0.208 |
| Age | ?0.18* | ?0.01 | 0.002 | [?0.009, ?0.001] | ?2.39 | 0.13 | 0.09 | 0.047 | [?0.005, 0.182] | 1.87 | ||||
| Waking time | ?0.11 | ?0.02 | 0.011 | [?0.038, 0.006] | ?1.36 | — | — | — | — | — | ||||
| Sampling location | ?0.11 | ?0.01 | 0.007 | [?0.023, 0.004] | ?1.41 | — | — | — | — | — | ||||
| T1 Depressive symptoms | — | — | — | — | — | 0.18** | 0.20 | 0.080 | [0.040, 0.358] | 2.48 | ||||
| Neglect unpredictability | ?0.04 | ?0.00 | 0.009 | [?0.021, 0.013] | ?0.50 | 0.03 | 0.07 | 0.188 | [?0.299, 0.445] | 0.39 | ||||
| Mean abuse exposure | 0.13 | 0.01 | 0.005 | [?0.001, 0.019] | 1.66 | 0.26*** | 0.66 | 0.181 | [0.299, 1.015] | 3.63 | ||||
| School safety and order | ||||||||||||||
| Step2: Abuse unpredictability | 0.43** | 0.05 | 0.018 | [0.017, 0.088] | 2.91 | 0.053* | 0.150 | ?0.18 | ?0.53 | 0.371 | [?1.262, 0.203] | ?1.43 | 0.078*** | 0.333 |
| Safety and order | ?0.15 | ?0.01 | 0.006 | [?0.020, 0.002] | ?1.68 | ?0.34*** | ?0.51 | 0.123 | [?0.749, ?0.265] | ?4.12 | ||||
| Step3: Abuse unpredictability × Safety and order | ?0.20* | ?0.05 | 0.025 | [?0.100, ?0.003] | ?2.14 | 0.028* | 0.187 | 0.00 | 0.01 | 0.526 | [?1.025, 1.050] | 0.02 | 0.000 | 0.334 |
| School acceptance and support | ||||||||||||||
| Step2: Abuse unpredictability | 0.42** | 0.05 | 0.018 | [0.016, 0.087] | 2.85 | 0.047* | 0.142 | ?0.17 | ?0.50 | 0.378 | [?1.241, 0.251] | ?1.31 | 0.052** | 0.289 |
| Acceptance and support | ?0.11 | ?0.00 | 0.004 | [?0.012, 0.002] | ?1.33 | ?0.24** | ?0.27 | 0.084 | [?0.439, ?0.104] | ?3.20 | ||||
| Step3: Abuse unpredictability × Acceptance and support | ?0.10 | ?0.03 | 0.019 | [?0.064, 0.012] | ?1.34 | 0.014 | 0.160 | ?0.07 | ?0.41 | 0.409 | [?1.217, 0.396] | ?1.00 | 0.004 | 0.296 |
| School equality and fairness | ||||||||||||||
| Step2: Abuse unpredictability | 0.42** | 0.05 | 0.018 | [0.016, 0.087] | 2.84 | 0.049* | 0.144 | ?0.17 | ?0.50 | 0.377 | [?1.239, 0.248] | ?1.31 | 0.057** | 0.297 |
| Equality and fairness | ?0.11 | ?0.00 | 0.003 | [?0.011, 0.002] | ?1.43 | ?0.25*** | ?0.25 | 0.072 | [?0.388, ?0.102] | ?3.38 | ||||
| Step3: Abuse unpredictability × Equality and fairness | ?0.00 | ?0.00 | 0.016 | [?0.033, 0.031] | ?0.07 | 0.003 | ?0.00 | ?0.02 | 0.349 | [?0.705, 0.674] | ?0.05 | 0.000 | 0.297 | |
| School autonomy and cooperation | ||||||||||||||
| Step2: Abuse unpredictability | 0.40** | 0.05 | 0.018 | [0.013, 0.085] | 2.72 | 0.042* | 0.135 | ?0.19 | ?0.54 | 0.383 | [?1.307, 0.212] | ?1.42 | 0.028* | 0.250 |
| Autonomy and cooperation | ?0.07 | ?0.00 | 0.004 | [?0.010, 0.004] | ?0.85 | ?0.15* | ?0.17 | 0.080 | [?0.323, ?0.007] | ?2.06 | ||||
| Step3: Abuse unpredictability × Autonomy and cooperation | ?0.03 | ?0.01 | 0.019 | [?0.045, 0.031] | ?0.37 | 0.005 | 0.141 | 0.02 | 0.14 | 0.413 | [?0.674, 0.957] | 0.34 | 0.000 | 0.251 |
Table 1 Moderating effects of positive school climate on the associations between abuse unpredictability and outcomes
| Variable | Diurnal Cortisol Slope | Depressive Symptoms | ||||||||||||
|---|---|---|---|---|---|---|---|---|---|---|---|---|---|---|
| β | B | SE | 95% CI | t | ΔR | f | β | B | SE | 95% CI | t | ΔR | f | |
| Step1: Gender | ?0.16* | ?0.01 | 0.003 | [?0.152, ?0.001] | ?2.06 | 0.076 | 0.084 | 0.16* | 0.19 | 0.082 | [0.027, 0.351] | 2.31 | 0.173 | 0.208 |
| Age | ?0.18* | ?0.01 | 0.002 | [?0.009, ?0.001] | ?2.39 | 0.13 | 0.09 | 0.047 | [?0.005, 0.182] | 1.87 | ||||
| Waking time | ?0.11 | ?0.02 | 0.011 | [?0.038, 0.006] | ?1.36 | — | — | — | — | — | ||||
| Sampling location | ?0.11 | ?0.01 | 0.007 | [?0.023, 0.004] | ?1.41 | — | — | — | — | — | ||||
| T1 Depressive symptoms | — | — | — | — | — | 0.18** | 0.20 | 0.080 | [0.040, 0.358] | 2.48 | ||||
| Neglect unpredictability | ?0.04 | ?0.00 | 0.009 | [?0.021, 0.013] | ?0.50 | 0.03 | 0.07 | 0.188 | [?0.299, 0.445] | 0.39 | ||||
| Mean abuse exposure | 0.13 | 0.01 | 0.005 | [?0.001, 0.019] | 1.66 | 0.26*** | 0.66 | 0.181 | [0.299, 1.015] | 3.63 | ||||
| School safety and order | ||||||||||||||
| Step2: Abuse unpredictability | 0.43** | 0.05 | 0.018 | [0.017, 0.088] | 2.91 | 0.053* | 0.150 | ?0.18 | ?0.53 | 0.371 | [?1.262, 0.203] | ?1.43 | 0.078*** | 0.333 |
| Safety and order | ?0.15 | ?0.01 | 0.006 | [?0.020, 0.002] | ?1.68 | ?0.34*** | ?0.51 | 0.123 | [?0.749, ?0.265] | ?4.12 | ||||
| Step3: Abuse unpredictability × Safety and order | ?0.20* | ?0.05 | 0.025 | [?0.100, ?0.003] | ?2.14 | 0.028* | 0.187 | 0.00 | 0.01 | 0.526 | [?1.025, 1.050] | 0.02 | 0.000 | 0.334 |
| School acceptance and support | ||||||||||||||
| Step2: Abuse unpredictability | 0.42** | 0.05 | 0.018 | [0.016, 0.087] | 2.85 | 0.047* | 0.142 | ?0.17 | ?0.50 | 0.378 | [?1.241, 0.251] | ?1.31 | 0.052** | 0.289 |
| Acceptance and support | ?0.11 | ?0.00 | 0.004 | [?0.012, 0.002] | ?1.33 | ?0.24** | ?0.27 | 0.084 | [?0.439, ?0.104] | ?3.20 | ||||
| Step3: Abuse unpredictability × Acceptance and support | ?0.10 | ?0.03 | 0.019 | [?0.064, 0.012] | ?1.34 | 0.014 | 0.160 | ?0.07 | ?0.41 | 0.409 | [?1.217, 0.396] | ?1.00 | 0.004 | 0.296 |
| School equality and fairness | ||||||||||||||
| Step2: Abuse unpredictability | 0.42** | 0.05 | 0.018 | [0.016, 0.087] | 2.84 | 0.049* | 0.144 | ?0.17 | ?0.50 | 0.377 | [?1.239, 0.248] | ?1.31 | 0.057** | 0.297 |
| Equality and fairness | ?0.11 | ?0.00 | 0.003 | [?0.011, 0.002] | ?1.43 | ?0.25*** | ?0.25 | 0.072 | [?0.388, ?0.102] | ?3.38 | ||||
| Step3: Abuse unpredictability × Equality and fairness | ?0.00 | ?0.00 | 0.016 | [?0.033, 0.031] | ?0.07 | 0.003 | ?0.00 | ?0.02 | 0.349 | [?0.705, 0.674] | ?0.05 | 0.000 | 0.297 | |
| School autonomy and cooperation | ||||||||||||||
| Step2: Abuse unpredictability | 0.40** | 0.05 | 0.018 | [0.013, 0.085] | 2.72 | 0.042* | 0.135 | ?0.19 | ?0.54 | 0.383 | [?1.307, 0.212] | ?1.42 | 0.028* | 0.250 |
| Autonomy and cooperation | ?0.07 | ?0.00 | 0.004 | [?0.010, 0.004] | ?0.85 | ?0.15* | ?0.17 | 0.080 | [?0.323, ?0.007] | ?2.06 | ||||
| Step3: Abuse unpredictability × Autonomy and cooperation | ?0.03 | ?0.01 | 0.019 | [?0.045, 0.031] | ?0.37 | 0.005 | 0.141 | 0.02 | 0.14 | 0.413 | [?0.674, 0.957] | 0.34 | 0.000 | 0.251 |
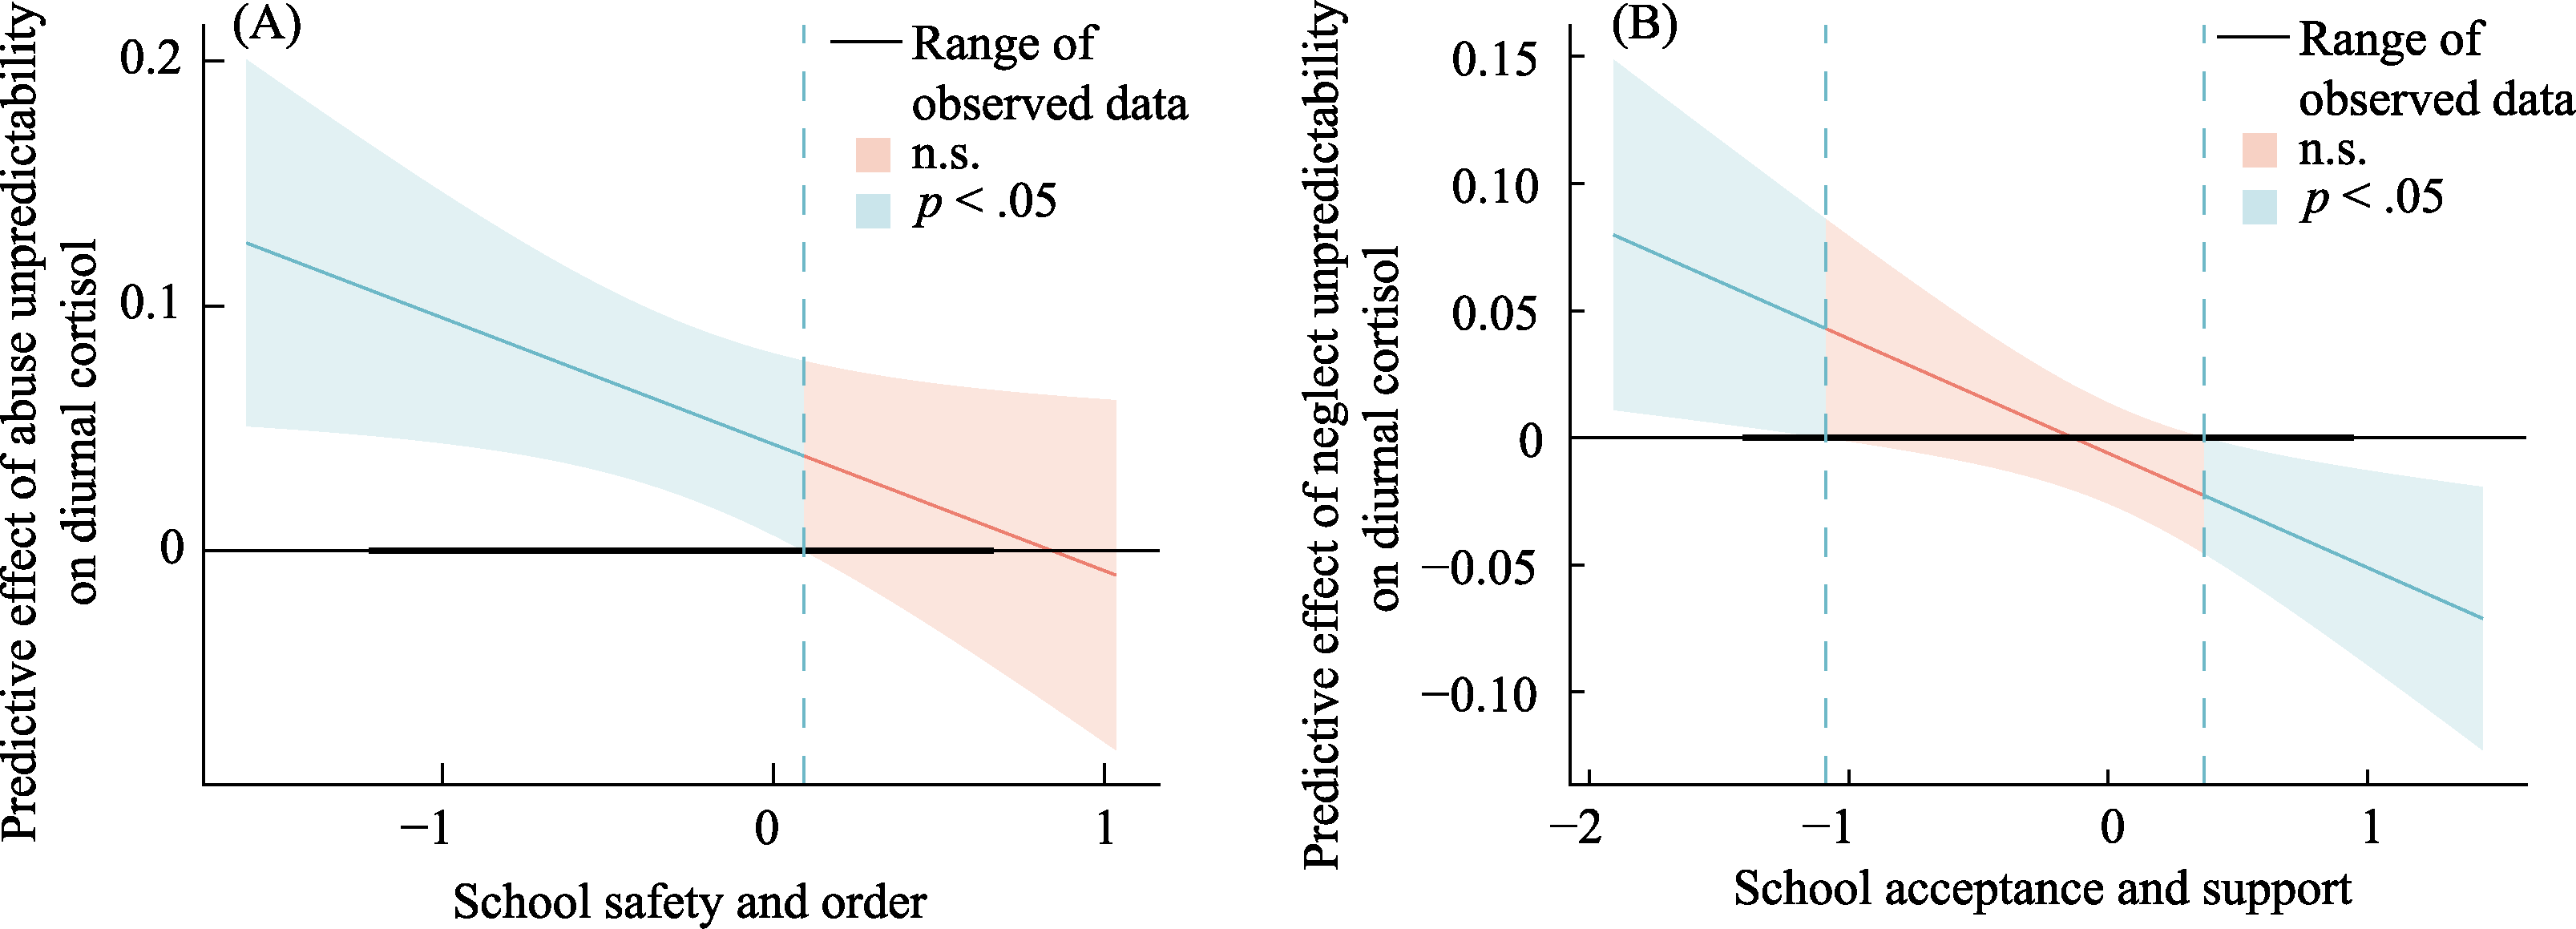
Figure 4. The moderating effects of positive school climate. Note. Panel A illustrates the moderating effect of school safety and order on the association between abuse unpredictability and diurnal cortisol slope. The x-axis represents mean-centered scores of school safety and order, ranging from ?1.21 to 0.66. Panel B illustrates the moderating effect of school support and acceptance on the association between neglect unpredictability and diurnal cortisol slope. The x-axis represents mean-centered scores of school support and acceptance, ranging from ?1.40 to 0.94.
| Variable | Diurnal Cortisol Slope | Depressive Symptoms | ||||||||||||
|---|---|---|---|---|---|---|---|---|---|---|---|---|---|---|
| β | B | SE | 95% CI | t | ΔR | f | β | B | SE | 95% CI | t | ΔR | f | |
| Step1: Gender | ?0.16* | ?0.01 | 0.004 | [?0.016, ?0.000] | ?1.98 | 0.106 | 0.118 | 0.17* | 0.20 | 0.083 | [0.039, 0.367] | 2.44 | 0.147 | 0.172 |
| Age | ?0.15 | ?0.00 | 0.002 | [?0.009, 0.000] | ?1.91 | 0.10 | 0.07 | 0.047 | [?0.021, 0.167] | 1.54 | ||||
| Waking time | ?0.08 | ?0.01 | 0.013 | [?0.010, 0.012] | ?1.08 | — | — | — | — | — | ||||
| Sampling location | ?0.04 | ?0.01 | 0.009 | [?0.024, 0.014] | ?0.55 | — | — | — | — | — | ||||
| T1 Depressive symptoms | — | — | — | — | — | 0.22** | 0.25 | 0.079 | [0.089, 0.403] | 3.09 | ||||
| Abuse unpredictability | 0.23** | 0.03 | 0.011 | [0.008, 0.051] | 2.76 | 0.13 | 0.38 | 0.217 | [?0.046, 0.808] | 1.76 | ||||
| Mean neglect exposure | 0.02 | 0.00 | 0.005 | [?0.008, 0.010] | 0.20 | 0.10 | 0.10 | 0.073 | [?0.042, 0.244] | 1.39 | ||||
| School safety and order | ||||||||||||||
| Step2: Neglect unpredictability | ?0.06 | ?0.01 | 0.010 | [?0.028, 0.013] | ?0.73 | 0.007 | 0.127 | ?0.01 | ?0.04 | 0.198 | [?0.427, 0.356] | ?0.18 | 0.091*** | 0.313 |
| Safety and order | ?0.07 | ?0.00 | 0.006 | [?0.016, 0.007] | ?0.75 | ?0.37*** | ?0.56 | 0.119 | [?0.799, ?0.328] | ?4.72 | ||||
| Step3: Neglect unpredictability × Safety and order | ?0.14 | ?0.05 | 0.024 | [?0.092, 0.003] | ?1.84 | 0.020 | 0.153 | ?0.04 | ?0.31 | 0.498 | [?1.291, 0.675] | ?0.62 | 0.002 | 0.315 |
| School acceptance and support | ||||||||||||||
| Step2: Neglect unpredictability | ?0.07 | ?0.01 | 0.010 | [?0.028, 0.013] | ?0.74 | 0.006 | 0.126 | ?0.02 | ?0.04 | 0.203 | [?0.446, 0.357] | ?0.22 | 0.050** | 0.245 |
| Acceptance and support | ?0.05 | ?0.00 | 0.004 | [?0.011, 0.006] | ?0.58 | ?0.29*** | ?0.33 | 0.096 | [?0.518, ?0.138] | ?3.40 | ||||
| Step3: Neglect unpredictability × Acceptance and support | ?0.21** | ?0.04 | 0.017 | [?0.079, ?0.011] | ?2.62 | 0.040** | 0.178 | 0.12 | 0.64 | 0.354 | [?0.061, 1.337] | 1.80 | 0.014 | 0.267 |
| School equality and fairness | ||||||||||||||
| Step2: Neglect unpredictability | ?0.06 | ?0.01 | 0.010 | [?0.027, 0.013] | ?0.71 | 0.010 | 0.132 | ?0.01 | ?0.04 | 0.203 | [?0.442, 0.360] | ?0.20 | 0.053** | 0.249 |
| Equality and fairness | ?0.10 | ?0.00 | 0.004 | [?0.012, 0.003] | ?1.09 | ?0.29*** | ?0.29 | 0.082 | [?0.518, ?0.138] | ?3.49 | ||||
| Step3: Neglect unpredictability × Equality and fairness | ?0.15 | ?0.03 | 0.017 | [?0.067, 0.001] | ?1.89 | 0.021 | 0.159 | 0.13 | 0.63 | 0.329 | [?0.018, 1.281] | 1.92 | 0.016 | 0.274 |
| School autonomy and cooperation | ||||||||||||||
| Step2: Neglect unpredictability | ?0.07 | ?0.01 | 0.010 | [?0.028, 0.012] | ?0.78 | 0.005 | 0.125 | ?0.03 | ?0.07 | 0.207 | [?0.483, 0.336] | ?0.35 | 0.018 | 0.198 |
| Autonomy and cooperation | ?0.05 | ?0.00 | 0.004 | [?0.011, 0.006] | ?0.52 | ?0.17* | ?0.19 | 0.094 | [?0.373, ?0.001] | ?1.99 | ||||
| Step3: Neglect unpredictability × Autonomy and cooperation | ?0.13 | ?0.03 | 0.019 | [?0.068, 0.007] | ?1.61 | 0.015 | 0.145 | 0.13 | 0.71 | 0.372 | [?0.022, 1.745] | 1.91 | 0.016 | 0.221 |
Table 2 Moderating effects of positive school climate on the associations between neglect unpredictability and outcomes
| Variable | Diurnal Cortisol Slope | Depressive Symptoms | ||||||||||||
|---|---|---|---|---|---|---|---|---|---|---|---|---|---|---|
| β | B | SE | 95% CI | t | ΔR | f | β | B | SE | 95% CI | t | ΔR | f | |
| Step1: Gender | ?0.16* | ?0.01 | 0.004 | [?0.016, ?0.000] | ?1.98 | 0.106 | 0.118 | 0.17* | 0.20 | 0.083 | [0.039, 0.367] | 2.44 | 0.147 | 0.172 |
| Age | ?0.15 | ?0.00 | 0.002 | [?0.009, 0.000] | ?1.91 | 0.10 | 0.07 | 0.047 | [?0.021, 0.167] | 1.54 | ||||
| Waking time | ?0.08 | ?0.01 | 0.013 | [?0.010, 0.012] | ?1.08 | — | — | — | — | — | ||||
| Sampling location | ?0.04 | ?0.01 | 0.009 | [?0.024, 0.014] | ?0.55 | — | — | — | — | — | ||||
| T1 Depressive symptoms | — | — | — | — | — | 0.22** | 0.25 | 0.079 | [0.089, 0.403] | 3.09 | ||||
| Abuse unpredictability | 0.23** | 0.03 | 0.011 | [0.008, 0.051] | 2.76 | 0.13 | 0.38 | 0.217 | [?0.046, 0.808] | 1.76 | ||||
| Mean neglect exposure | 0.02 | 0.00 | 0.005 | [?0.008, 0.010] | 0.20 | 0.10 | 0.10 | 0.073 | [?0.042, 0.244] | 1.39 | ||||
| School safety and order | ||||||||||||||
| Step2: Neglect unpredictability | ?0.06 | ?0.01 | 0.010 | [?0.028, 0.013] | ?0.73 | 0.007 | 0.127 | ?0.01 | ?0.04 | 0.198 | [?0.427, 0.356] | ?0.18 | 0.091*** | 0.313 |
| Safety and order | ?0.07 | ?0.00 | 0.006 | [?0.016, 0.007] | ?0.75 | ?0.37*** | ?0.56 | 0.119 | [?0.799, ?0.328] | ?4.72 | ||||
| Step3: Neglect unpredictability × Safety and order | ?0.14 | ?0.05 | 0.024 | [?0.092, 0.003] | ?1.84 | 0.020 | 0.153 | ?0.04 | ?0.31 | 0.498 | [?1.291, 0.675] | ?0.62 | 0.002 | 0.315 |
| School acceptance and support | ||||||||||||||
| Step2: Neglect unpredictability | ?0.07 | ?0.01 | 0.010 | [?0.028, 0.013] | ?0.74 | 0.006 | 0.126 | ?0.02 | ?0.04 | 0.203 | [?0.446, 0.357] | ?0.22 | 0.050** | 0.245 |
| Acceptance and support | ?0.05 | ?0.00 | 0.004 | [?0.011, 0.006] | ?0.58 | ?0.29*** | ?0.33 | 0.096 | [?0.518, ?0.138] | ?3.40 | ||||
| Step3: Neglect unpredictability × Acceptance and support | ?0.21** | ?0.04 | 0.017 | [?0.079, ?0.011] | ?2.62 | 0.040** | 0.178 | 0.12 | 0.64 | 0.354 | [?0.061, 1.337] | 1.80 | 0.014 | 0.267 |
| School equality and fairness | ||||||||||||||
| Step2: Neglect unpredictability | ?0.06 | ?0.01 | 0.010 | [?0.027, 0.013] | ?0.71 | 0.010 | 0.132 | ?0.01 | ?0.04 | 0.203 | [?0.442, 0.360] | ?0.20 | 0.053** | 0.249 |
| Equality and fairness | ?0.10 | ?0.00 | 0.004 | [?0.012, 0.003] | ?1.09 | ?0.29*** | ?0.29 | 0.082 | [?0.518, ?0.138] | ?3.49 | ||||
| Step3: Neglect unpredictability × Equality and fairness | ?0.15 | ?0.03 | 0.017 | [?0.067, 0.001] | ?1.89 | 0.021 | 0.159 | 0.13 | 0.63 | 0.329 | [?0.018, 1.281] | 1.92 | 0.016 | 0.274 |
| School autonomy and cooperation | ||||||||||||||
| Step2: Neglect unpredictability | ?0.07 | ?0.01 | 0.010 | [?0.028, 0.012] | ?0.78 | 0.005 | 0.125 | ?0.03 | ?0.07 | 0.207 | [?0.483, 0.336] | ?0.35 | 0.018 | 0.198 |
| Autonomy and cooperation | ?0.05 | ?0.00 | 0.004 | [?0.011, 0.006] | ?0.52 | ?0.17* | ?0.19 | 0.094 | [?0.373, ?0.001] | ?1.99 | ||||
| Step3: Neglect unpredictability × Autonomy and cooperation | ?0.13 | ?0.03 | 0.019 | [?0.068, 0.007] | ?1.61 | 0.015 | 0.145 | 0.13 | 0.71 | 0.372 | [?0.022, 1.745] | 1.91 | 0.016 | 0.221 |
| Variable | M | SD | Min | Max |
|---|---|---|---|---|
| T1 Abuse | 1.44 | 0.64 | 1.00 | 4.20 |
| T2 Abuse | 1.22 | 0.34 | 1.00 | 3.00 |
| T3 Abuse | 1.31 | 0.52 | 1.00 | 3.60 |
| T4 Abuse | 1.27 | 0.41 | 1.00 | 3.10 |
| T1 Neglect | 2.08 | 0.73 | 1.00 | 4.20 |
| T2 Neglect | 2.12 | 0.76 | 1.00 | 4.00 |
| T3 Neglect | 2.09 | 0.81 | 1.00 | 4.40 |
| T4 Neglect | 2.05 | 0.78 | 1.00 | 3.80 |
Table S1 Descriptive statistics of abuse and neglect across assessment waves
| Variable | M | SD | Min | Max |
|---|---|---|---|---|
| T1 Abuse | 1.44 | 0.64 | 1.00 | 4.20 |
| T2 Abuse | 1.22 | 0.34 | 1.00 | 3.00 |
| T3 Abuse | 1.31 | 0.52 | 1.00 | 3.60 |
| T4 Abuse | 1.27 | 0.41 | 1.00 | 3.10 |
| T1 Neglect | 2.08 | 0.73 | 1.00 | 4.20 |
| T2 Neglect | 2.12 | 0.76 | 1.00 | 4.00 |
| T3 Neglect | 2.09 | 0.81 | 1.00 | 4.40 |
| T4 Neglect | 2.05 | 0.78 | 1.00 | 3.80 |
| Variables | Model | χ | df | CFI | TLI | RMSEA | SRMR | ΔCFI | ΔRMSEA |
|---|---|---|---|---|---|---|---|---|---|
| Abuse | Configural invariance | 2187.489 | 651 | 0.915 | 0.898 | 0.028 | 0.043 | ||
| Metric invariance | 2373.624 | 675 | 0.906 | 0.892 | 0.029 | 0.052 | < 0.01 | < 0.01 | |
| Scalar invariance | 2807.410 | 705 | 0.884 | 0.871 | 0.031 | 0.058 | > 0.01 | < 0.01 | |
| Partial scalar invariance | 2533.570 | 684 | 0.898 | 0.883 | 0.030 | 0.054 | < 0.01 | < 0.01 | |
| Neglect | Configural invariance | 2865.228 | 651 | 0.910 | 0.892 | 0.033 | 0.045 | ||
| Metric invariance | 3054.231 | 675 | 0.904 | 0.889 | 0.034 | 0.055 | < 0.01 | < 0.01 | |
| Scalar invariance | 3780.905 | 705 | 0.875 | 0.862 | 0.038 | 0.058 | > 0.01 | < 0.01 | |
| Partial scalar invariance | 3135.942 | 684 | 0.901 | 0.887 | 0.034 | 0.055 | < 0.01 | < 0.01 |
Table S2 Results of longitudinal measurement invariance tests of abuse and neglect measures
| Variables | Model | χ | df | CFI | TLI | RMSEA | SRMR | ΔCFI | ΔRMSEA |
|---|---|---|---|---|---|---|---|---|---|
| Abuse | Configural invariance | 2187.489 | 651 | 0.915 | 0.898 | 0.028 | 0.043 | ||
| Metric invariance | 2373.624 | 675 | 0.906 | 0.892 | 0.029 | 0.052 | < 0.01 | < 0.01 | |
| Scalar invariance | 2807.410 | 705 | 0.884 | 0.871 | 0.031 | 0.058 | > 0.01 | < 0.01 | |
| Partial scalar invariance | 2533.570 | 684 | 0.898 | 0.883 | 0.030 | 0.054 | < 0.01 | < 0.01 | |
| Neglect | Configural invariance | 2865.228 | 651 | 0.910 | 0.892 | 0.033 | 0.045 | ||
| Metric invariance | 3054.231 | 675 | 0.904 | 0.889 | 0.034 | 0.055 | < 0.01 | < 0.01 | |
| Scalar invariance | 3780.905 | 705 | 0.875 | 0.862 | 0.038 | 0.058 | > 0.01 | < 0.01 | |
| Partial scalar invariance | 3135.942 | 684 | 0.901 | 0.887 | 0.034 | 0.055 | < 0.01 | < 0.01 |
| Parameter/Statistic | Abuse | Neglect | ||||
|---|---|---|---|---|---|---|
| Intercept-only | Fixed linear slope | Random linear slope | Fixed quadratic slope | Intercept-only | Fixed linear slope | |
| Intercept | ||||||
| Fixed Effect γ00 (SE) | 1.31 (0.02)*** | 1.40 (0.04)*** | 1.40 (0.04)*** | 1.44 (0.04)*** | 2.09 (0.04)*** | 2.09 (0.04)*** |
| Random Effect Variance τ00 | 0.07 | 0.07 | 0.19 | 0.09 | 0.25 | 0.25 |
| Linear slope | ||||||
| Fixed Effect γ10 (SE) | — | ?0.04 (0.01)*** | ?0.04 (0.01)*** | ?0.14 (0.03)*** | — | ?0.004 (0.01) |
| Random Effect Variance τ10 | — | — | 0.01 | 0.01 | — | — |
| Quadratic slope | ||||||
| Fixed Effect γ20 (SE) | — | — | — | 0.03 (0.01)*** | — | — |
| Random Effect Variance τ20 | — | — | — | — | — | — |
| Residual Variance | 0.178 | 0.173 | 0.141 | 0.137 | 0.34 | 0.34 |
| Model Fit | ||||||
| ?2LL | 1115.0 | 1099.5 | 1068.6 | 1056.4 | 1743.4 | 1743.3 |
| AIC | 1121.0 | 1107.5 | 1080.6 | 1070.4 | 1749.4 | 1751.3 |
| BIC | 1135.2 | 1126.4 | 1108.9 | 1103.4 | 1749.4 | 1770.1 |
Table S3 Parameter estimates of linear mixed models
| Parameter/Statistic | Abuse | Neglect | ||||
|---|---|---|---|---|---|---|
| Intercept-only | Fixed linear slope | Random linear slope | Fixed quadratic slope | Intercept-only | Fixed linear slope | |
| Intercept | ||||||
| Fixed Effect γ00 (SE) | 1.31 (0.02)*** | 1.40 (0.04)*** | 1.40 (0.04)*** | 1.44 (0.04)*** | 2.09 (0.04)*** | 2.09 (0.04)*** |
| Random Effect Variance τ00 | 0.07 | 0.07 | 0.19 | 0.09 | 0.25 | 0.25 |
| Linear slope | ||||||
| Fixed Effect γ10 (SE) | — | ?0.04 (0.01)*** | ?0.04 (0.01)*** | ?0.14 (0.03)*** | — | ?0.004 (0.01) |
| Random Effect Variance τ10 | — | — | 0.01 | 0.01 | — | — |
| Quadratic slope | ||||||
| Fixed Effect γ20 (SE) | — | — | — | 0.03 (0.01)*** | — | — |
| Random Effect Variance τ20 | — | — | — | — | — | — |
| Residual Variance | 0.178 | 0.173 | 0.141 | 0.137 | 0.34 | 0.34 |
| Model Fit | ||||||
| ?2LL | 1115.0 | 1099.5 | 1068.6 | 1056.4 | 1743.4 | 1743.3 |
| AIC | 1121.0 | 1107.5 | 1080.6 | 1070.4 | 1749.4 | 1751.3 |
| BIC | 1135.2 | 1126.4 | 1108.9 | 1103.4 | 1749.4 | 1770.1 |
| Variable | Diurnal cortisol slope | Depressive symptoms | ||||||||||||
|---|---|---|---|---|---|---|---|---|---|---|---|---|---|---|
| β | B | SE | 95% CI | t | ΔR | f | β | B | SE | 95% CI | t | ΔR | f | |
| Gender | ?0.16* | ?0.01 | 0.003 | [?0.152, ?0.001] | ?2.06 | 0.076 | 0.084 | 0.16* | 0.19 | 0.082 | [0.027, 0.351] | 2.31 | 0.173 | 0.208 |
| Age | ?0.18* | ?0.01 | 0.002 | [?0.009, ?0.001] | ?2.39 | 0.13 | 0.09 | 0.047 | [?0.005, 0.182] | 1.87 | ||||
| Waking times | ?0.11 | ?0.02 | 0.011 | [?0.038, 0.006] | ?1.36 | — | — | — | — | — | ||||
| Sampling location | ?0.11 | ?0.01 | 0.007 | [?0.023, 0.004] | ?1.41 | — | — | — | — | — | ||||
| T1 Depressive symptoms | — | — | — | — | — | 0.18** | 0.20 | 0.080 | [0.040, 0.358] | 2.48 | ||||
| Unpredictability in neglect | ?0.04 | ?0.00 | 0.009 | [?0.021, 0.013] | ?0.50 | 0.03 | 0.07 | 0.188 | [?0.299, 0.445] | 0.39 | ||||
| Mean level of abuse | 0.13 | 0.01 | 0.005 | [?0.001, 0.019] | 1.66 | 0.26*** | 0.66 | 0.181 | [0.299, 1.015] | 3.63 | ||||
| Unpredictability in abuse | 0.39** | 0.05 | 0.018 | [0.011, 0.084] | 2.63 | 0.037** | 0.129 | ?0.20 | ?0.57 | 0.387 | [?1.335, 0.190] | ?1.48 | 0.009 | 0.222 |
| Abuse unpredictability × mean level | ?0.31* | ?0.06 | 0.022 | [?0.101, ?0.010] | ?2.42 | 0.031* | 0.151 | ?0.25* | ?1.23 | 0.528 | [?2.277, ?0.193] | ?2.34 | 0.053*** | 0.308 |
Table S4 Interaction between abuse unpredictability and mean abuse level
| Variable | Diurnal cortisol slope | Depressive symptoms | ||||||||||||
|---|---|---|---|---|---|---|---|---|---|---|---|---|---|---|
| β | B | SE | 95% CI | t | ΔR | f | β | B | SE | 95% CI | t | ΔR | f | |
| Gender | ?0.16* | ?0.01 | 0.003 | [?0.152, ?0.001] | ?2.06 | 0.076 | 0.084 | 0.16* | 0.19 | 0.082 | [0.027, 0.351] | 2.31 | 0.173 | 0.208 |
| Age | ?0.18* | ?0.01 | 0.002 | [?0.009, ?0.001] | ?2.39 | 0.13 | 0.09 | 0.047 | [?0.005, 0.182] | 1.87 | ||||
| Waking times | ?0.11 | ?0.02 | 0.011 | [?0.038, 0.006] | ?1.36 | — | — | — | — | — | ||||
| Sampling location | ?0.11 | ?0.01 | 0.007 | [?0.023, 0.004] | ?1.41 | — | — | — | — | — | ||||
| T1 Depressive symptoms | — | — | — | — | — | 0.18** | 0.20 | 0.080 | [0.040, 0.358] | 2.48 | ||||
| Unpredictability in neglect | ?0.04 | ?0.00 | 0.009 | [?0.021, 0.013] | ?0.50 | 0.03 | 0.07 | 0.188 | [?0.299, 0.445] | 0.39 | ||||
| Mean level of abuse | 0.13 | 0.01 | 0.005 | [?0.001, 0.019] | 1.66 | 0.26*** | 0.66 | 0.181 | [0.299, 1.015] | 3.63 | ||||
| Unpredictability in abuse | 0.39** | 0.05 | 0.018 | [0.011, 0.084] | 2.63 | 0.037** | 0.129 | ?0.20 | ?0.57 | 0.387 | [?1.335, 0.190] | ?1.48 | 0.009 | 0.222 |
| Abuse unpredictability × mean level | ?0.31* | ?0.06 | 0.022 | [?0.101, ?0.010] | ?2.42 | 0.031* | 0.151 | ?0.25* | ?1.23 | 0.528 | [?2.277, ?0.193] | ?2.34 | 0.053*** | 0.308 |
| Variable | Diurnal cortisol slope | Depressive symptoms | ||||||||||||
|---|---|---|---|---|---|---|---|---|---|---|---|---|---|---|
| β | B | SE | 95% CI | t | ΔR | f | β | B | SE | 95% CI | t | ΔR | f | |
| Gender | ?0.16* | ?0.01 | 0.004 | [?0.016, ?0.000] | ?1.98 | 0.106 | 0.118 | 0.17* | 0.20 | 0.083 | [0.039, 0.367] | 2.44 | 0.147 | 0.172 |
| Age | ?0.15 | ?0.00 | 0.002 | [?0.009, 0.000] | ?1.91 | 0.10 | 0.07 | 0.047 | [?0.021, 0.167] | 1.54 | ||||
| Waking times | ?0.08 | ?0.01 | 0.013 | [?0.010, 0.012] | ?1.08 | — | — | — | — | — | ||||
| Sampling location | ?0.04 | ?0.01 | 0.009 | [?0.024, 0.014] | ?0.55 | — | — | — | — | — | ||||
| T1 Depressive symptoms | — | — | — | — | — | 0.22** | 0.25 | 0.079 | [0.089, 0.403] | 3.09 | ||||
| Unpredictability in abuse | 0.23** | 0.03 | 0.011 | [0.008, 0.051] | 2.76 | 0.13 | 0.38 | 0.217 | [?0.046, 0.808] | 1.76 | ||||
| Mean level of neglect | 0.02 | 0.00 | 0.005 | [?0.008, 0.010] | 0.20 | 0.10 | 0.10 | 0.073 | [?0.042, 0.244] | 1.39 | ||||
| Unpredictability in neglect | ?0.07 | ?0.01 | 0.010 | [?0.028, 0.012] | ?0.78 | 0.004 | 0.123 | ?0.03 | ?0.08 | 0.209 | [?0.484, 0.341] | ?0.34 | 0.001 | 0.173 |
| Neglect unpredictability × mean level | ?0.03 | ?0.01 | 0.027 | [?0.066, 0.043] | ?0.42 | 0.001 | 0.124 | ?0.06 | ?0.37 | 0.421 | [?1.205, 0.459] | ?0.88 | 0.004 | 0.178 |
Table S5 Interaction between neglect unpredictability and mean neglect level
| Variable | Diurnal cortisol slope | Depressive symptoms | ||||||||||||
|---|---|---|---|---|---|---|---|---|---|---|---|---|---|---|
| β | B | SE | 95% CI | t | ΔR | f | β | B | SE | 95% CI | t | ΔR | f | |
| Gender | ?0.16* | ?0.01 | 0.004 | [?0.016, ?0.000] | ?1.98 | 0.106 | 0.118 | 0.17* | 0.20 | 0.083 | [0.039, 0.367] | 2.44 | 0.147 | 0.172 |
| Age | ?0.15 | ?0.00 | 0.002 | [?0.009, 0.000] | ?1.91 | 0.10 | 0.07 | 0.047 | [?0.021, 0.167] | 1.54 | ||||
| Waking times | ?0.08 | ?0.01 | 0.013 | [?0.010, 0.012] | ?1.08 | — | — | — | — | — | ||||
| Sampling location | ?0.04 | ?0.01 | 0.009 | [?0.024, 0.014] | ?0.55 | — | — | — | — | — | ||||
| T1 Depressive symptoms | — | — | — | — | — | 0.22** | 0.25 | 0.079 | [0.089, 0.403] | 3.09 | ||||
| Unpredictability in abuse | 0.23** | 0.03 | 0.011 | [0.008, 0.051] | 2.76 | 0.13 | 0.38 | 0.217 | [?0.046, 0.808] | 1.76 | ||||
| Mean level of neglect | 0.02 | 0.00 | 0.005 | [?0.008, 0.010] | 0.20 | 0.10 | 0.10 | 0.073 | [?0.042, 0.244] | 1.39 | ||||
| Unpredictability in neglect | ?0.07 | ?0.01 | 0.010 | [?0.028, 0.012] | ?0.78 | 0.004 | 0.123 | ?0.03 | ?0.08 | 0.209 | [?0.484, 0.341] | ?0.34 | 0.001 | 0.173 |
| Neglect unpredictability × mean level | ?0.03 | ?0.01 | 0.027 | [?0.066, 0.043] | ?0.42 | 0.001 | 0.124 | ?0.06 | ?0.37 | 0.421 | [?1.205, 0.459] | ?0.88 | 0.004 | 0.178 |
| [1] |
Adam E. K., & Kumari M. (2009). Assessing salivary cortisol in large-scale, epidemiological research. Psychoneuroendocrinology, 34(10), 1423-1436.
doi: 10.1016/j.psyneuen.2009.06.011 pmid: 19647372 |
| [2] |
Adam E. K., Quinn M. E., Tavernier R., McQuillan M. T., Dahlke K. A., & Gilbert K. E. (2017). Diurnal cortisol slopes and mental and physical health outcomes: A systematic review and meta-analysis. Psychoneuroendocrinology, 83, 25-41.
doi: S0306-4530(17)30265-2 pmid: 28578301 |
| [3] |
Allen J. P., Insabella G., Porter M. R., Smith F. D., Land D., & Phillips N. (2006). A social-interactional model of the development of depressive symptoms in adolescence. Journal of Consulting and Clinical Psychology, 74(1), 55-65.
pmid: 16551143 |
| [4] |
Andresen E. M., Malmgren J. A., Carter W. B., & Patrick D. L. (1994). Screening for depression in well older adults: Evaluation of a short form of the CES-D (Center for Epidemiologic Studies Depression Scale). American Journal of Preventive Medicine, 10(2), 77-84.
pmid: 8037935 |
| [5] |
Bernstein D. P., Stein J. A., Newcomb M. D., Walker E., Pogge D., Ahluvalia T., … Zule W. (2003). Development and validation of a brief screening version of the Childhood Trauma Questionnaire. Child Abuse & Neglect, 27(2), 169-190.
doi: 10.1016/S0145-2134(02)00541-0 URL |
| [6] |
Black K., & Lobo M. (2008). A conceptual review of family resilience factors. Journal of Family Nursing, 14(1), 33-55.
doi: 10.1177/1074840707312237 pmid: 18281642 |
| [7] | Bronfenbrenner, U., & Morris P. A. (2006). The bioecological model of human development. In R. M.Lerner & W.Damon (Eds.), Handbook of child psychology: Theoretical models of human development (6th ed., pp. 793-828). John Wiley & Sons, Inc. |
| [8] |
Brown E. D., Anderson K. E., Garnett M. L., & Hill E. M. (2019). Economic instability and household chaos relate to cortisol for children in poverty. Journal of Family Psychology, 33(6), 629-639.
doi: 10.1037/fam0000545 pmid: 31169392 |
| [9] |
Chen E., & Matthews K. A. (2003). Development of the cognitive appraisal and understanding of social events (CAUSE) videos. Health Psychology, 22(1), 106-110.
pmid: 12558208 |
| [10] | Chen Z., Yang X., & Li X. (2009). Psychometric features of CES-D in Chinese adolescents. Chinese Journal of Clinical Psychology, 17(4), 443-445. |
| [11] |
Cicchetti D., & Toth S. L. (2015). Multilevel developmental perspectives on child maltreatment. Development and psychopathology, 27(4pt2), 1385-1386.
doi: 10.1017/S0954579415000814 URL |
| [12] | Cohen J. (1988). Statistical power analysis for the behavioral sciences (2nd ed.). Academic Press. |
| [13] |
Crooks C. V., Scott K. L., Wolfe D. A., Chiodo D., & Killip S. (2007). Understanding the link between childhood maltreatment and violent delinquency: What do schools have to add? Child Maltreatment, 12(3), 269-280.
doi: 10.1177/1077559507301843 pmid: 17631626 |
| [14] |
DePasquale C. E., Herzberg M. P., & Gunnar M. R. (2021). The pubertal stress recalibration hypothesis: Potential neural and behavioral consequences. Child Development Perspectives, 15(4), 249-256.
doi: 10.1111/cdep.12429 pmid: 34925549 |
| [15] |
DiMarzio K., Hare M., Sisitsky M., Cadet G., Satoba S., & Parent J. (2025). How school and community supports influence psychosocial outcomes of children experiencing emotional maltreatment. Child Abuse & Neglect, 160, 107174.
doi: 10.1016/j.chiabu.2024.107174 URL |
| [16] | Dong Q., & Lin C. (2011). Key indicators of psychological development and evaluation of Chinese children and adolescents aged 6 to 15. Beijing: Science Press. |
| [17] |
Doom J. R., Cook S. H., Sturza J., Kaciroti N., Gearhardt A. N., Vazquez D. M., … Miller A. L. (2018). Family conflict, chaos, and negative life events predict cortisol activity in low‐income children. Developmental Psychobiology, 60(4), 364-379.
doi: 10.1002/dev.v60.4 URL |
| [18] |
Doom J. R., Han D., Rivera K. M., & Tseten T. (2024). Childhood unpredictability research within the developmental psychopathology framework: Advances, implications, and future directions. Development and Psychopathology, 36(5), 2452-2463.
doi: 10.1017/S0954579424000610 URL |
| [19] |
Doom J. R., Vanzomeren-Dohm A. A., & Simpson J. A. (2016). Early unpredictability predicts increased adolescent externalizing behaviors and substance use: A life history perspective. Development and Psychopathology, 28(4pt2), 1505-1516.
pmid: 26645743 |
| [20] | Eccles, J. S., & Roeser R. W. (2009). Schools, academic motivation, and stage-environment fit. In R. M.Lerner & L.Steinberg (Eds.), Handbook of adolescent psychology: Individual bases of adolescent development (3rd ed., pp. 404-434). John Wiley & Sons, Inc. |
| [21] |
Ellis B. J., Sheridan M. A., Belsky J., & McLaughlin K. A. (2022). Why and how does early adversity influence development? Toward an integrated model of dimensions of environmental experience. Development and Psychopathology, 34(2), 447-471.
doi: 10.1017/S0954579421001838 URL |
| [22] |
Farkas B. C., & Jacquet P. O. (2025). Characterizing the role of unpredictability within different dimensions of early life adversity. Development and Psychopathology, 37(4), 1996-2010.
doi: 10.1017/S095457942400155X URL |
| [23] |
Gaias L. M., Lindstrom Johnson S., White R. M., Pettigrew J., & Dumka L. (2019). Positive school climate as a moderator of violence exposure for Colombian adolescents. American Journal of Community Psychology, 63(1-2), 17-31.
doi: 10.1002/ajcp.12300 pmid: 30609076 |
| [24] |
Gao Q., Niu L., Wang W., Zhao S., Xiao J., & Lin D. (2024). Developmental trajectories of mental health in Chinese early adolescents: School climate and future orientation as predictors. Research on Child and Adolescent Psychopathology, 52(8), 1303-1317.
doi: 10.1007/s10802-024-01195-9 pmid: 38625459 |
| [25] |
García-Pérez M. A. (2023). Use and misuse of corrections for multiple testing. Methods in Psychology, 8, 100120.
doi: 10.1016/j.metip.2023.100120 URL |
| [26] | Gartland D., Riggs E., Muyeen S., Giallo R., Afifi T. O., MacMillan H., ... Brown S. J. (2019). What factors are associated with resilient outcomes in children exposed to social adversity? A systematic review. BMJ Open, 9(4), e024870. |
| [27] |
Gibb B. E., Alloy L. B., Abramson L. Y., Rose D. T., Whitehouse W. G., Donovan P., ... Tierney S. (2001). History of childhood maltreatment, negative cognitive styles, and episodes of depression in adulthood. Cognitive Therapy and Research, 25(4), 425-446.
doi: 10.1023/A:1005586519986 |
| [28] |
Gunnar M. R., & Quevedo K. (2007). The neurobiology of stress and development. Annual Review of Psychology, 58(1), 145-173.
doi: 10.1146/psych.2007.58.issue-1 URL |
| [29] | Hagborg J. M., Kalin T., & Gerdner A. (2022). The Childhood Trauma Questionnaire—Short Form (CTQ-SF) used with adolescents - methodological report from clinical and community samples. Journal of Child & Adolescent Trauma, 15(4), 1199-1213. |
| [30] |
Hoffman L. (2007). Multilevel models for examining individual differences in within-person variation and covariation over time. Multivariate Behavioral Research, 42(4), 609-629.
doi: 10.1080/00273170701710072 URL |
| [31] |
Hong Y., McCormick S. A., Deater‐Deckard K., Calkins S. D., & Bell M. A. (2021). Household chaos, parental responses to emotion, and child emotion regulation in middle childhood. Social Development, 30(3), 786-805.
doi: 10.1111/sode.12500 pmid: 34334970 |
| [32] |
Hostinar C. E., Sullivan R. M., & Gunnar M. R. (2014). Psychobiological mechanisms underlying the social buffering of the hypothalamic-pituitary-adrenocortical axis: A review of animal models and human studies across development. Psychological Bulletin, 140(1), 256-282.
doi: 10.1037/a0032671 pmid: 23607429 |
| [33] |
Huey S. J., & Weisz J. R. (1997). Ego control, ego resiliency, and the Five-Factor Model as predictors of behavioral and emotional problems in clinic-referred children and adolescents. Journal of Abnormal Psychology, 106(3), 404-415.
pmid: 9241942 |
| [34] |
Johnson D. M., Palmieri P. A., Jackson A. P., & Hobfoll S. E. (2007). Emotional numbing weakens abused inner-city women’s resiliency resources. Journal of Traumatic Stress, 20(2), 197-206.
pmid: 17427905 |
| [35] |
Kennedy T. M., & Ceballo R. (2016). Emotionally numb: Desensitization to community violence exposure among urban youth. Developmental Psychology, 52(5), 778-789.
doi: 10.1037/dev0000112 pmid: 26986229 |
| [36] |
Knight E. L., Jiang Y., Rodriguez-Stanley J., Almeida D. M., Engeland C. G., & Zilioli S. (2021). Perceived stress is linked to heightened biomarkers of inflammation via diurnal cortisol in a national sample of adults. Brain, Behavior, and Immunity, 93, 206-213.
doi: 10.1016/j.bbi.2021.01.015 pmid: 33515741 |
| [37] |
Koss K. J., Kronaizl S., Brown R., & Brooks‐Gunn J. (2025). Childhood environmental unpredictability and adolescent mental health and behavioral problems. Child Development, 96(4), 1424-1442.
doi: 10.1111/cdev.14248 pmid: 40459078 |
| [38] | Kristensen S. M., & Jeno L. M. (2024). The developmental trajectories of teacher autonomy support and adolescent mental well-being and academic stress. Social Psychology of Education, 27(6), 1-32. |
| [39] |
Li Z., Liu S., Hartman S., & Belsky J. (2018). Interactive effects of early-life income harshness and unpredictability on children’s socioemotional and academic functioning in kindergarten and adolescence. Developmental Psychology, 54(11), 2101-2112.
doi: 10.1037/dev0000601 URL |
| [40] |
Li Z., Sturge‐Apple M. L., Platts C. R., & Davies P. T. (2023). Testing different sources of environmental unpredictability on adolescent functioning: Ancestral cue versus statistical learning and the role of temperament. Journal of Child Psychology and Psychiatry, 64(3), 437-448.
doi: 10.1111/jcpp.v64.3 URL |
| [41] |
LoPilato A. M., Addington J., Bearden C. E., Cadenhead K. S., Cannon T. D., Cornblatt B. A., ... Walker E. F. (2020). Stress perception following childhood adversity: Unique associations with adversity type and sex. Development and Psychopathology, 32(1), 343-356.
doi: 10.1017/S0954579419000130 pmid: 30846020 |
| [42] |
Machlin L., Miller A. B., Snyder J., McLaughlin K. A., & Sheridan M. A. (2019). Differential associations of deprivation and threat with cognitive control and fear conditioning in early childhood. Frontiers in Behavioral Neuroscience, 13, 80.
doi: 10.3389/fnbeh.2019.00080 pmid: 31133828 |
| [43] |
Mameli C., Biolcati R., Passini S., & Mancini G. (2018). School context and subjective distress: The influence of teacher justice and school-specific well-being on adolescents’ psychological health. School Psychology International, 39(5), 526-542.
doi: 10.1177/0143034318794226 URL |
| [44] |
Masten A. S., & Cicchetti D. (2010). Developmental cascades. Development and Psychopathology, 22(3), 491-495.
doi: 10.1017/S0954579410000222 pmid: 20576173 |
| [45] |
Masten A. S., Lucke C. M., Nelson K. M., & Stallworthy I. C. (2021). Resilience in development and psychopathology: Multisystem perspectives. Annual Review of Clinical Psychology, 17(1), 521-549.
doi: 10.1146/clinpsy.2021.17.issue-1 URL |
| [46] |
McEwen B. S. (2000). Allostasis and allostatic load: Implications for neuropsychopharmacology. Neuropsychopharmacology, 22(2), 108-124.
doi: 10.1016/S0893-133X(99)00129-3 pmid: 10649824 |
| [47] |
McLaughlin K. A., & Sheridan M. A. (2016). Beyond cumulative risk: A dimensional approach to childhood adversity. Current Directions in Psychological Science, 25(4), 239-245.
pmid: 27773969 |
| [48] |
Milojevich H. M., Norwalk K. E., & Sheridan M. A. (2019). Deprivation and threat, emotion dysregulation, and psychopathology: Concurrent and longitudinal associations. Development and Psychopathology, 31(3), 847-857.
doi: 10.1017/S0954579419000294 pmid: 31014408 |
| [49] |
Mrug S., Madan A., & Windle M. (2016). Emotional desensitization to violence contributes to adolescents’ violent behavior. Journal of Abnormal Child Psychology, 44(1), 75-86.
doi: 10.1007/s10802-015-9986-x URL |
| [50] |
Niu L., Gao Q., Xie M., Yip T., Gunnar M. R., Wang W., … Lin D. (2025). Association of childhood adversity with HPA axis activity in children and adolescents: A systematic review and meta-analysis. Neuroscience and Biobehavioral Reviews, 172, 106124.
doi: 10.1016/j.neubiorev.2025.106124 URL |
| [51] |
Olsson I., Hagekull B., Giannotta F., & Åhlander C. (2016). Adolescents and social support situations. Scandinavian Journal of Psychology, 57(3), 223-232.
doi: 10.1111/sjop.12282 pmid: 27038341 |
| [52] |
Pietto M. L., Giovannetti F., Hermida J., Segretin M. S., Lipina S. J., & Kamienkowski J. E. (2025). Perceived levels of environmental unpredictability and changes in visual attention mechanisms in adults. Behavioural Brain Research, 488, 115601.
doi: 10.1016/j.bbr.2025.115601 URL |
| [53] | R Core Team. (2021). R: A language and environment for statistical computing. R Foundation for Statistical Computing. |
| [54] |
Radloff L. S. (1977). The CES-D Scale: A self-report depression scale for research in the general population. Applied Psychological Measurement, 1(3), 385-401.
doi: 10.1177/014662167700100306 URL |
| [55] |
Rueger S. Y., Malecki C. K., Pyun Y., Aycock C., & Coyle S. (2016). A meta-analytic review of the association between perceived social support and depression in childhood and adolescence. Psychological Bulletin, 142(10), 1017-1067.
doi: 10.1037/bul0000058 pmid: 27504934 |
| [56] |
Sciaraffa M. A., Zeanah P. D., & Zeanah C. H. (2018). Understanding and promoting resilience in the context of adverse childhood experiences. Early Childhood Education Journal, 46(3), 343-353.
doi: 10.1007/s10643-017-0869-3 URL |
| [57] |
Sisk L. M., & Gee D. G. (2022). Stress and adolescence: Vulnerability and opportunity during a sensitive window of development. Current Opinion in Psychology, 44, 286-292.
doi: 10.1016/j.copsyc.2021.10.005 URL |
| [58] |
Spiller S. A., Fitzsimons G. J., Lynch J. G., & Mcclelland G. H. (2013). Spotlights, floodlights, and the magic number zero: Simple effects tests in moderated regression. Journal of Marketing Research, 50(2), 277-288.
doi: 10.1509/jmr.12.0420 URL |
| [59] |
Starr L. R., Dienes K., Stroud C. B., Shaw Z. A., Li Y. I., Mlawer F., & Huang M. (2017). Childhood adversity moderates the influence of proximal episodic stress on the cortisol awakening response and depressive symptoms in adolescents. Development and Psychopathology, 29(5), 1877-1893.
doi: 10.1017/S0954579417001468 pmid: 29162191 |
| [60] | Tao S., Liu H., Zhou C., Wang C., Sun C., Xu F., & Dong Q. (2015). The roles of school psychological environment in grades 4-6 students’ cognitive development: A multilevel analysis of the national representative data. Journal of Psychological Science, 38(1), 2-10. |
| [61] |
Toth S. L., & Manly J. T. (2019). Developmental consequences of child abuse and neglect: Implications for intervention. Child Development Perspectives, 13(1), 59-64.
doi: 10.1111/cdep.12317 URL |
| [62] |
Ungar M., & Theron L. (2020). Resilience and mental health: How multisystemic processes contribute to positive outcomes. The Lancet Psychiatry, 7(5), 441-448.
doi: 10.1016/S2215-0366(19)30434-1 URL |
| [63] |
Wang M.-T., & Degol J. L. (2016). School climate: A review of the construct, measurement, and impact on student outcomes. Educational Psychology Review, 28(2), 315-352.
doi: 10.1007/s10648-015-9319-1 URL |
| [64] |
Wang Y., Luo Y., & Chen H. (2024). Sex difference in the relationship between environmental unpredictability and depressive symptom in Chinese adolescents: The chain mediating role of sense of control and fast life history strategies. Journal of Affective Disorders, 364, 178-187.
doi: 10.1016/j.jad.2024.08.045 pmid: 39142584 |
| [65] |
Young E. S., Frankenhuis W. E., & Ellis B. J. (2020). Theory and measurement of environmental unpredictability. Evolution and Human Behavior, 41(6), 550-556.
doi: 10.1016/j.evolhumbehav.2020.08.006 URL |
| [66] |
Zhang Y., Xu W., McDonnell D., & Wang J. L. (2024). The relationship between childhood maltreatment subtypes and adolescent internalizing problems: The mediating role of maladaptive cognitive emotion regulation strategies. Child Abuse & Neglect, 152, 106796.
doi: 10.1016/j.chiabu.2024.106796 URL |
| [67] | Zhao X., Zhang Y., Li L., Zhou Y., Li H., & Yang S. (2005). Reliability and validity of the Chinese version of childhood trauma questionnaire. Chinese Journal of Clinical Rehabilitation, 9(20), 105-107. |
| [68] |
Zhou C., Tao S., Liu H., Wang C., Qi X., & Dong Q. (2016). The role of collective perception of school psychological environment in grades 4-6 students’ academic achievement. Acta Psychologica Sinica, 48(2), 185-198.
doi: 10.3724/SP.J.1041.2016.00185 URL |
| [69] | Zhou H., & Long L. R. (2004). Statistical remedies for common method biases. Advances in Psychological Science, 12(6), 942-950. |
| Viewed | ||||||
|
Full text |
|
|||||
|
Abstract |
|
|||||
